
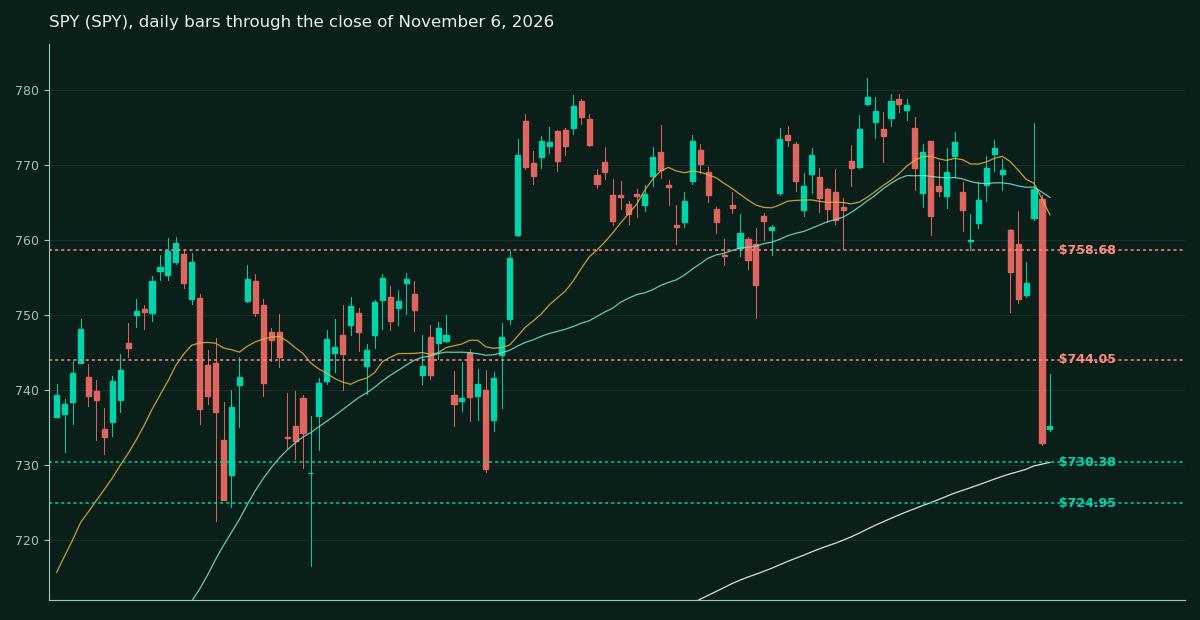
| SPY $735.29 | -4.4% on the week | RSI 35.1 | Closed the week on its 200-day average at $730.38 |
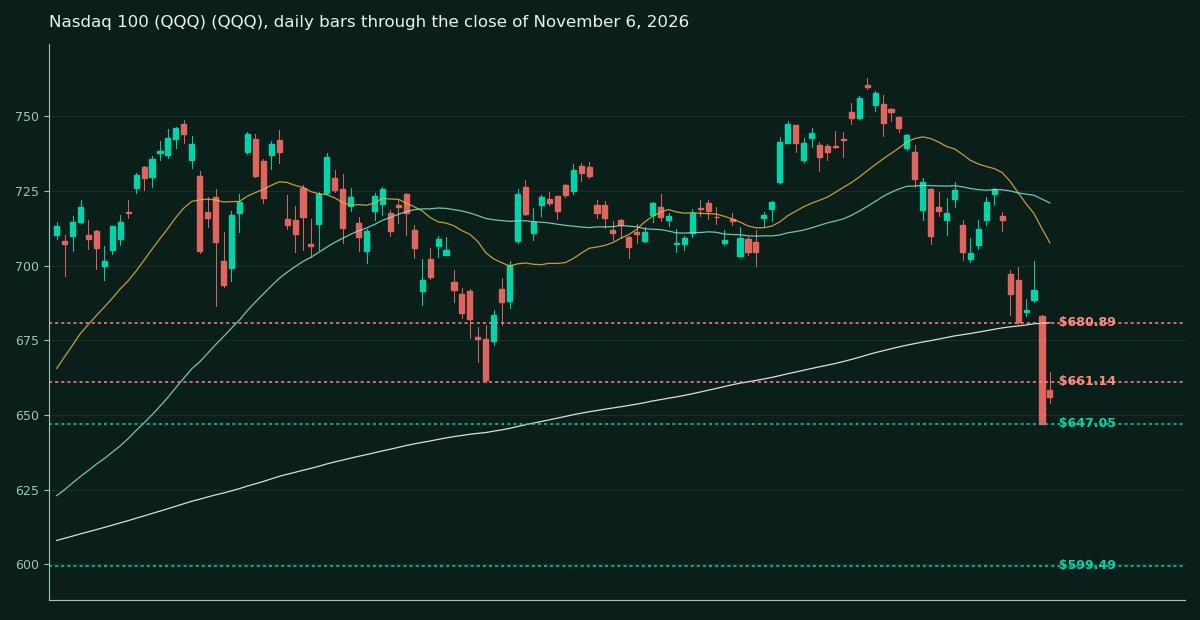
| QQQ $656.10 | -8.3% on the week | RSI 31.4 | Closed below its 200-day average at $680.89 |
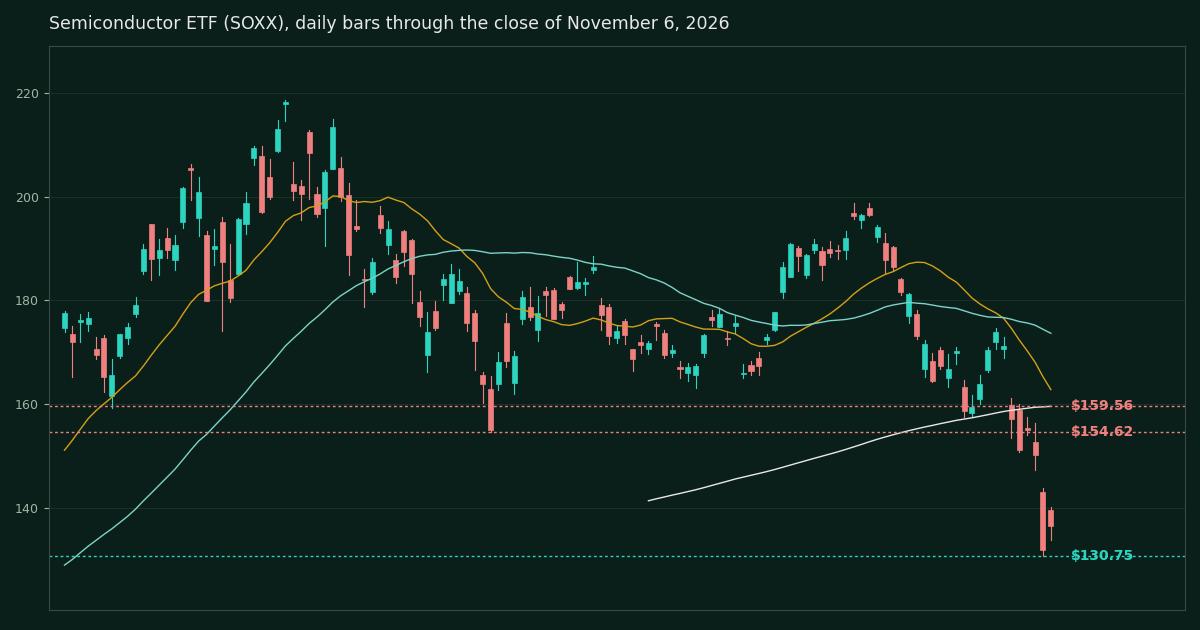
| SOXX $136.53 | -20.3% on the week | RSI 30.5 | The damage gauge. Rout low at $130.75, next shelf $115.11 |
The gauges sit on top of the map and are graded first every week. When the index lines go, the name levels become scenery.
What did the week do to the map?
It stress-tested every line on it, in both directions, inside six sessions. The October 30 map was drawn at the close of Thursday, October 29, with the complex oversold at the edges and broken in the middle. What followed was not a straight line down. Monday and Tuesday chopped. Wednesday, November 4, ripped upward hard enough for Microsoft to close above its bounce target and print a new 52-week high. Thursday, November 5, took it all back in the worst index session since April 2025, with the S&P 500 down 4.36% and the semiconductor names down two to four times that. Friday brought a violent rebound led by the most oversold names on the board. This article grades the old map against that week, strikes the targets the tape has killed, and draws the new map from the close of Friday, November 6, 2026.
The headline numbers are these. Fifteen of the eighteen names in the map finished the week lower. Fourteen of the eighteen downside targets were reached, and ten of the fourteen were overshot by at least another 10% before Friday's bounce. Only three names held their ground. Amazon rose 6.4% after its earnings gap landed on the support cluster this map marked. Alphabet, the capitulation name of October 29, refused to make a new low even on Thursday. Microsoft ended the week almost exactly where it started, by way of a new all-time high and a 5% round trip. Everything else in the AI complex is now below its 200-day average, including NVIDIA, Micron, and TSMC, three names whose long-term uptrends were intact a week ago.
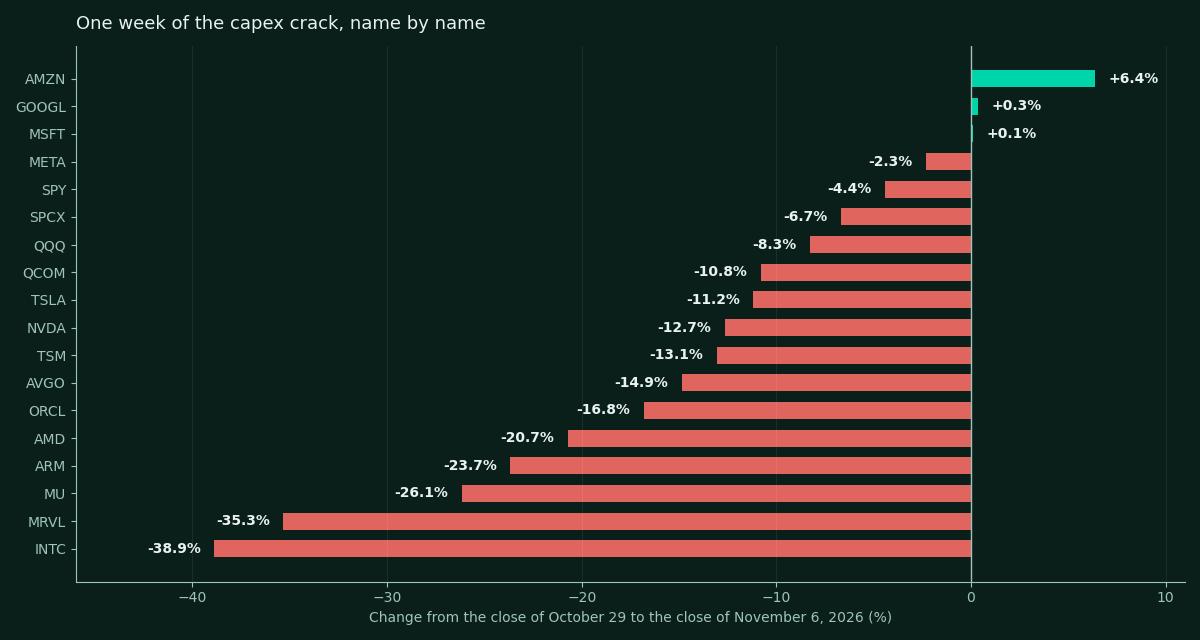
The map grows this week. SOXX joins SPY and QQQ as a third gauge, and BlackBerry, Nebius and Akamai join the names, because that is where a large part of this site's readership holds its risk. The four new lines debut ungraded in the tables and sections below and enter the grading loop next week.
How did the October 30 targets grade?
The old map set a downside target and a bounce target for every name. Here is the full grading, with nothing quietly dropped. The grades say what price did at the level. Hit and bounced means the level held. Hit and broke below, or broke above, means it failed on a close. Touched intraday only means price probed it and never closed there. A target marked struck is dead. It is removed from the new map, and the reason is on the record.
| Name | Oct 30 downside target | Grade | Oct 30 bounce target | Grade |
|---|---|---|---|---|
| MSFT | $488.15 | Untested | $551.15 | Hit, broke above Nov 4, then lost in the rout |
| GOOGL | $267.67 | Untested, support held all week | $314.90 | Untested |
| AMZN | $215.18 | Untested ( | $243.38 | Hit and broke above |
| META | $556.56 | Untested | $642.70 | Touched intraday only, Nov 4 |
| ORCL | $122.76 | Hit and broke below | $157.28 | Untested ( |
| NVDA | $204.28 | Hit and broke below | $222.37 | Untested |
| AMD | $498.70 | Hit and broke below | $639.00 | Untested ( |
| AVGO | $320.23 | Hit and broke below | $353.57 | Untested |
| MRVL | $182.62 | Hit and broke below | $242.79 | Untested ( |
| MU | $853.87 | Hit and broke below | $985.23 | Untested ( |
| INTC | $68.50 | Hit and broke below | $81.79 | Untested ( |
| ARM | $208.30 | Hit and broke below | $249.04 | Untested |
| TSM | $406.88 | Hit and broke below | $477.89 | Untested ( |
| QCOM | $170.40 | Hit and broke below | $205.85 | Untested ( |
| TSLA | $381.63 | Hit and broke below | $432.86 | Untested |
| SPCX | $130.39 | Hit, broke below, then reclaimed | $149.68 | Untested |
| SPY | $744.05 | Hit and broke below | $781.62 | Untested |
| QQQ | $679.16 | Hit and broke below | $725.41 | Untested |
Two structural calls from the first map also get graded, because they mattered more than any single target. The first map said that if SPY lost $758.68, the rotation becomes a correction. SPY lost it on Thursday and the correction arrived the same day. The first map also said Qualcomm was the complex's last shelter, and that a break of its average stack would say the selling had reached everyone. Qualcomm's stack broke on Friday, October 30, the first session after the map. Both tells fired, in the order the map laid out.
What did the tape teach this week?
In a correlation event, the next support is a waypoint, not a floor. Ten names did not just reach their downside targets, they fell at least another 10% past them within days. Micron's target was $853.87. It printed $650. Marvell's was $182.62. It printed $132.54. Single-name levels are drawn from single-name history, and Thursday was not a single-name event. When the index levels go, the name levels become scenery. The practical fix is in the new map. Every target now comes with the shelf below it marked, and the index lines are graded first.
The names that held were the ones where the selling was already finished. Alphabet printed an RSI of 15.6 on October 29, the deepest washout reading in the complex, and then refused to close below $278.50 for six straight sessions, including a higher low on the worst day of the week. Amazon gapped into a marked support cluster on its earnings and never looked back. Capitulation completed is a floor. Capitulation still in progress, which described most of the semi complex on October 29, is not.
An earnings gap into support and a news gap through support are different animals. Amazon fell to its $225.55 cluster on a print the market had already decided to punish, and buyers were waiting at the level. Intel gapped through every support on displacement news and kept falling for six more sessions, because the news changed what the business is, not just what the quarter was. The first map flagged the distinction in the Intel section. The week proved it at scale.
Slow bleeds do not bottom on schedule. Broadcom entered the week 30.3% below its high with an RSI of 41.8, the grind signature. It exits the week 40.7% below its high at $293.69, having never printed a capitulation candle on the way down. Arm fell another 23.7%. Oracle's base, which the first map called the most advanced repair job in the complex, broke entirely. A falling stock with a mid-range RSI is not cheap. It is unfinished.
Friday's rebound was a covering signature, not a confirmation. The leaders were the most oversold names on the board. AMD rose 11.04%, Intel 7.71%, SpaceX 8.62%, TSMC 6.33%, on volume between 1.5 and 1.8 times average in the big semis. That is short covering and bargain reflex, and it is how tradable lows start. It is not how they confirm. Confirmation is a higher low on the retest and a reclaimed average or two, and as of Friday's close not one broken name has reclaimed even its 20-day average.
Where does every name stand on one page?
Every level below is drawn from daily bars through the close of Friday, November 6, 2026, by the same method as the first map. Clustered swing highs and lows from the past year of trading, merged with any moving average on the same shelf. Where a name has fallen through its last clustered shelf, the table says open air, because inventing a level the chart does not contain would be worse than admitting the air pocket. Open air, in the table below, means there is no such shelf left under the price. Four names join the map this week: SOXX as the third gauge, and BlackBerry, Nebius and Akamai in their own section below. The first map is here for anyone who wants to check the grading against the original lines.
| Name | Close | RSI | From high | Support 1 | Support 2 | Resistance 1 | Downside target | Bounce target | Bias |
|---|---|---|---|---|---|---|---|---|---|
| SPY | $735.29 | 35.1 | -5.9% | $730.38 | $724.95 | $744.05 | $724.95 | $758.68 | On the 200-day line |
| QQQ | $656.10 | 31.4 | -14.0% | $647.05 | $599.49 | $661.14 | $599.49 | $680.89 | Below the 200-day |
| SOXX | $136.53 | 30.5 | -37.6% | $130.75 | $115.11 | $154.62 | $115.11 | $159.56 | Below the 200-day |
| MSFT | $530.61 | 52.1 | -5.1% | $517.75 | $504.96 | $551.15 | $504.96 | $559.15 | Range, top half |
| GOOGL | $284.78 | 29.9 | -30.3% | $278.50 | $272.11 | $296.49 | $267.67 | $314.90 | Basing after capitulation |
| AMZN | $259.30 | 54.2 | -9.7% | $253.95 | $243.94 | $266.45 | $243.94 | $274.75 | Uptrend resumed |
| META | $610.15 | 36.7 | -21.8% | $594.81 | $583.80 | $631.94 | $556.56 | $642.70 | Base attempt |
| ORCL | $116.10 | 38.6 | -53.6% | $109.21 | $100.00 | $122.76 | $100.00 | $131.58 | Downtrend |
| NVDA | $186.64 | 30.8 | -23.3% | $181.46 | $170.30 | $192.84 | $170.30 | $204.67 | Below the 200-day |
| AMD | $449.04 | 38.4 | -31.8% | $438.87 | $415.98 | $469.22 | $393.36 | $498.70 | Snap-back, structure damaged |
| AVGO | $293.69 | 32.6 | -40.7% | $289.77 | Open air | $320.23 | Open air below $289.77 | $335.81 | Bleed accelerated |
| MRVL | $141.20 | 26.2 | -57.2% | $132.54 | Open air | $170.84 | $132.54, then air | $185.05 | Capitulation bounce attempt |
| MU | $690.00 | 31.3 | -45.0% | $650.00 | Open air | $756.73 | Air below $650 | $756.73 | Trend break |
| INTC | $56.28 | 25.7 | -60.5% | $51.51 | $42.27 | $68.50 | $42.27 | $68.50 | Oversold bounce in a collapse |
| ARM | $174.62 | 31.1 | -61.4% | $163.13 | $125.17 | $208.30 | $125.17 | $208.30 | Downtrend, no base |
| TSM | $375.44 | 36.3 | -23.0% | $351.19 | $331.92 | $381.08 | $331.92 | $401.48 | Broken, repair candidate |
| QCOM | $165.41 | 44.3 | -36.4% | $157.54 | $148.25 | $169.69 | $148.25 | $184.49 | Shelter lost, repair candidate |
| TSLA | $358.22 | 42.4 | -28.2% | $349.75 | $337.24 | $372.14 | $337.24 | $383.87 | Uptrend broken |
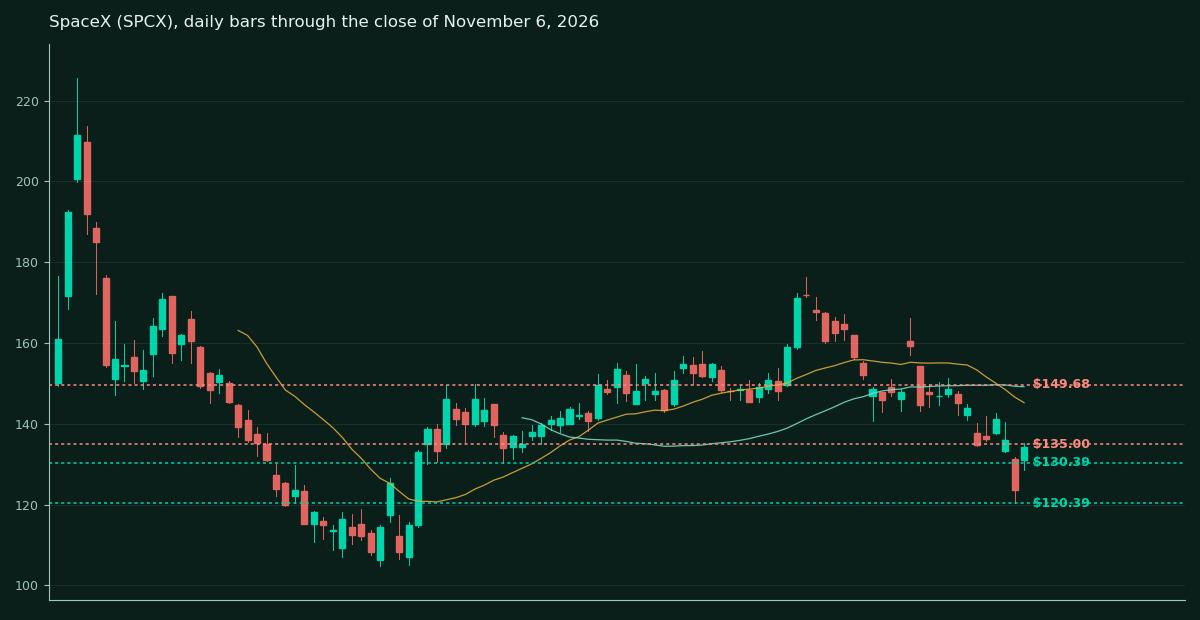
| SPCX | $134.27 | 42.5 | -40.5% | $130.39 | $120.39 | $135.00 | $120.39 | $149.68 | Base stress-tested |
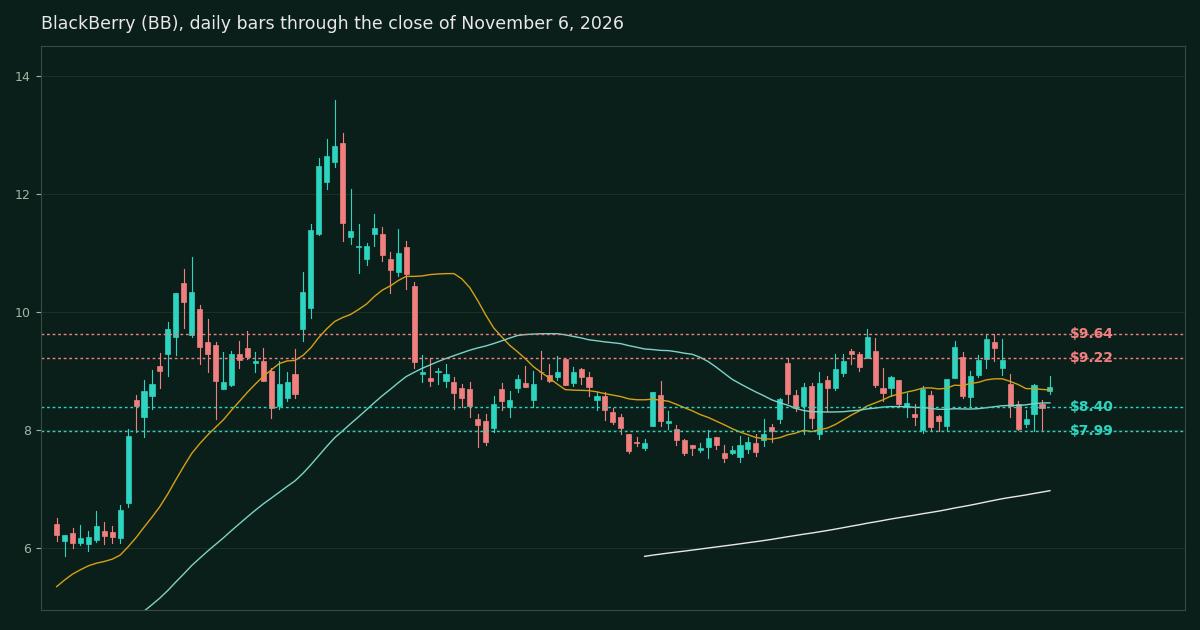
| BB | $8.74 | 50.7 | -35.7% | $8.40 | $7.99 | $9.22 | $7.99 | $9.64 | Range, above every average |
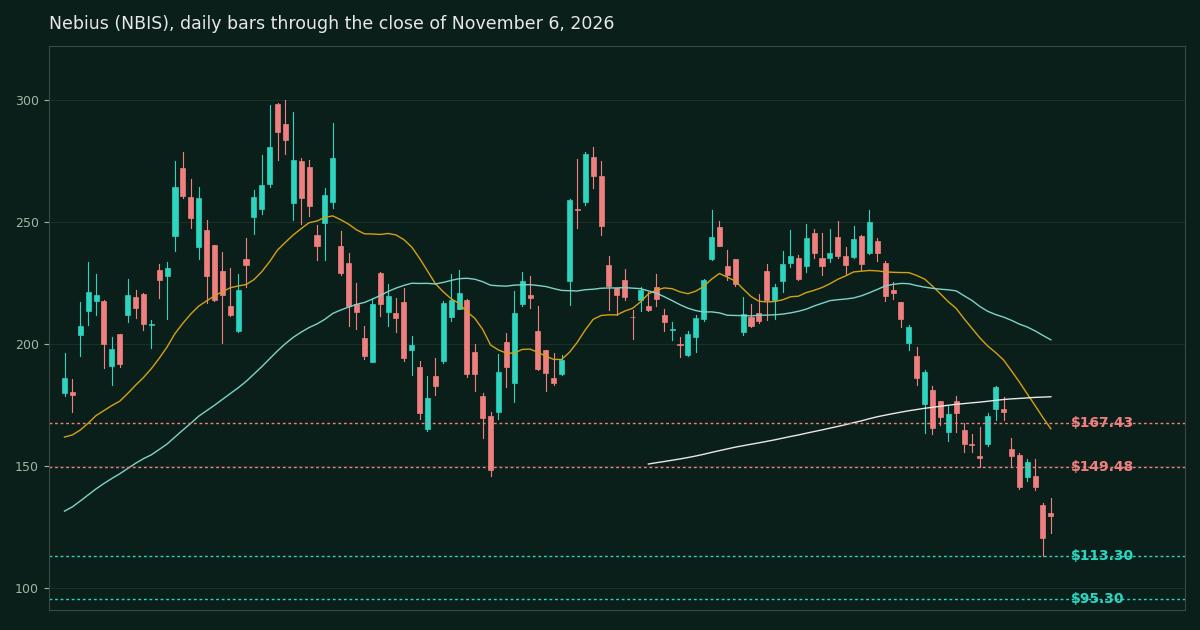
| NBIS | $129.49 | 34.0 | -56.8% | $113.30 | $95.30 | $149.48 | $95.30 | $167.43 | Oversold bounce in a downtrend |
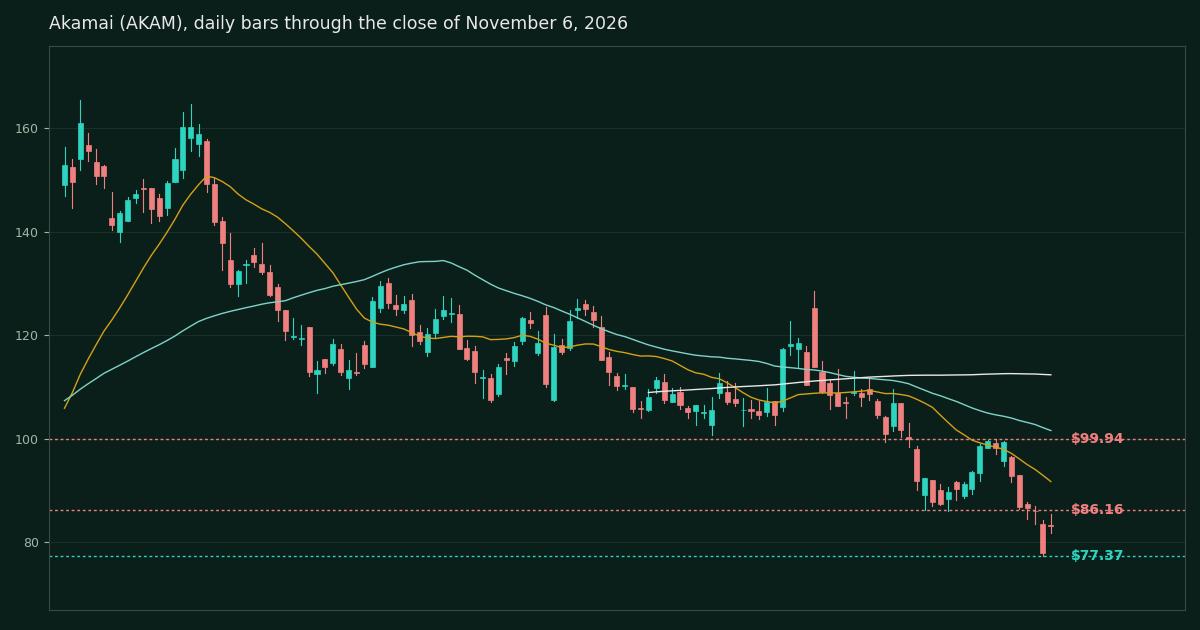
| AKAM | $83.09 | 36.5 | -49.8% | $77.37 | Open air | $86.16 | Air below $77.37 | $99.94 | Post-earnings break, repair candidate |
Read the RSI column against last week's. The oversold bench has been restocked from the other direction. Seven lines now sit at or below an RSI of 31.3, six stocks plus the SOXX gauge at 30.5, and the two most oversold names in the complex, Intel at 25.7 and Marvell at 26.2, are not the washout names of October 29. They are the names the rout created. Read the from-high column as the new damage report. Five names are now more than 50% below their highs, and the index itself closed the week on its 200-day average.
What do the hyperscaler charts say now?
Microsoft (MSFT). Bias: range, top half.
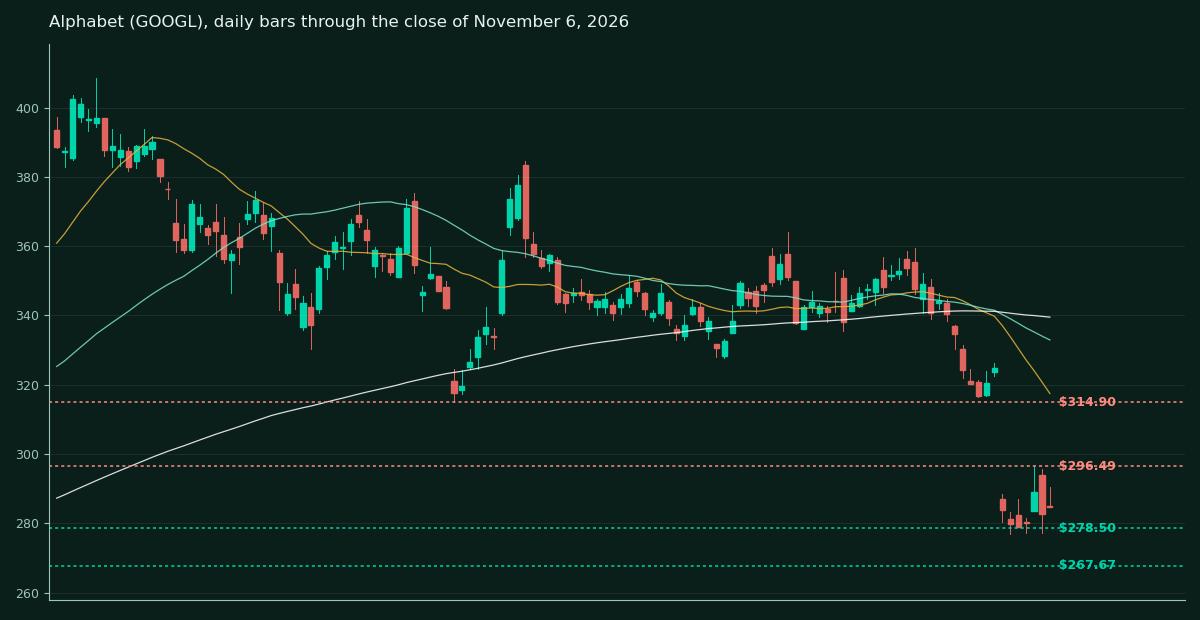
The tape. Close $530.61. Day -0.99%. Week +0.09%. RSI 52.1. ATR $15.44. 20 DMA $531.41. 50 DMA $516.65. 200 DMA $439.85. From the 52-week high -5.1%.
The levels. Support at $517.75, $504.96. Resistance at $551.15, $559.15. Downside target $504.96. Bounce target $559.15.
Microsoft had the most eventful flat week in the map. It dipped to $504.96 on Monday, closing through $517.75 for one session, then ripped on Wednesday to a close of $555.80 and an intraday print of $559.15, a new 52-week high, straight through the old bounce target. Thursday's rout took the breakout back, and Friday left the stock almost exactly where the first map found it, a point above its 50-day average and a point below its 20-day. The range survived the worst week of the season. That is what leadership looks like in a correction.
The lines move up. Support is $517.75 first, the shelf that held on five of six closes, then the rout low at $504.96. Resistance is the old high at $551.15 and the new intraday high at $559.15 above it. A close above $559.15 is again a breakout into open air. A close below $504.96 would say the rout reached the holdout after all, and no other hyperscaler chart would be left standing.
Alphabet (GOOGL). Bias: basing after capitulation.
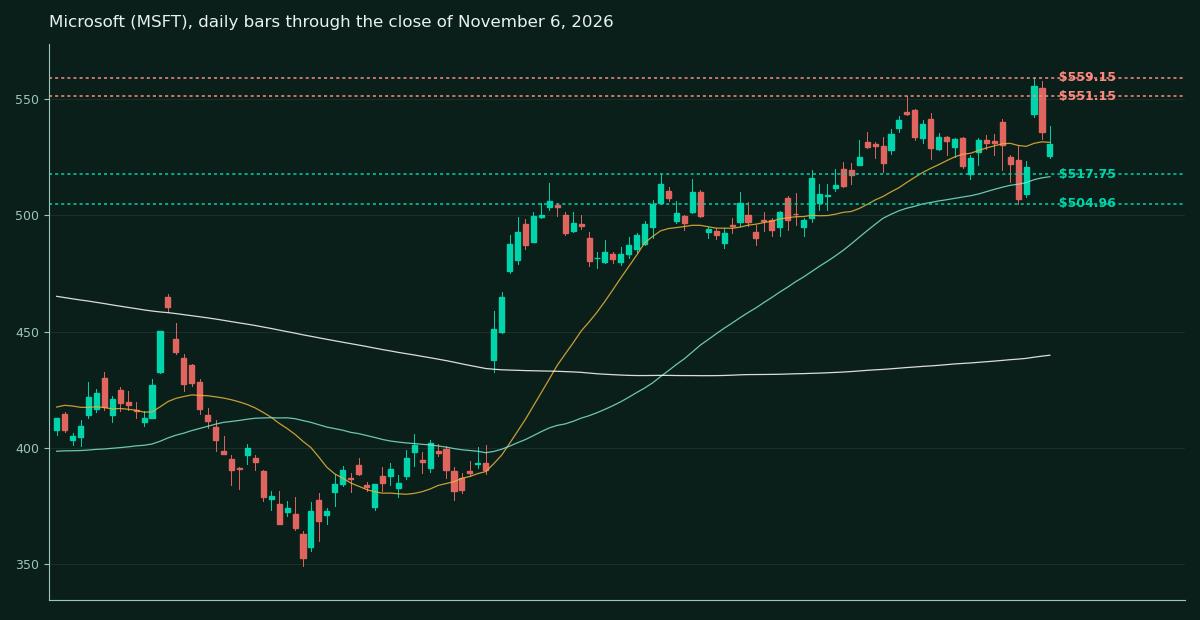
The tape. Close $284.78. Day +0.78%. Week +0.34%. RSI 29.9. ATR $10.68. 20 DMA $317.44. 50 DMA $332.93. 200 DMA $339.51. From the 52-week high -30.3%.
The levels. Support at $278.50, $272.11, $267.67. Resistance at $296.49, $314.90. Downside target $267.67. Bounce target $314.90.
The first map asked for one specific print from this name. A higher low holding $278.50 would mark the washout as complete. Alphabet delivered it under maximum pressure. The stock probed $276.92 intraday on October 30, never closed below $278.50 on any of the six sessions, and on Thursday, while QQQ fell 6.5% and the semis fell twice that, Alphabet closed at $282.57, a higher low than where the rout found it. RSI has worked from 15.6 back to 29.9 without a V-shaped reversal. This is what basing looks like, and it is happening in the name that fell 12.64% in a day a week ago.
The map below the price is unchanged, because it never got used. Support stays at $278.50, then $272.11, then the low at $267.67, which remains the downside target on any close below $272.11. Overhead, the week's high at $296.49 is the first line, and the gap edge at $314.90 remains the bounce target that changes the conversation. The averages stacked between $317 and $340 are the longer repair job. Alphabet does not need to reclaim them this month. It needs to keep not making new lows.
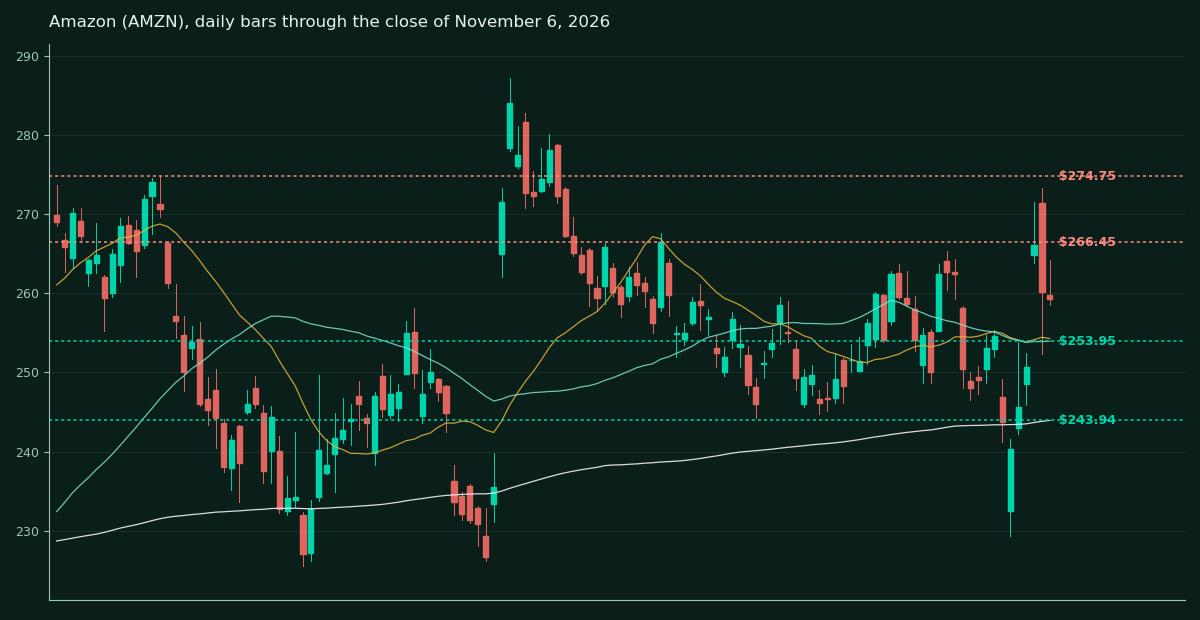
Amazon (AMZN). Bias: uptrend resumed.
The tape. Close $259.30. Day -0.35%. Week +6.36%. RSI 54.2. ATR $9.19. 20 DMA $254.28. 50 DMA $253.95. 200 DMA $243.94. From the 52-week high -9.7%.
The levels. Support at $253.95, $243.94. Resistance at $266.45, $274.75, $287.20. Downside target $243.94. Bounce target $274.75.
Amazon is the map's best call and the week's best chart, and it is not close. The earnings gap landed on the $225.55 support cluster in extended hours, exactly where the first map said the test would come. Regular-session trade never even reached it, printing a low of $229.36 on Friday, October 30. From there the stock reclaimed its 200-day average, then its 20-day and 50-day stack near $254, then the $261.26 resistance, and printed $273.23 intraday on Thursday morning before the rout trimmed the week to a 6.36% gain. The downside target of $215.18 is struck. It described a world in which the support test failed, and the test passed in the first hour.
The new map is an uptrend map. Support is the average stack at $253.95 to $254.28, then the 200-day average at $243.94, which is now the downside target on a failure of the stack. Resistance is the October swing shelf at $266.45, then $274.75, then the 52-week high at $287.20. The bounce target is $274.75. Amazon and Microsoft are the two hyperscalers above every major average, and Amazon is the only one of the two whose trend points up.
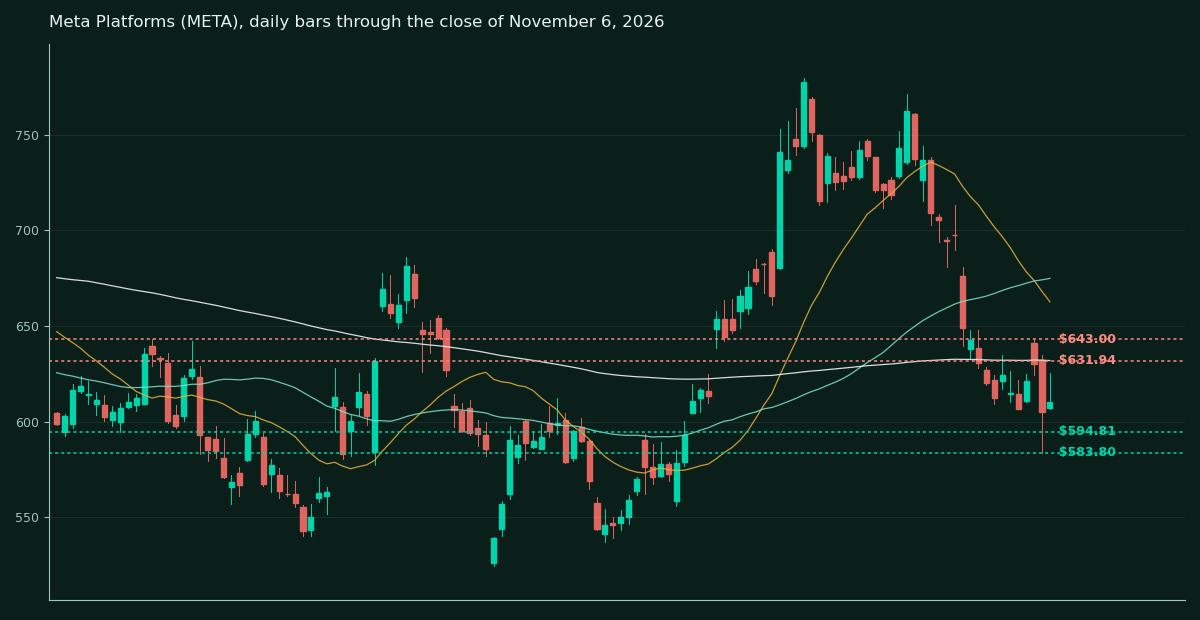
Meta Platforms (META). Bias: base attempt.
The tape. Close $610.15. Day +0.84%. Week -2.30%. RSI 36.7. ATR $24.14. 20 DMA $662.67. 50 DMA $674.92. 200 DMA $631.94. From the 52-week high -21.8%.
The levels. Support at $594.81, $583.80, $577.07, $556.56. Resistance at $631.94, $643.00. Downside target $556.56. Bounce target $642.70.
The first map named the template for how oversold names climb out. Meta holding above $594.81 while its RSI works back over 35. Both halves of that sentence printed this week. Meta probed $583.80 intraday on Thursday but never closed below $594.81, and RSI stands at 36.7, up from 27.8. The stock even tagged $643.09 intraday on Wednesday, a whisker through the $642.70 bounce target, without closing there. The base attempt survived the rout. It did not complete.
Support is $594.81 first, now a twice-defended line, then the rout low at $583.80, then $577.07 and the $556.56 target shelf. Resistance is the 200-day zone at $631.94 and then $642.70 to $643.00, which needs a close this time, not a tag. A close above $643.00 completes the base the first map described. A close below $583.80 reopens the downside target at $556.56. Meta is the furthest along of the broken hyperscalers, and the gap between its price and its 20-day average at $662.67 says how much repair is still overhead.
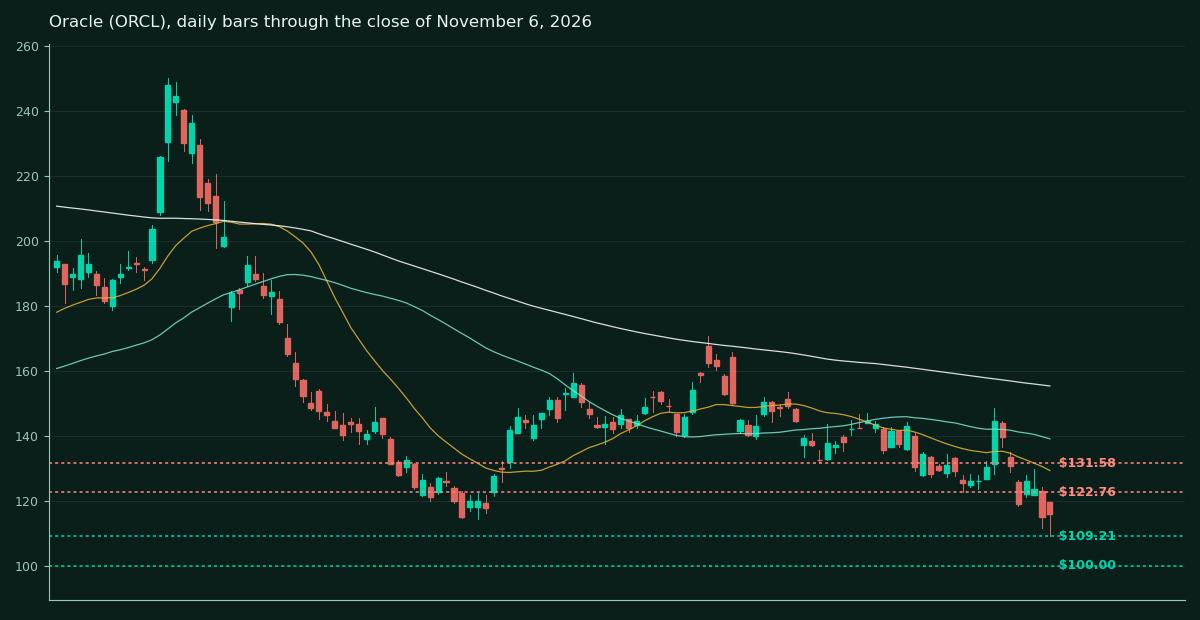
Oracle (ORCL). Bias: downtrend.
The tape. Close $116.10. Day +0.82%. Week -16.81%. RSI 38.6. ATR $8.51. 20 DMA $129.36. 50 DMA $139.12. 200 DMA $155.40. From the 52-week high -53.6%.
The levels. Support at $109.21, $100.00. Resistance at $122.76, $131.58. Downside target $100.00. Bounce target $131.58.
The first map's clearest error lives here, and it goes on the record. Oracle was called broken but basing, weeks ahead of the other broken names on the repair road, because it had reclaimed its 20-day average off the October low. The base broke within two sessions. Price closed through $137.99, $134.99, and $131.58 in sequence, reached the $122.76 downside target, and kept going to a low of $109.21 on Friday. The bounce target of $157.28 is struck. A reclaimed 20-day average, it turns out, is a first step and nothing more. It is not a base until the lows stop falling, and Oracle's never did.
The new map is a downtrend map. Support is the week's low at $109.21 and then the $100.00 round number, which is a psychological shelf rather than a clustered one, and the downside target on a close below $109.21. Resistance is the old low at $122.76, flipped to supply, then $131.58. The bounce target is $131.58, and reaching it would still leave the stock below its 50-day average. Thursday's Microsoft wind-down of rented Oracle capacity, covered in the Weekly Close, gave the tape a fundamental reason to keep pressing, and the chart offers no line that argues back yet.
What do the semiconductor charts say now?
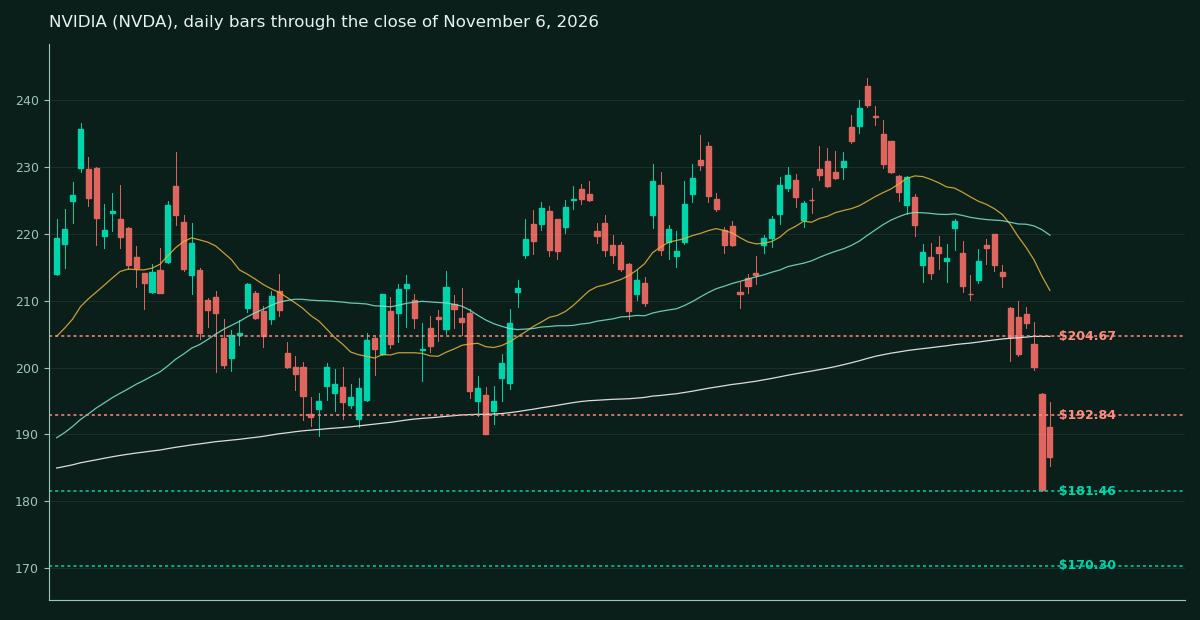
NVIDIA (NVDA). Bias: below the 200-day.
The tape. Close $186.64. Day +2.78%. Week -12.65%. RSI 30.8. ATR $7.77. 20 DMA $211.55. 50 DMA $219.81. 200 DMA $204.67. From the 52-week high -23.3%.
The levels. Support at $181.46, $177.14, $170.30. Resistance at $192.84, $204.67. Downside target $170.30. Bounce target $204.67.
The first map called NVIDIA a range drifting down, with the $204 to $208 shelf, where the 200-day average met the first support, as the downside target. The shelf held for three sessions and failed on Thursday, when the stock closed at $181.60, through the 200-day average, through $198.66, and through $190.32 in a single session. Friday's 2.78% bounce on 1.59 times average volume is the first attempt at a floor. NVIDIA now sits below every major average for the first time in this drawdown, and it reports on November 18 with the chart, not just the guide, needing repair.
Support is the week's low at $181.46, then the spring shelf at $177.14, then the clustered shelf at $170.30, which is the downside target. Resistance is the heavy shelf at $192.84, where eight swing points from the spring and summer now sit as supply, then the 200-day average at $204.67. The bounce target is the 200-day reclaim at $204.67, and nothing about this chart is repaired until it prints. Position in this name into a print, with price under the 200-day and ATR near $8, is a sizing decision before it is a view.
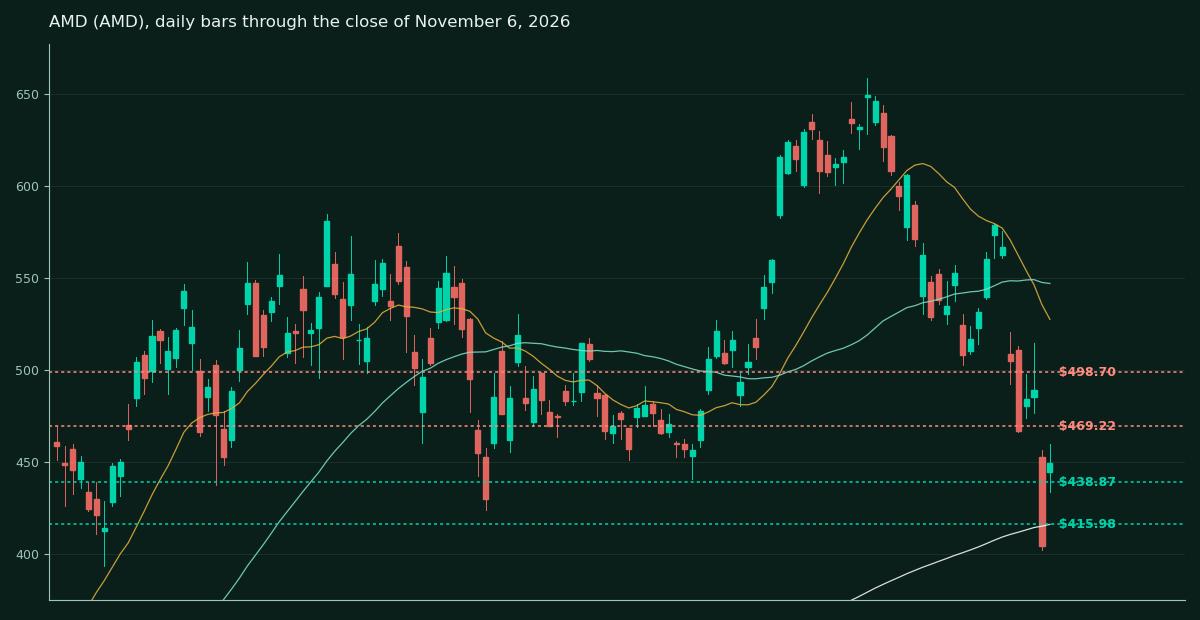
AMD (AMD). Bias: snap-back, structure damaged.
The tape. Close $449.04. Day +11.04%. Week -20.72%. RSI 38.4. ATR $36.61. 20 DMA $527.30. 50 DMA $546.81. 200 DMA $415.98. From the 52-week high -31.8%.
The levels. Support at $438.87, $415.98, $402.10. Resistance at $469.22, $498.70. Downside target $393.36. Bounce target $498.70.
The first map praised this chart and then printed its risk in plain words. If the 50-day average at $547.58 fails, there is little traded history until $498.70. The 50-day failed on Friday, October 30. The stock reached $498.70 on Monday and treated it the way the whole complex treated its targets this week, as a waypoint, closing Thursday at $404.40, under its 200-day average, after its own earnings digestion collided with the rout. Friday's 11.04% snap-back on 1.76 times average volume reclaimed the 200-day average and was the largest single-day gain in the map. Both facts belong on the chart. The structure that made AMD the healthiest semi a week ago is gone, and the bounce that replaced it is two sessions old.
Support is the shelf at $438.87, then the 200-day average at $415.98, then the rout low at $402.10. Below that sits the next cluster at $393.36, the downside target on a failed retest. Resistance is $469.22, then the old target at $498.70, flipped to supply, which is the bounce target. ATR is $36.61. A normal day in this stock now moves 8%. The ladder back runs through holding $438.87 on the first retest, and nothing above that line matters until it prints.
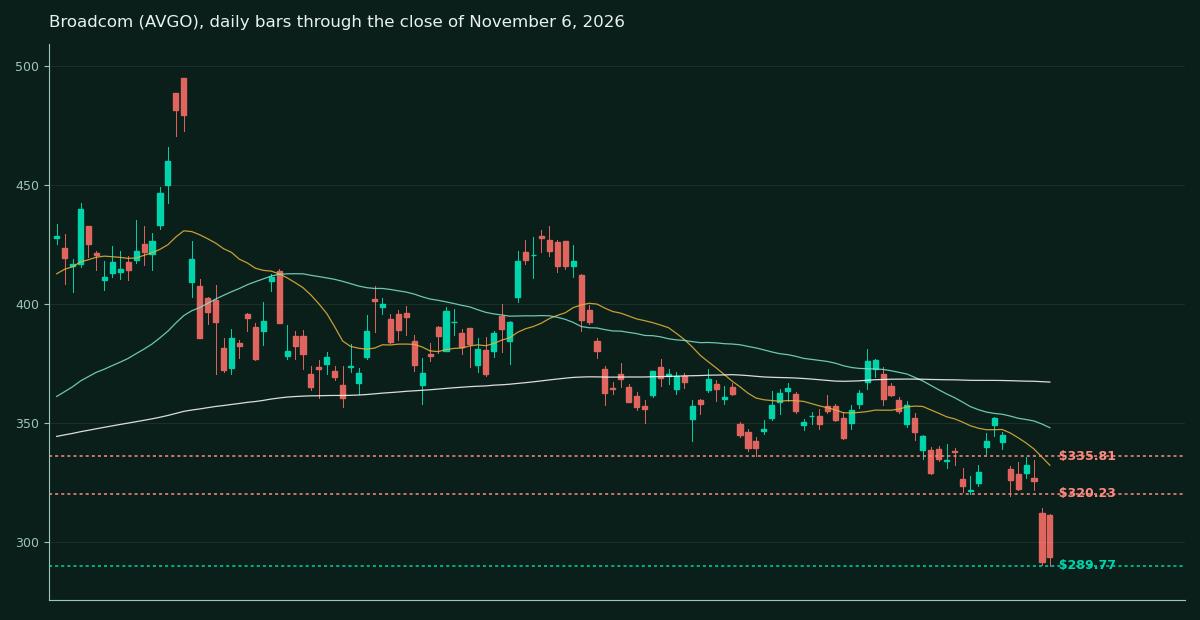
Broadcom (AVGO). Bias: bleed accelerated.
The tape. Close $293.69. Day +0.74%. Week -14.87%. RSI 32.6. ATR $14.75. 20 DMA $332.12. 50 DMA $347.89. 200 DMA $367.09. From the 52-week high -40.7%.
The levels. Support at $289.77, then open air. Resistance at $320.23, $335.81. Downside target open air below $289.77. Bounce target $335.81.
Broadcom was the slow bleed of the first map, down 30.3% from its high on an RSI of 41.8, a grind with no capitulation candle. The grind accelerated. The stock closed through $342.81, $335.81, and $328.58, broke below the $320.23 downside target, and printed a low of $289.77 on Friday, the lowest price in a year. RSI has finally reached 32.6, which says the washout readings are arriving, but Broadcom's own history says its readings arrive late and its repairs take longer. Friday's 0.74% bounce was the weakest in the semi complex. The name that fell slowest is, so far, bouncing slowest.
Support is the week's low at $289.77, and below it this map declines to draw a line. There is no clustered swing shelf within the past year of trading under the price, which is itself the risk statement. Resistance is the old October low at $320.23, flipped to supply, then $335.81. The bounce target is $335.81. Until Broadcom prints a higher low against $289.77, the trend is the only signal this chart offers, and the trend is down.
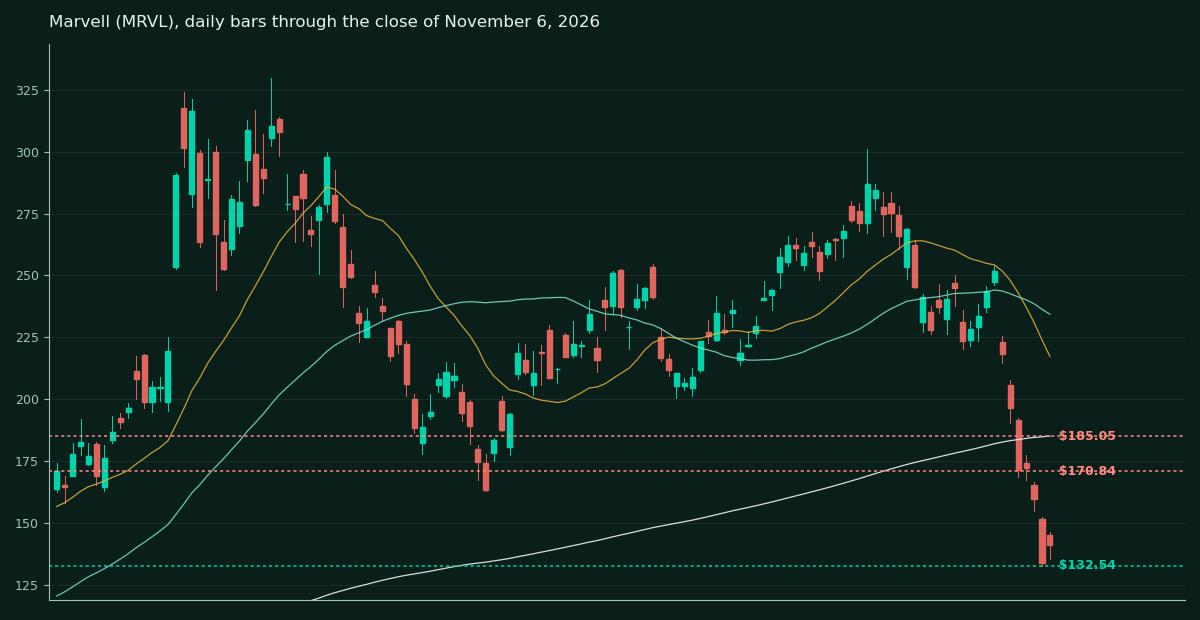
Marvell (MRVL). Bias: capitulation bounce attempt.
The tape. Close $141.20. Day +5.73%. Week -35.33%. RSI 26.2. ATR $18.03. 20 DMA $217.24. 50 DMA $234.31. 200 DMA $185.05. From the 52-week high -57.2%.
The levels. Support at $132.54, then open air. Resistance at $170.84, $185.05. Downside target a retest of $132.54, then air. Bounce target $185.05.
Marvell fell the furthest of any name that entered the week with a standing chart. The news breakdown of October 29, when acquisition reports knocked 13.24% off the stock, turned into a full collapse. The $212.37 support, the $200.62 shelf, and the $182.62 downside target at the 200-day average all failed in sequence, and the stock printed $132.54 on Thursday before Friday's 5.73% bounce. RSI at 26.2 is the second lowest in the map. The first map warned that on deal fear, the first support rarely holds on the first test. Every support failed that test this week.
Support is the week's low at $132.54. Below it, the clustered history sits far under the price, and the honest label is open air. Resistance is the breakdown shelf at $170.84, then the 200-day average at $185.05, which is the bounce target and a long way overhead. The 20-day average at $217.24 is not a target. It is a reminder of where this stock traded two weeks ago. Nothing in this chart argues for anything except size discipline until a higher low prints.
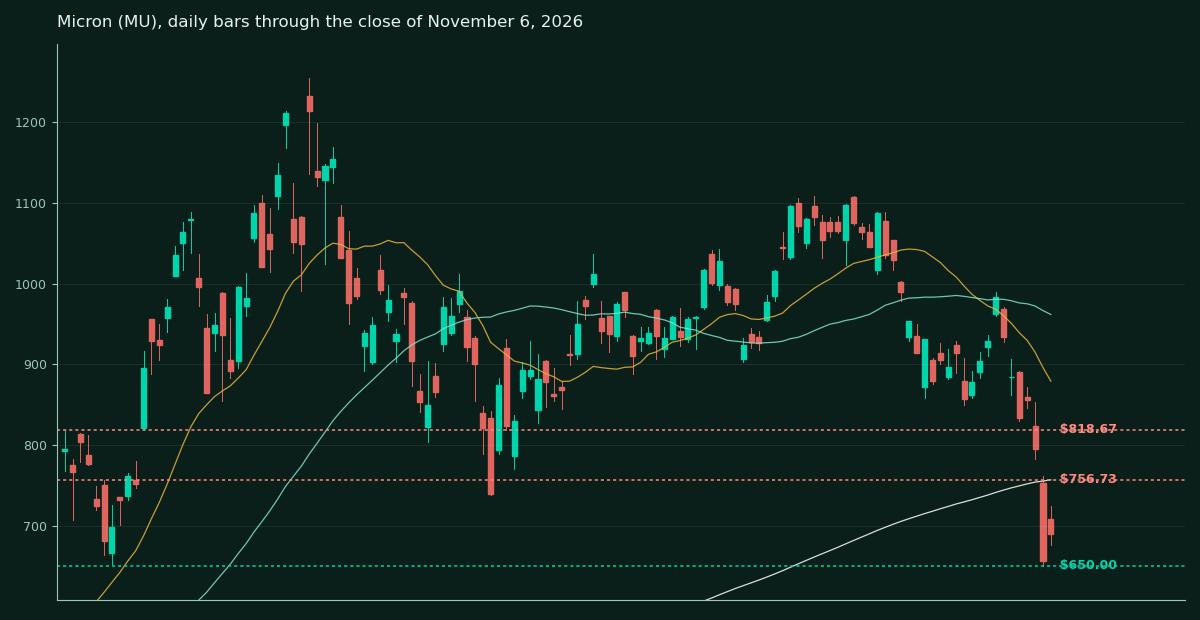
Micron (MU). Bias: trend break.
The tape. Close $690.00. Day +5.12%. Week -26.15%. RSI 31.3. ATR $58.75. 20 DMA $879.01. 50 DMA $961.64. 200 DMA $756.73. From the 52-week high -45.0%.
The levels. Support at $650.00, then open air. Resistance at $756.73, $818.67. Downside target air below $650. Bounce target $756.73.
The first map framed Micron's 25.6% drawdown as a momentum unwind inside a still-intact long-term uptrend, with the 200-day average far below at $744.07. That framing is struck. The unwind ran through $918.88, $893.96, and the $853.87 downside target, through the 200-day average itself, and printed $650.00 on Thursday, 45.0% below the high. Friday's 5.12% bounce on 1.53 times average volume is the first response. The memory trade's fundamentals, mapped in The Memory Play, have not changed this week. The chart has, completely.
Support is the week's low at $650.00, a round number that is also Thursday's intraday print. Below it, the clustered shelves from the past year sit far under the price, from before the run, and the honest label is air. Resistance is the 200-day average at $756.73, now the bounce target, then the shelf at $818.67. ATR is $58.75, the widest in the complex relative to everything except its own history. A two-ATR week in this name is a $118 round trip, and the targets above are drawn with that violence in mind.
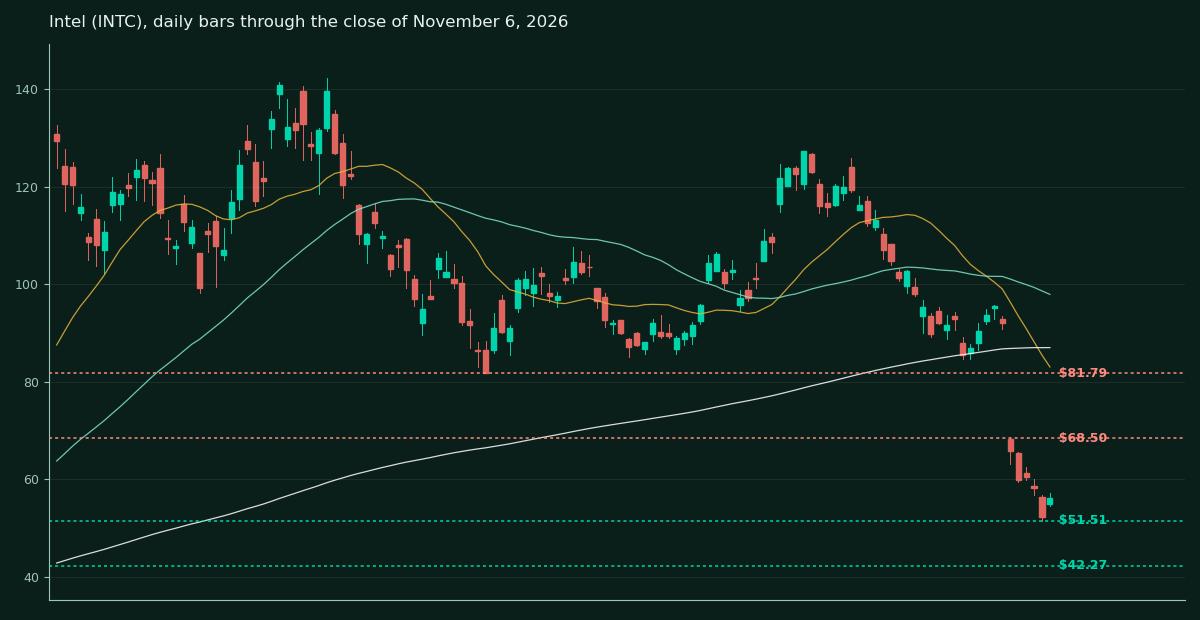
Intel (INTC). Bias: oversold bounce in a collapse.
The tape. Close $56.28. Day +7.71%. Week -38.87%. RSI 25.7. ATR $6.35. 20 DMA $83.08. 50 DMA $97.95. 200 DMA $87.04. From the 52-week high -60.5%.
The levels. Support at $51.51, $42.27. Resistance at $68.50, $81.79. Downside target $42.27. Bounce target $68.50.
Intel is the week's worst performer and its most oversold chart. The post-print gap down that the first map documented kept travelling. The $68.50 target zone, drawn from the April 2026 closes, was reached on the first session, October 30, and the stock fell for four more sessions to a low of $51.51 on Thursday before Friday's 7.71% bounce. RSI at 25.7 is the lowest reading in the map. The displacement story behind the fall is scored in The Displacement Clock, and the tape is voting with it. A stock 60.5% below its high, below every average by a wide margin, has no trend to repair yet. It has only a bounce to grade.
Support is the week's low at $51.51, then the older base cluster at $42.27, which is the downside target if $51.51 fails. Resistance is the old target zone at $68.50, flipped to supply, which is also the bounce target, then $81.79. The distance between the price and the 20-day average at $83.08 is the chart's whole story. Bounces in this name travel fast and mean little until one of them holds a higher low.
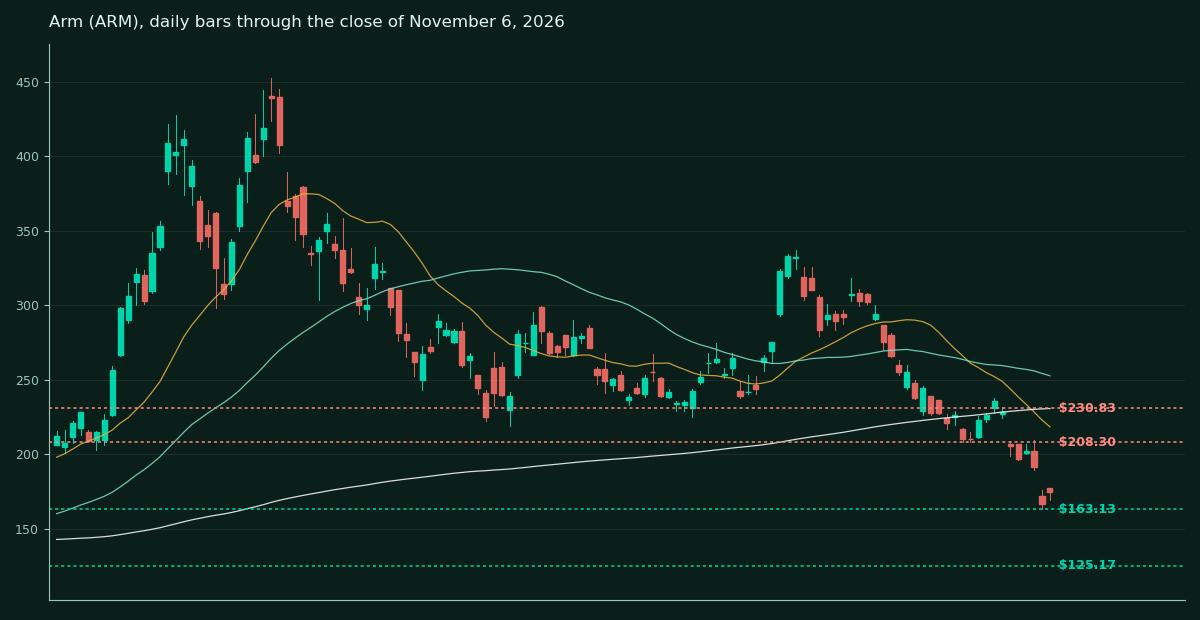
Arm (ARM). Bias: downtrend, no base.
The tape. Close $174.62. Day +4.74%. Week -23.67%. RSI 31.1. ATR $15.69. 20 DMA $218.52. 50 DMA $252.78. 200 DMA $230.83. From the 52-week high -61.4%.
The levels. Support at $163.13, $125.17. Resistance at $208.30, $230.83. Downside target $125.17. Bounce target $208.30.
Arm entered the week sitting exactly on its 200-day average, with the first map's fork drawn in plain words. A weekly close below the line targets $208.30. The line failed on the first session, the target was reached by Monday, and the stock printed $163.13 on Thursday, 61.4% below its high, the deepest drawdown in the complex. Friday's 4.74% bounce changes nothing structural. There is no base here, no higher low, and no reclaimed average. There is a falling stock whose RSI has reached 31.1, which in this name's own recent history has marked the start of basing attempts, not their completion.
Support is the week's low at $163.13, then the older shelf at $125.17, a long way below, which stands as the downside target with the air pocket between them named as the risk. Resistance is the old target at $208.30, flipped to supply and now the bounce target, then the 200-day average at $230.83. The gap between story and tape that the first map flagged has widened. The thesis is winning share and the stock is down three-fifths. The chart gets a vote first.
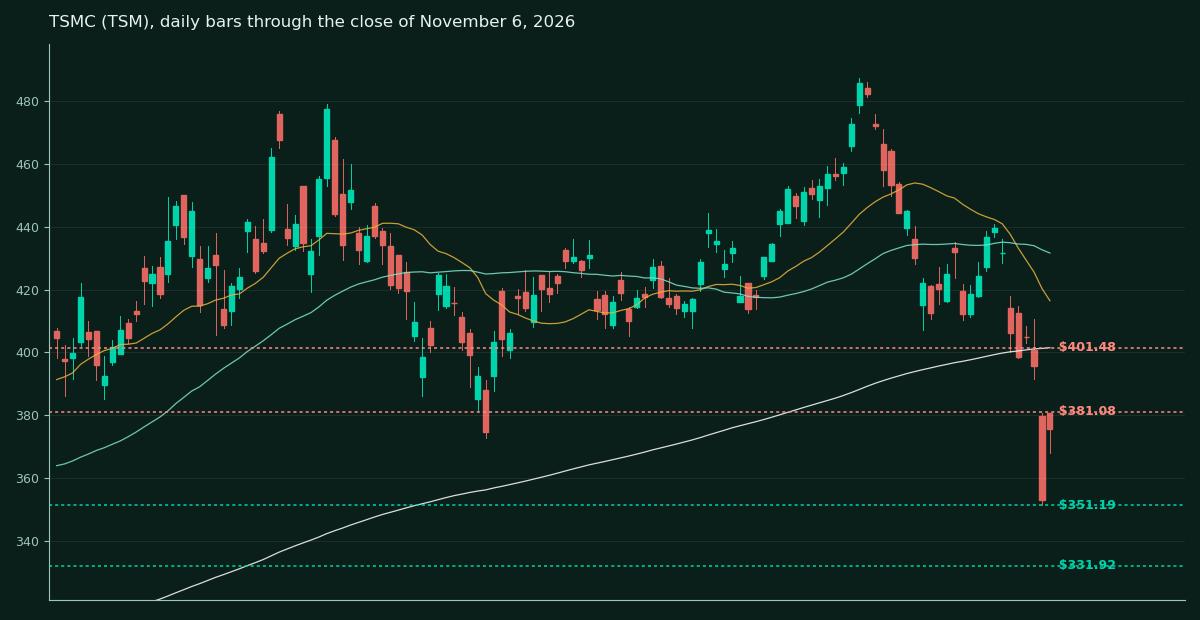
TSMC (TSM). Bias: broken, first repair candidate.
The tape. Close $375.44. Day +6.33%. Week -13.05%. RSI 36.3. ATR $16.84. 20 DMA $416.44. 50 DMA $431.64. 200 DMA $401.48. From the 52-week high -23.0%.
The levels. Support at $351.19, $331.92. Resistance at $381.08, $401.48. Downside target $331.92. Bounce target $401.48.
The first map called TSMC the orderly pullback, the calmest chart in the article, and drew its downside target at $406.88 for a complex-wide washout. The washout came. TSMC closed through $419.19 and $406.88 on Thursday and printed $351.19, below its 200-day average for the first time in this drawdown. Then it printed the strongest repair signal of any broken semi. Friday's 6.33% gain came on 1.70 times average volume, the heaviest buying volume in the complex that day, and it came in the name with the shallowest drawdown and no capex argument of its own. When the foundry that makes every chip in this article gets sold with the complex and bought back first, the selloff was about positioning, and positioning unwinds end name by name.
Support is the week's low at $351.19, then the cluster at $331.92, the downside target on a failed retest. Resistance is the shelf at $381.08, then the 200-day average at $401.48, which is the bounce target. A close above $401.48 would make TSMC the first broken semi to reclaim its long-term line, and that print would matter for the whole map, not just this chart.
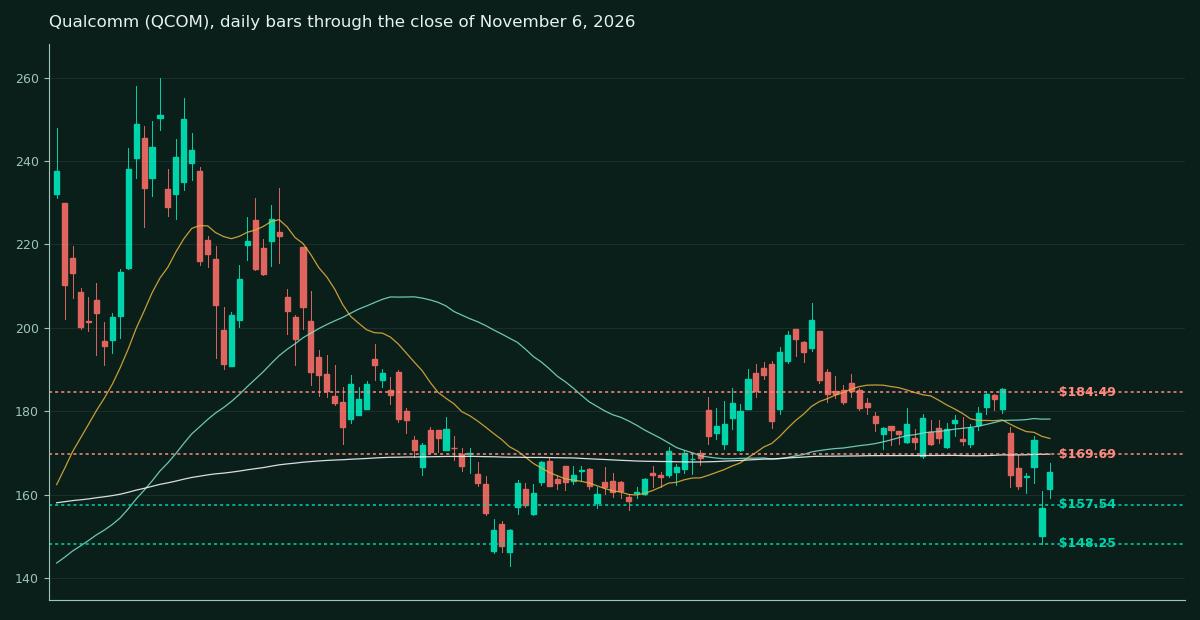
Qualcomm (QCOM). Bias: shelter lost, repair candidate.
The tape. Close $165.41. Day +5.52%. Week -10.79%. RSI 44.3. ATR $9.08. 20 DMA $173.46. 50 DMA $178.11. 200 DMA $169.69. From the 52-week high -36.4%.
The levels. Support at $157.54, $148.25. Resistance at $169.69, $184.49. Downside target $148.25. Bounce target $184.49.
The last shelter fell on the first session after the map. Qualcomm entered the week as the holdout, above every average with the highest RSI in the map, and the first map wrote its failure condition in advance. A close below the $177.20 average stack would say the rotation has reached its last shelter. The stack broke, the $170.40 downside target was reached and passed, and the stock printed $148.25 before Friday's 5.52% bounce. Even so, Qualcomm exits the week as the least damaged semi in the complex. Its RSI of 44.3 leads the group, its Friday close sits within 3% of its 200-day average, and it is the only broken semi whose repair job is measured in one line rather than three.
Support is the cluster at $157.54, then the week's low at $148.25, which is the downside target on a failed hold. Resistance is the 200-day average at $169.69, then the shelf at $184.49, the bounce target. A close above $169.69 would be the first 200-day reclaim in the semi complex and the cleanest single repair print available next week.
What do the benchmarks say now?
SPY (SPY). Bias: on the 200-day line.
The tape. Close $735.29. Day +0.31%. Week -4.43%. RSI 35.1. ATR $10.50. 20 DMA $763.36. 50 DMA $765.68. 200 DMA $730.38. From the 52-week high -5.9%.
The levels. Support at $730.38, $724.95. Resistance at $744.05, $758.68. Downside target $724.95. Bounce target $758.68.
The index is the story now. The first map said SPY was intact, 1.6% below its high, and named $758.68 as the level where a rotation becomes a correction. SPY chopped above that line for three sessions, lost it on Thursday in a 4.36% fall, broke below the $744.05 downside target the same day, and printed $732.71, within half a percent of its 200-day average at $730.38. Friday held the line without reclaiming anything. The index that hid the complex's drawdown for a month has joined it, one line above the level that decides whether this is a correction inside an uptrend or something larger.
Support is the 200-day average at $730.38, tested once and held, then the cluster at $724.95, which is the downside target on a closing break of the average. Resistance is the old target at $744.05, flipped to supply, then the broken shelf at $758.68, the bounce target. Every name chart in this article is downstream of this one. A week of closes above $730.38 keeps the correction frame. A close below $724.95 ends it.
Nasdaq 100 (QQQ) (QQQ). Bias: below the 200-day.
The tape. Close $656.10. Day +1.40%. Week -8.28%. RSI 31.4. ATR $15.45. 20 DMA $707.64. 50 DMA $720.97. 200 DMA $680.89. From the 52-week high -14.0%.
The levels. Support at $647.05, $599.49. Resistance at $661.14, $680.89. Downside target $599.49. Bounce target $680.89.
The first map framed QQQ as a short-term downtrend above a long-term line, with the 200-day average at $679.16 described as the line that decides the quarter. The quarter got its answer on Thursday. QQQ closed at $647.05, through the 200-day average and through the $661.14 second support in one session, and Friday's 1.40% bounce to $656.10 did not reclaim either. The index where the capex fight lives is now below its long-term trend line, and every repair claim in the single names has to be read against that fact.
Support is Thursday's closing low at $647.05. Below it, the next clustered shelf is $599.49, a long way down, and the size of that gap is the risk in the chart, stated plainly rather than smoothed over. Resistance is $661.14, flipped to supply, then the 200-day average at $680.89, which is the bounce target and the repair line. A close back above $680.89 would not end the correction. It would move it back inside an uptrend, which is where every bounce target in this article becomes reachable.
Semiconductor ETF (SOXX). Bias: below the 200-day.
The tape. Close $136.53. Day +3.51%. Week -20.29%. RSI 30.5. ATR $8.06. 20 DMA $162.78. 50 DMA $173.66. 200 DMA $159.56. From the 52-week high -37.6%.
The levels. Support at $130.75, $115.11. Resistance at $154.62, $159.56. Downside target $115.11. Bounce target $159.56.
The sector gauge now sits on top of this map because it settles arguments the single names cannot. The semiconductor complex fell 20.29% in six sessions and closed below its 200-day average at $159.56. The fund holds the whole complex, so its chart is the average of every semiconductor argument in this article, and the average says the trend broke.
Support is Thursday's low at $130.75. Below it, the next clustered shelf is $115.11, and the distance between those two lines is the air pocket in index form. Resistance is the broken October shelf at $154.62, then the 200-day average at $159.56, which is the bounce target and the repair line for the entire complex. Until SOXX reclaims it, every semiconductor bounce target in this map is a trade, not a turn.
What do Tesla and SpaceX add now?
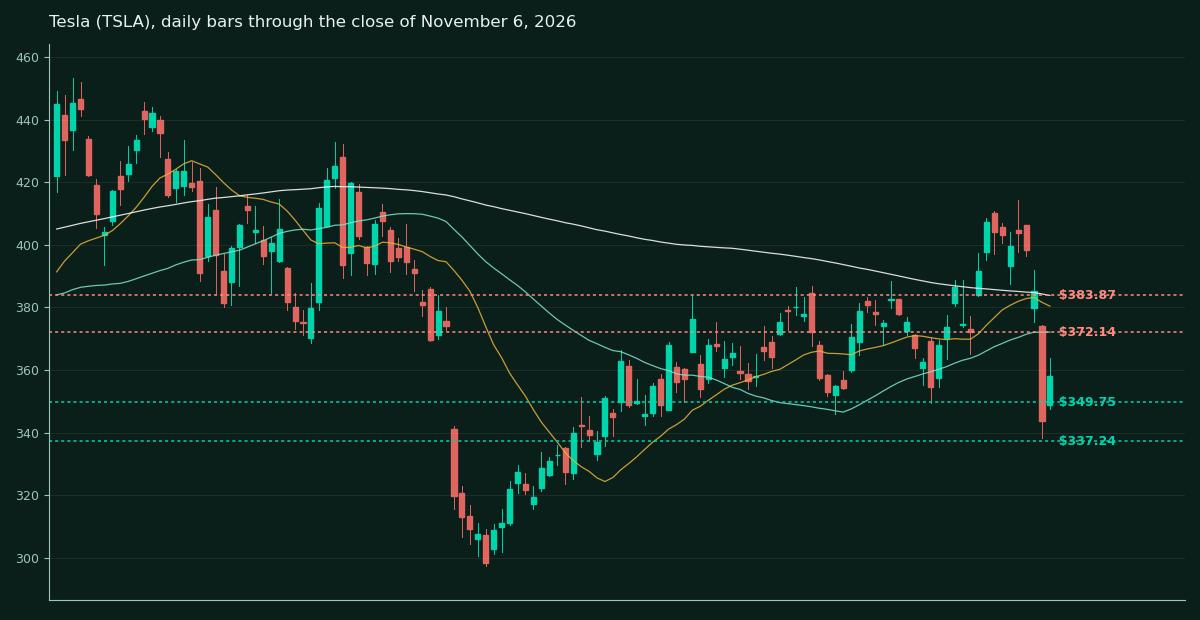
Tesla (TSLA). Bias: uptrend broken.
The tape. Close $358.22. Day +4.23%. Week -11.18%. RSI 42.4. ATR $16.71. 20 DMA $380.42. 50 DMA $372.14. 200 DMA $383.87. From the 52-week high -28.2%.
The levels. Support at $349.75, $337.24. Resistance at $372.14, $383.87. Downside target $337.24. Bounce target $383.87.
The first map's Tesla question was stamina at the $400 shelf, with the uptrend intact and the after-hours dip to $395.77 flagged as the first test. The shelf answered. Tesla held $400 for three sessions, even printing $414.23 intraday on Monday, then broke with the complex on Thursday, closing through $393.63, the $381.63 downside target, and the 200-day average in one move, to a low of $338.15. Friday's 4.23% bounce left it below every major average. The chart that did not belong to the selloff a week ago belongs to it now.
Support is the October shelf at $349.75, three touches, then the cluster at $337.24 beside the week's low, which is the downside target. Resistance is the 50-day average at $372.14, then the 200-day average at $383.87, the bounce target. A reclaim of $383.87 would restore the uptrend frame. Until then Tesla trades as a broken chart with a strong bounce reflex, and the $400 shelf is supply, not support.
SpaceX (SPCX). Bias: base stress-tested.
The tape. Close $134.27. Day +8.62%. Week -6.69%. RSI 42.5. ATR $8.30. 20 DMA $145.24. 50 DMA $149.18. 200 DMA not yet available. From the 52-week high -40.5%.
The levels. Support at $130.39, $120.39, $104.83. Resistance at $135.00, $149.68. Downside target $120.39. Bounce target $149.68.
SpaceX took the full stress test and passed it on points. The rout carried the stock through its $143.04 and $140.66 supports, reached the $130.39 downside target, closed below it on Thursday at $123.62, and printed $120.39 at the low. Friday's 8.62% rebound, the second largest in the map, reclaimed $130.39 and closed at $134.27, a dollar under the $135.00 IPO price. For a five-month-old listing with a beta near 5, that sequence is what a base surviving looks like. It is not what a base confirmed looks like. The stock still sits below its 20-day and 50-day averages, and the IPO price overhead is now the first supply line in the name.
Support is $130.39, reclaimed and now required to hold, then the week's low at $120.39, the downside target, then the August low at $104.83. Resistance is the IPO price at $135.00, then the 50-day zone at $149.68, the bounce target. A close above $135.00 turns the IPO line back into a floor. A close below $120.39 says the base failed its second test, and there is no third line until $104.83.
What do the crowd's names say now?
Three names join the map this week. They are not the hyperscalers' league, and they are where a large part of this site's readership holds its risk, so they get the same method, the same levels discipline, and from next week the same public grading.
BlackBerry (BB). Bias: range, above every average.
The tape. Close $8.74. Day +4.42%. Week -4.90%. RSI 50.7. ATR $0.59. 20 DMA $8.68. 50 DMA $8.47. 200 DMA $6.98. From the 52-week high -35.7%.
The levels. Support at $8.40, $7.99. Resistance at $9.22, $9.64. Downside target $7.99. Bounce target $9.64.
BlackBerry had the quietest week on this map, and quiet was the achievement. In a week when the semiconductor gauge fell 20%, BlackBerry fell 4.90%, tested $7.99 on Wednesday, and closed back above its 20-day and 50-day averages with an RSI of 50.7, dead neutral. Alongside Amazon, it is one of only two names on this map above all three of its major averages. The stock so many of this site's readers know best spent the rout doing nothing, and nothing was the strongest signal available.
The range is the story. Since September, $7.99 to $9.64 has contained every close, and both edges have been tested and held. Support is the October low shelf at $8.40, with the 50-day average at $8.47 on the same shelf, then the range floor at $7.99, which is the downside target on a closing break. Resistance is $9.22, then the range top at $9.64, the bounce target. A close above $9.64 ends the range argument and opens the conversation about the $13.59 high. A close below $7.99 says the base was a pause, not a floor.
Nebius (NBIS). Bias: oversold bounce in a downtrend.
The tape. Close $129.49. Day +7.58%. Week -24.71%. RSI 34.0. ATR $16.47. 20 DMA $165.23. 50 DMA $201.70. 200 DMA $178.38. From the 52-week high -56.8%.
The levels. Support at $113.30, $95.30. Resistance at $149.48, $167.43. Downside target $95.30. Bounce target $167.43.
Nebius took the rout at full beta. A 24.71% weekly fall carried it through every average it owns, to a Thursday low of $113.30, and Friday's 7.58% rebound was the covering reflex this map has seen all week, a bounce with no base under it yet. The stock now sits well below its 20-day average at $165.23 and 56.8% below its high. Nothing about the chart is repaired. It is only cheaper, which is a different claim.
Support is the week's low at $113.30. Below it, the next clustered shelf is $95.30, and that is the downside target. Resistance is the October low at $149.48, flipped to supply, then the shelf at $167.43 beside the 20-day average, which is the bounce target and the first repair line. Nebius carries the widest air pockets on this map in both directions, which is the technical form of its fundamental argument: the range of outcomes is the position.
Akamai (AKAM). Bias: post-earnings break, repair candidate.
The tape. Close $83.09. Day +6.74%. Week -16.39%. RSI 36.5. ATR $5.56. 20 DMA $91.68. 50 DMA $101.55. 200 DMA $112.34. From the 52-week high -49.8%.
The levels. Support at $77.37, then open air. Resistance at $86.16, $99.94. Downside target: open air below $77.37. Bounce target $99.94.
Akamai's earnings week broke its chart along with its multiple. The stock fell 16.39% on the week, printed a low of $77.37 on Thursday, and closed Friday at $83.09, still below every major average and 49.8% under its high. The fundamental argument, made in the Akamai and Cloudflare comparison, is that the selloff prices a broken story the numbers do not show. The chart makes no such argument either way. It shows a name that has to rebuild from its low, with its averages stacked overhead like a ceiling.
Support is the week's low at $77.37, and below it the map honestly says open air: there is no clustered shelf within the past year of trading. Resistance is the October low shelf at $86.16, then the pre-earnings shelf at $99.94 beside the 50-day average at $101.55, which is the bounce target. The first repair test is a close above $86.16 that holds. Until then, Akamai trades as a broken chart attached to an intact business, and the gap between those two sentences is the whole position.
What would confirm the turn now?
The first map set four tests. One passed, one failed, one split, and one flickered. Alphabet held its line and based. QQQ lost its 200-day average. Meta followed the basing template while the oversold bench refilled behind it. Microsoft broke its range low for one close, then made a new high, then gave the breakout back. The tests for the next two weeks are rebuilt from where the tape actually stands.
SPY holds its 200-day average. The index closed Friday at $735.29 with the average at $730.38 and one successful test behind it. A week of closes above that line keeps this a correction. A close below $724.95 says the selling has reached the index itself, and every single-name target in this map gets stress-tested again.
A first reclaim in the semis. Bottoms in a complex confirm name by name, in order of strength. Qualcomm at $169.69 and TSMC at $401.48 are each one good week from reclaiming their 200-day averages. Either print would be the first repair signal with a chart behind it. NVIDIA reclaiming $204.67 after its November 18 print would be the loudest version.
Higher lows on the retest. Friday's bounce will be retested. That is what bounces are for. Alphabet's week is the template. Names that hold above their Thursday lows while volume dries up are building floors. Names that slice through them are telling you the covering bid was the only bid.
The oversold bench emptying by basing, again. Seven lines sit at or below an RSI of 31.3, six stocks and the semiconductor gauge. The bench empties the way Meta emptied its reading this week, sideways and slowly, or it does not empty at all. A second week of vertical green candles would be a covering rally, not a turn, and this map will grade it as one.
The map in one paragraph. The capex crack became a correction. The index levels governed, the completed capitulations held, the unfinished ones fell through their targets and kept falling, and the week's only durable gains belong to the name that gapped into its marked support and the name that had already washed out. The new map is drawn lower, with the air pockets labeled instead of hidden, and with its repair lines set at the averages the broken names have to earn back. Fundamentals decide what these companies are worth. These lines decide where the argument happens.
The first map in this series is The Capex Crack: A Technical Map of the Hyperscalers and the Chip Complex, and the memory fundamentals underneath the Micron chart are mapped in The Memory Play.
Research and opinion, not investment advice. Do your own due diligence before investing.
Frequently asked questions
How did the October 30 technical targets perform?
Fourteen of the eighteen downside targets were reached within six sessions, and ten of the fourteen were overshot by at least another 10% before Friday's bounce. Three downside targets were never tested, in Microsoft, Alphabet, and Meta, and one, Amazon's $215.18, was struck after its support test passed and the stock rose 6.4% on the week. Of the bounce targets, Microsoft and Amazon were hit, Meta's was touched intraday without a close, and six were struck as their charts broke.
Which AI stocks are the most oversold on technicals now?
Intel, at a 14-day RSI of 25.7 after a 38.87% weekly fall, and Marvell, at 26.2 after a 35.33% fall. Alphabet follows at 29.9, then NVIDIA at 30.8, Arm at 31.1, and Micron at 31.3. Six names now sit at or below 31.3, against two formally oversold names a week ago. Oversold marks where selling has been extreme. This week proved it does not, by itself, mark where selling ends.
What price levels matter most in the week ahead?
Three. SPY closed Friday at $735.29, just above its 200-day average at $730.38, with the $724.95 cluster below it. QQQ needs to reclaim its 200-day average at $680.89 to move the correction back inside an uptrend, and holds only $647.05 before a long gap down to $599.49. NVIDIA reports on November 18 below its own 200-day average at $204.67, with support at $181.46 and $170.30 underneath.
Was Friday's rebound the bottom?
It has not confirmed as one yet. Friday's leaders were the most oversold names in the complex, AMD up 11.04% and Intel up 7.71%, on heavy volume, which is the signature of short covering at a tradable low. Confirmation requires what Alphabet did this week. Higher lows on the retest, volume drying up on down days, and the strongest names reclaiming their 200-day averages, with Qualcomm at $169.69 and TSMC at $401.48 the closest candidates. Until those prints arrive, Friday is a bounce inside a correction.
Are these price targets fundamental valuations?
No. Every target in this piece is a technical level, the next marked support below the price or the first marked resistance above it, measured on daily bars through the close of November 6, 2026. They describe where buying and selling interest has historically appeared. They are not valuations and they are not recommendations.
The Weekly Technical Map, in your inbox every Sunday
This map is now a weekly newsletter. Every Sunday evening, The Weekly Technical Map lands by email with the summary, the three gauges and the full table, last week's lines graded in the open and the new map drawn from Friday's close. The full charts always live here. Subscribe free in the newsletter section, and follow the week's levels as they get tested, live, on X at @pdamodaran.
Disclosures
Not financial advice. This article is published for educational purposes only. Nothing here is a recommendation to buy, sell, or hold any security, and nothing here is financial advice. Technical levels are observations about past prices, not predictions. Investing involves risk, including the possible loss of principal.
Positions. The author holds long positions in Alphabet, Amazon, Meta Platforms, AMD, BlackBerry, Nebius, and Akamai. The author holds no position in Microsoft, Oracle, NVIDIA, Broadcom, Marvell, Micron, Intel, Arm Holdings, TSMC, Qualcomm, Tesla, Space Exploration Technologies, or the iShares Semiconductor ETF (SOXX).
Accuracy. Price data are daily exchange bars through the close of November 6, 2026, with extended-hours moves noted where earnings were released after that close. Indicators were computed from those bars. Errors can occur and facts change. Verify independently before acting on anything you read.
No advisory relationship. Reading this site does not create an advisor-client relationship of any kind. See the full disclosures page.