What is the market actually punishing?
Not AI. Capex without visible cash return. In the space of two sessions the market rewarded Microsoft for growing Azure 48% on comparatively disciplined spend and cut Alphabet by 12.64% in a day for spending $51.4B in a quarter and printing negative free cash flow for a second straight quarter. Meta had already taken its punishment a week earlier. Amazon took its turn after Thursday's close. The pattern has a name now, and it is the working assumption behind every chart in this piece. High-capex names stay under pressure until the cash flow line turns.
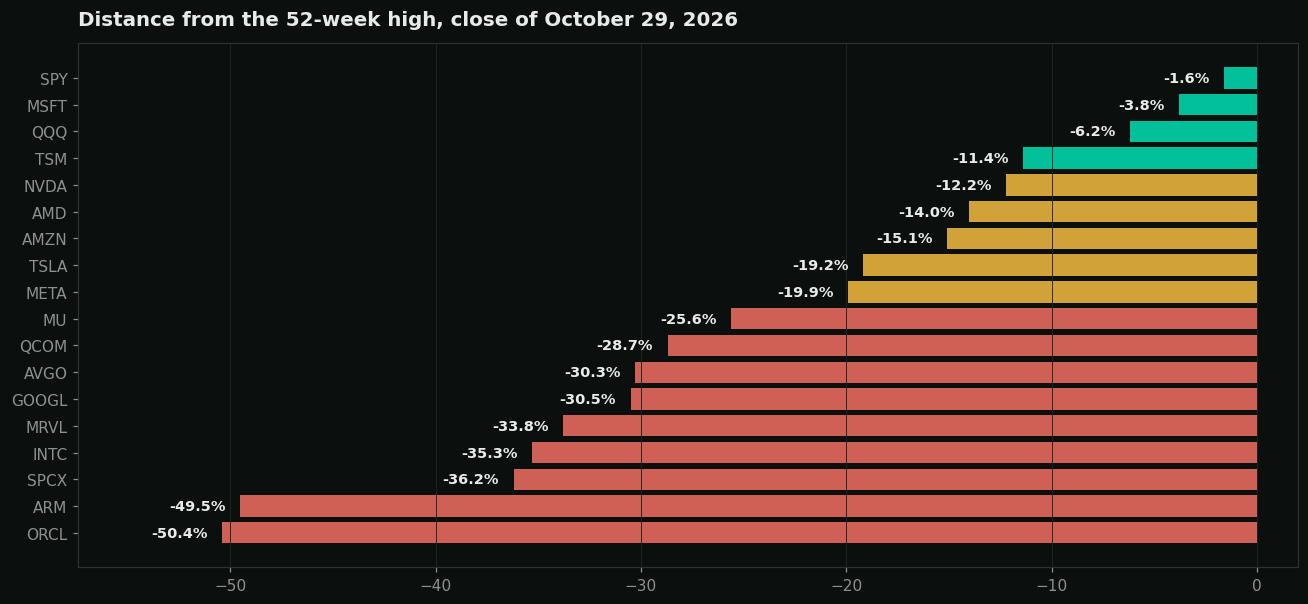
The index hides it. SPY closed Thursday 1.6% below its high and 373 of its 500 stocks rose on the day. Underneath, the AI complex is in a genuine drawdown. Eleven of the sixteen names mapped here closed at least 19% below their 52-week highs, and two of them, Oracle and Arm, are down by about half. This article is the technical map of that drawdown. Every level is drawn from daily bars through the close of Thursday, October 29, 2026. Every target is a level on a chart, not a view on a business.
How were these levels built?
Each chart shows six months of daily bars with the 20-day, 50-day, and 200-day moving averages. Support and resistance are clustered swing highs and swing lows from the past year of trading, merged with any moving average that sits on the same shelf. RSI is the standard 14-day reading, where under 30 is oversold and over 70 is overbought. ATR is the 14-day average true range, included because it sizes how violent a normal day in each name has become.
Targets follow one rule. The downside target is the next meaningful support in the direction of the short-term trend, and the bounce target is the first meaningful resistance overhead. Short term here means the next two to six weeks. Two names, Amazon and Intel, reported after Thursday's close and gapped in extended hours. Their sections say plainly where the regular-session map was overtaken and which older levels take over.
Two additions round out the map. Tesla is not a hyperscaler, but no technical read of this market is complete without the largest name in the Musk complex. SpaceX listed in June 2026, so it has no 200-day average yet, and its levels are drawn from its full trading history since listing. Both names also moved after the close, and both moves were down.
The after-hours check. Every name that repriced after Thursday's close pointed the same way. Amazon traded to about $225.85 and landed on its $225.55 support cluster. Intel traded into the mid-70s, below every marked support on its chart. Tesla traded to $395.77, down 1.87%, back under $400. SpaceX traded to $141.35, down 1.77%, through its first support. Extended-hours trade is thin and Friday's closes are the verdict, but the direction of the first verdict is not in doubt.
Where does every name stand on one page?
| Name | Close | RSI | From high | Support 1 | Support 2 | Resistance 1 | Downside target | Bounce target | Bias |
|---|---|---|---|---|---|---|---|---|---|
| MSFT | $530.14 | 46.3 | -3.8% | $517.75 | $488.15 | $530.76 | $488.15 | $551.15 | Constructive range |
| GOOGL | $283.82 | 15.6 | -30.5% | $278.50 | $272.11 | $314.90 | $267.67 | $314.90 | Capitulation |
| AMZN | $243.79 | 34.1 | -15.1% | $243.38 | $233.59 | $249.61 | $215.18 | $243.38 | On the 200-day line |
| META | $624.52 | 27.8 | -19.9% | $594.81 | $577.07 | $630.19 | $556.56 | $642.70 | Oversold base attempt |
| ORCL | $139.56 | 48.6 | -50.4% | $137.99 | $134.99 | $142.03 | $122.76 | $157.28 | Broken but basing |
| NVDA | $213.66 | 34.7 | -12.2% | $207.88 | $198.66 | $214.19 | $204.28 | $222.37 | Range drifting down |
| AMD | $566.42 | 42.0 | -14.0% | $547.58 | $498.70 | $578.61 | $498.70 | $639.00 | Uptrend cooling |
| AVGO | $345.00 | 41.8 | -30.3% | $342.81 | $335.81 | $347.15 | $320.23 | $353.57 | Slow-bleed downtrend |
| MRVL | $218.34 | 31.4 | -33.8% | $212.37 | $200.62 | $222.67 | $182.62 | $242.79 | News breakdown |
| MU | $934.27 | 39.9 | -25.6% | $918.88 | $893.96 | $960.12 | $853.87 | $985.23 | Momentum cooling |
| INTC | $92.07 | 35.2 | -35.3% | $89.59 | $85.57 | $93.70 | $68.50 | $81.79 | Post-print gap down |
| ARM | $228.77 | 33.6 | -49.5% | $226.94 | $219.39 | $249.04 | $208.30 | $249.04 | Downtrend at the line |
| TSM | $431.81 | 40.7 | -11.4% | $419.19 | $406.88 | $440.29 | $406.88 | $477.89 | Orderly pullback |
| QCOM | $185.41 | 60.8 | -28.7% | $177.20 | $170.40 | $196.09 | $170.40 | $205.85 | Breakout holding |
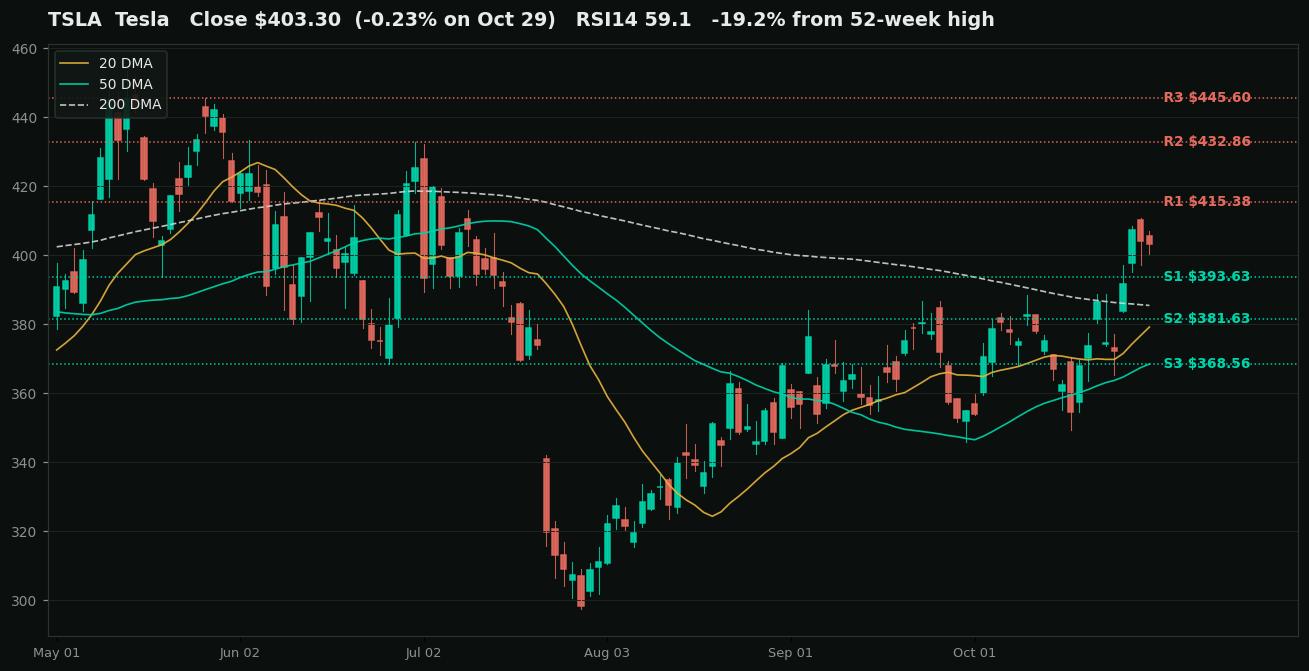
| TSLA | $403.30 | 59.1 | -19.2% | $393.63 | $381.63 | $415.38 | $381.63 | $432.86 | Uptrend stalling at $400 |
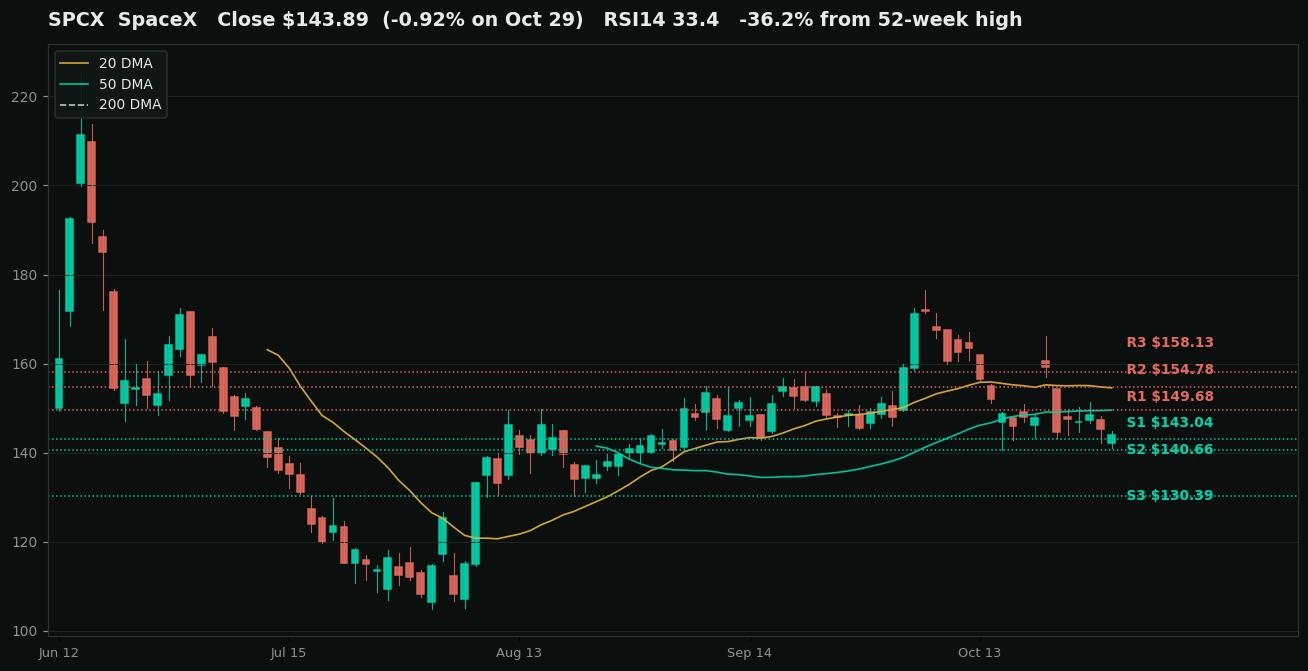
| SPCX | $143.89 | 33.4 | -36.2% | $143.04 | $140.66 | $149.68 | $130.39 | $149.68 | Young listing in a downtrend |
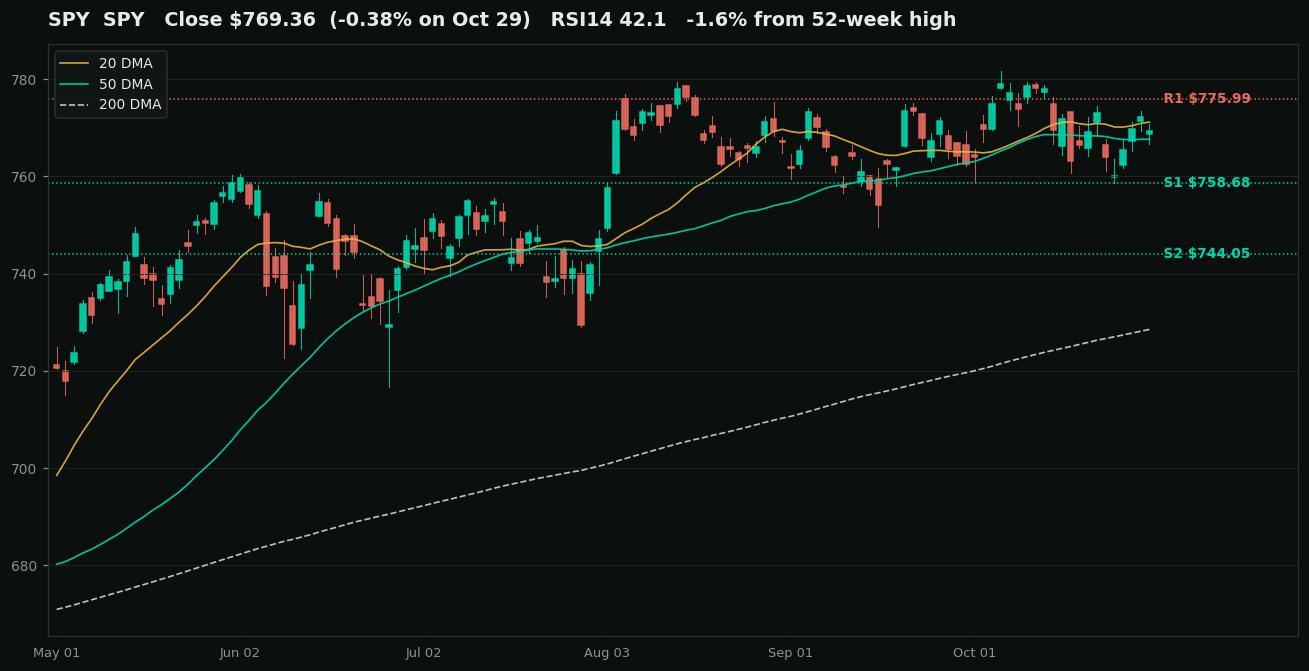
| SPY | $769.36 | 42.1 | -1.6% | $758.68 | $744.05 | $775.99 | $744.05 | $781.62 | Intact |
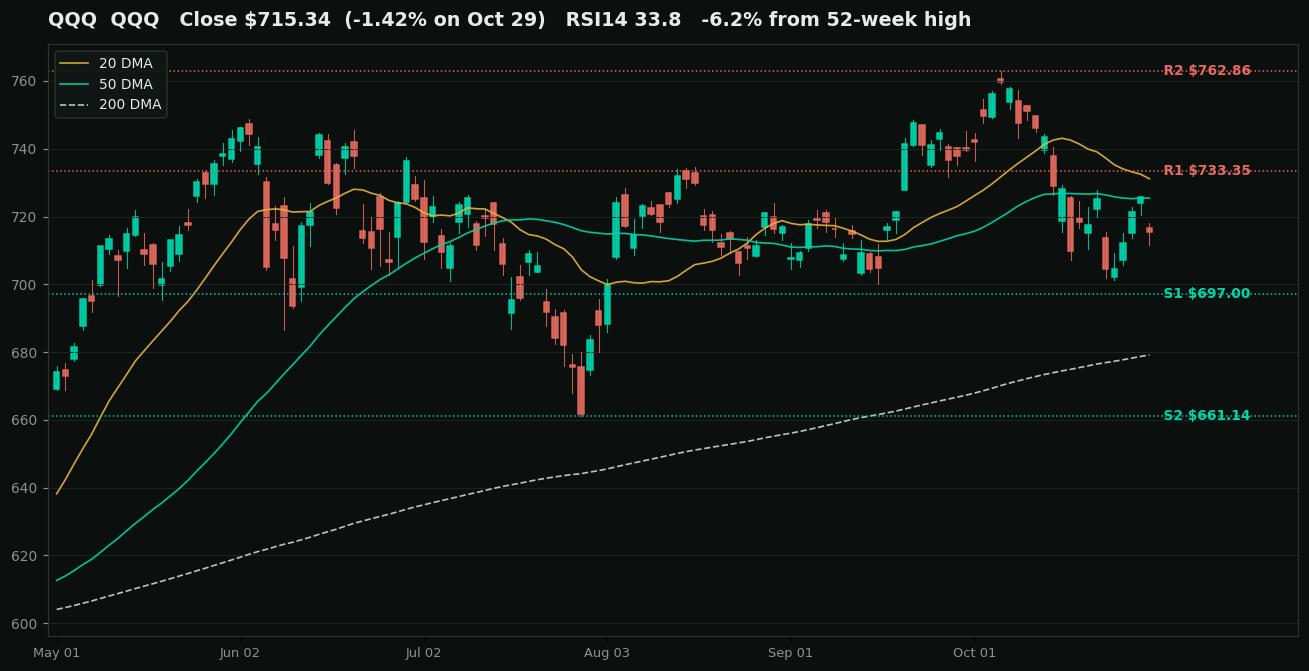
| QQQ | $715.34 | 33.8 | -6.2% | $697.00 | $661.14 | $733.35 | $679.16 | $725.41 | Short-term downtrend |
Read the RSI column as the temperature gauge. Only two names are formally oversold. Read the from-high column as the damage report. The two columns disagree in interesting places, and Broadcom is the clearest. It is 30.3% below its high with an RSI of only 41.8, which means it got there slowly. Slow drawdowns repair slowly.
What do the hyperscaler charts say?
Microsoft (MSFT). Bias: constructive range.
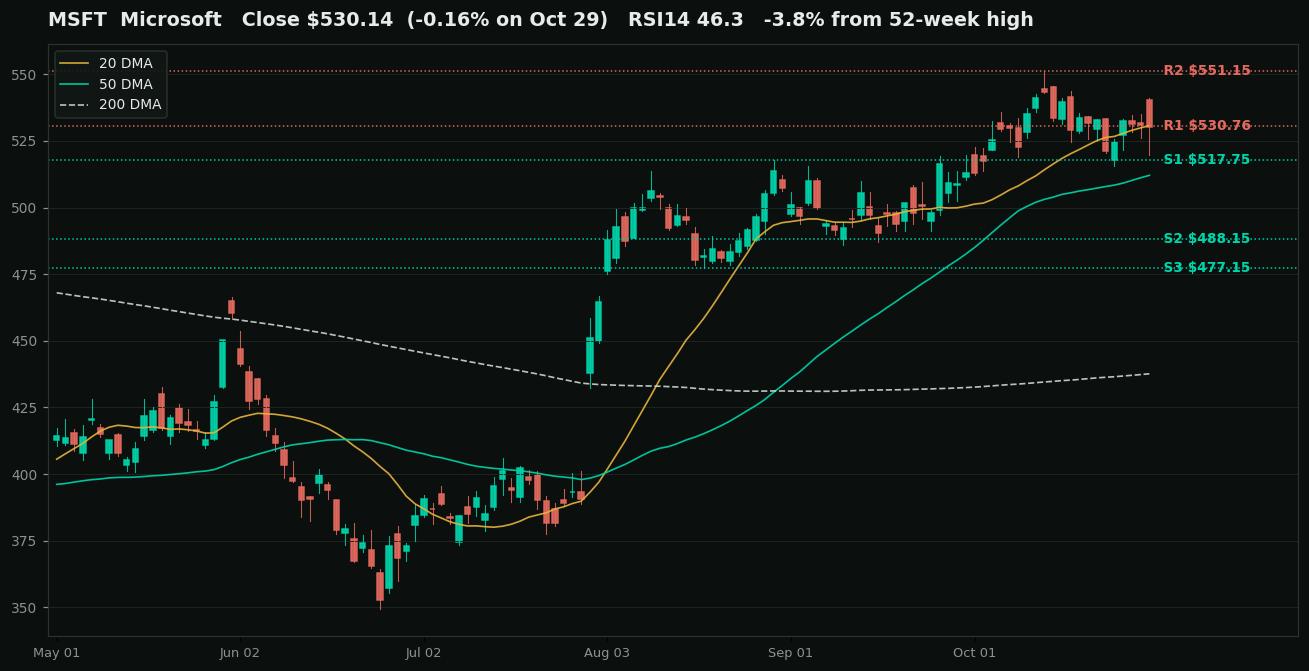
The tape. Close $530.14. Day -0.16%. RSI 46.3. ATR $11.16. 20 DMA $530.76. 50 DMA $512.10. 200 DMA $437.61. From the 52-week high -3.8%.
The levels. Support at $517.75, $488.15, $477.15. Resistance at $530.76, $551.15. Downside target $488.15. Bounce target $551.15.
Microsoft is the only hyperscaler the tape still trusts. The stock closed Thursday at $530.14, down 0.16% on the heaviest AI news day of the quarter, and it sits within a point of its 20-day average with the 50-day average at $512.10 below it. The market paid for the Azure print and moved on.
The structure is a range, not a trend break. Support steps down from $517.75 to $488.15 and $477.15. Resistance is the 52-week high at $551.15 and little else. A daily close below $517.75 opens the measured slide toward $488.15. A close above $551.15 is a breakout with no overhead supply, and it is the only hyperscaler chart where that sentence can be written.
Alphabet (GOOGL). Bias: capitulation.
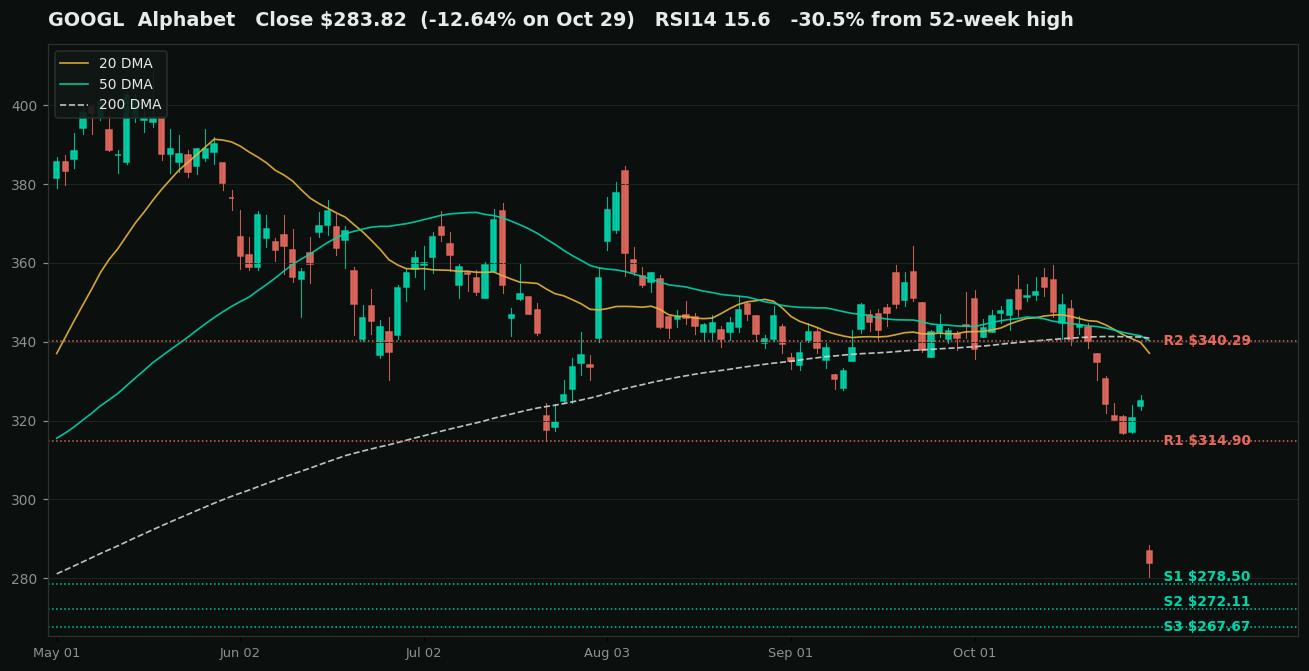
The tape. Close $283.82. Day -12.64%. RSI 15.6. ATR $10.78. 20 DMA $337.09. 50 DMA $340.29. 200 DMA $340.94. From the 52-week high -30.5%.
The levels. Support at $278.50, $272.11, $267.67. Resistance at $314.90, $340.29. Downside target $267.67. Bounce target $314.90.
Alphabet printed the capitulation candle of the season. The stock gapped down at the open and closed at $283.82, off 12.64% on the day on volume 4.5 times its average. RSI at 15.6 is the lowest reading in this entire complex. Readings that deep have historically marked exhaustion zones rather than entry signals on their own, because the trend underneath is now broken beyond argument. Price sits below the 20-day, 50-day, and 200-day averages, and all three are stacked together between $337 and $341.
The fall left an air pocket. Between Thursday's high of $288.33 and the first real resistance at $314.90 there is almost no traded history, which is why gap fills in this name tend to travel fast in both directions. Support is rebuilt from older trading ranges. The first shelf is $278.50, then $272.11, then the 52-week low at $267.67. Those levels land inside the staged accumulation zones this site published on October 28, drawn from the same older ranges. A close below $278.50 targets $267.67. A recovery that reclaims $314.90 would fill most of the gap and change the conversation.
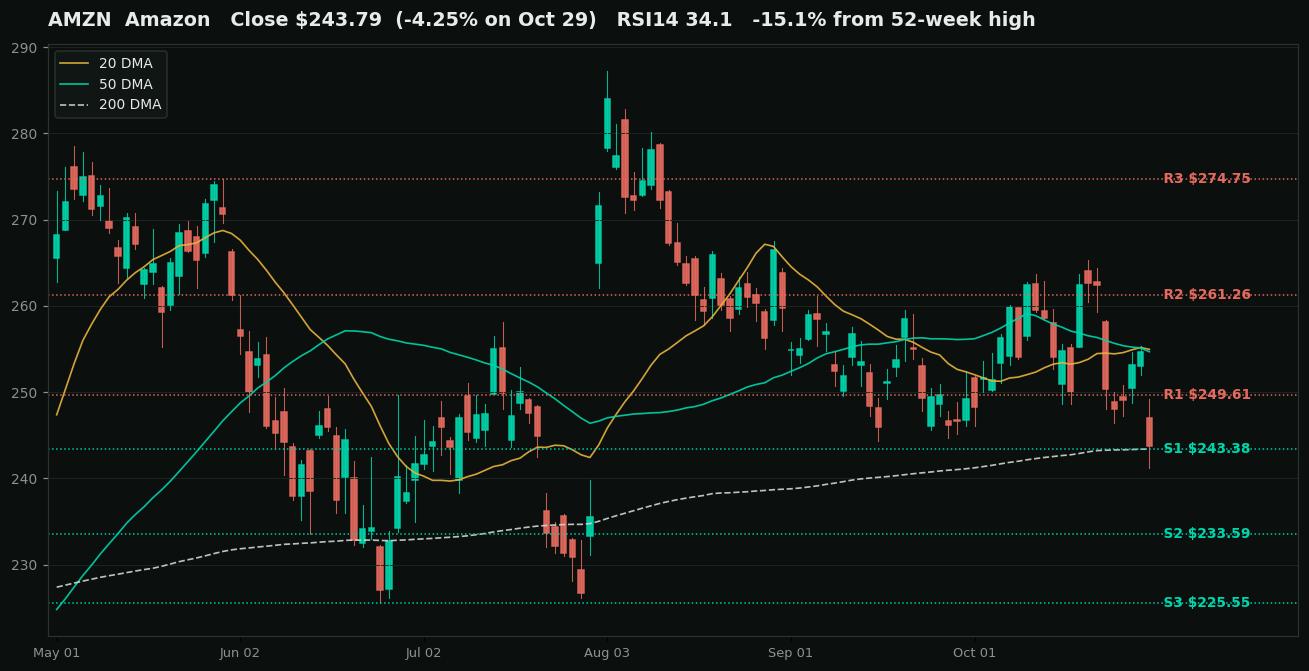
Amazon (AMZN). Bias: on the 200-day line.
The tape. Close $243.79. Day -4.25%. RSI 34.1. ATR $7.00. 20 DMA $254.95. 50 DMA $254.67. 200 DMA $243.38. From the 52-week high -15.1%.
The levels. Support at $243.38, $233.59, $225.55. Resistance at $249.61, $261.26, $274.75. Downside target $215.18. Bounce target $243.38.
Amazon closed Thursday within cents of the most watched line in this entire map. The close was $243.79 and the 200-day average is $243.38. Above it sit the 20-day and 50-day averages stacked near $255. RSI is 34.1, close to oversold without reaching it. The regular session was orderly. The after-hours session was not.
Amazon reported after the close and the stock traded down to about $225.85 in extended hours. That price is not random. It lands directly on the third support cluster at $225.55, built from swing lows in December 2025, January 2026, and the summer of 2026. If $225.55 fails on a closing basis, the next swing shelf is $215.18. A hold at $225.55 with a recovery through $233.59 would mark the post-earnings low as the support test the map called for. The full earnings scorecard runs in the Weekly Close.
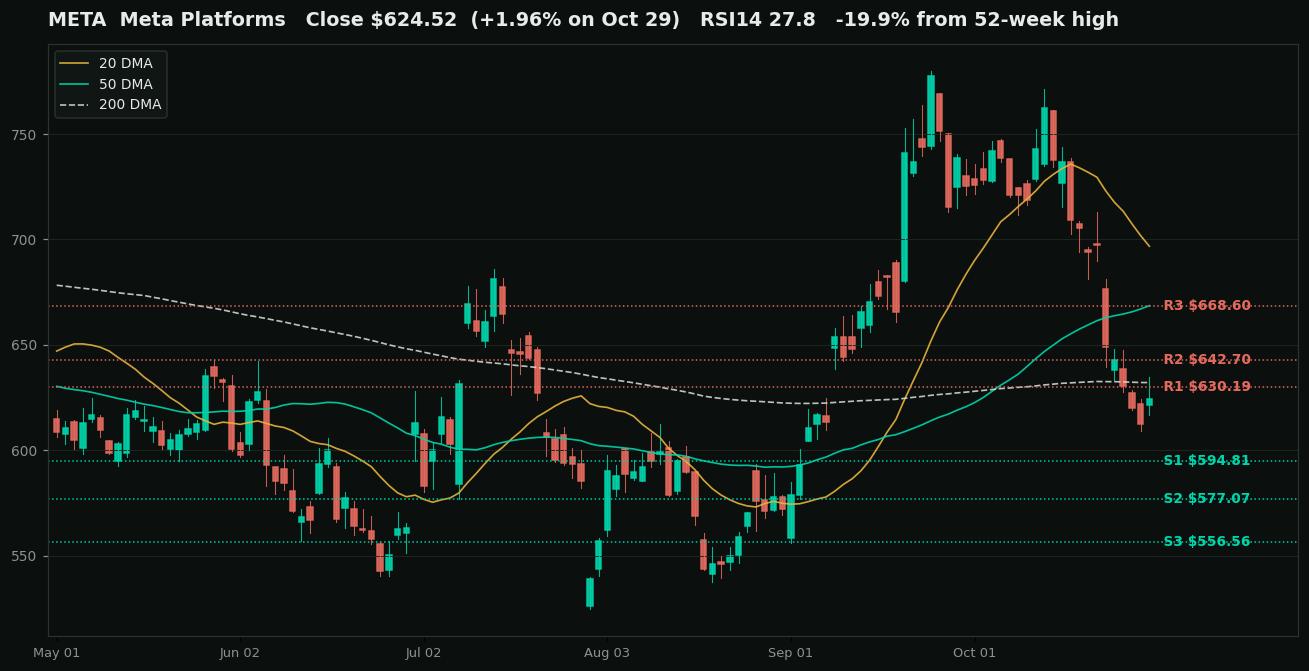
Meta Platforms (META). Bias: oversold base attempt.
The tape. Close $624.52. Day +1.96%. RSI 27.8. ATR $26.29. 20 DMA $696.76. 50 DMA $668.60. 200 DMA $632.11. From the 52-week high -19.9%.
The levels. Support at $594.81, $577.07, $556.56. Resistance at $630.19, $642.70, $668.60. Downside target $556.56. Bounce target $642.70.
Meta is the oversold name that stopped falling first. The stock closed at $624.52, up 1.96% on a day when Alphabet lost 12.64% and Amazon lost 4.25%. That relative strength matters. RSI is 27.8, the second lowest in the complex, and price closed just under the 200-day average at $632.11 after dipping below it during the week.
The map below is a falling staircase with landings. Support sits at $594.81, then $577.07, then $556.56. Resistance starts at the 200-day zone between $630.19 and $632.11, then $642.70, then the 50-day average at $668.60. Losing $594.81 on a close targets the $556.56 shelf. Reclaiming $642.70 would complete a base and argue the capex punishment in this name is done.
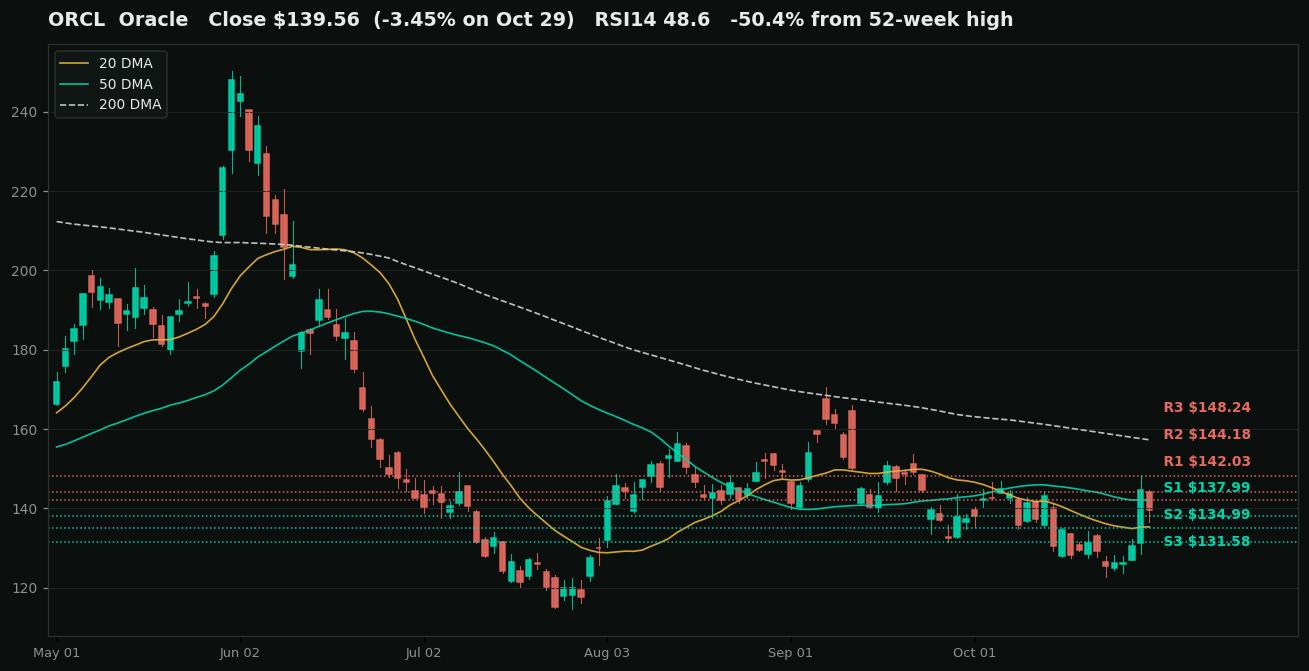
Oracle (ORCL). Bias: broken but basing.
The tape. Close $139.56. Day -3.45%. RSI 48.6. ATR $7.65. 20 DMA $135.31. 50 DMA $142.03. 200 DMA $157.28. From the 52-week high -50.4%.
The levels. Support at $137.99, $134.99, $131.58. Resistance at $142.03, $144.18, $148.24. Downside target $122.76. Bounce target $157.28.
Oracle is the deepest drawdown in the complex at 50.4% below its high, and it is also the chart doing the most repair work. Price has climbed off the October 22 low at $122.76 and reclaimed the 20-day average at $135.31. The 50-day average at $142.03 and the 200-day average at $157.28 still cap the recovery. RSI at 48.6 is neutral, the only hyperscaler besides Microsoft that can say that.
Support steps down from $137.99 to $134.99 and $131.58. A close below $131.58 reopens the $122.76 low. On the upside the targets are $148.24 first and the 200-day average at $157.28 second. Oracle shows what the other broken names have to do. It is weeks ahead of them on the same road, and the road is measured in reclaimed averages, not in single green days.
What do the semiconductor charts say?
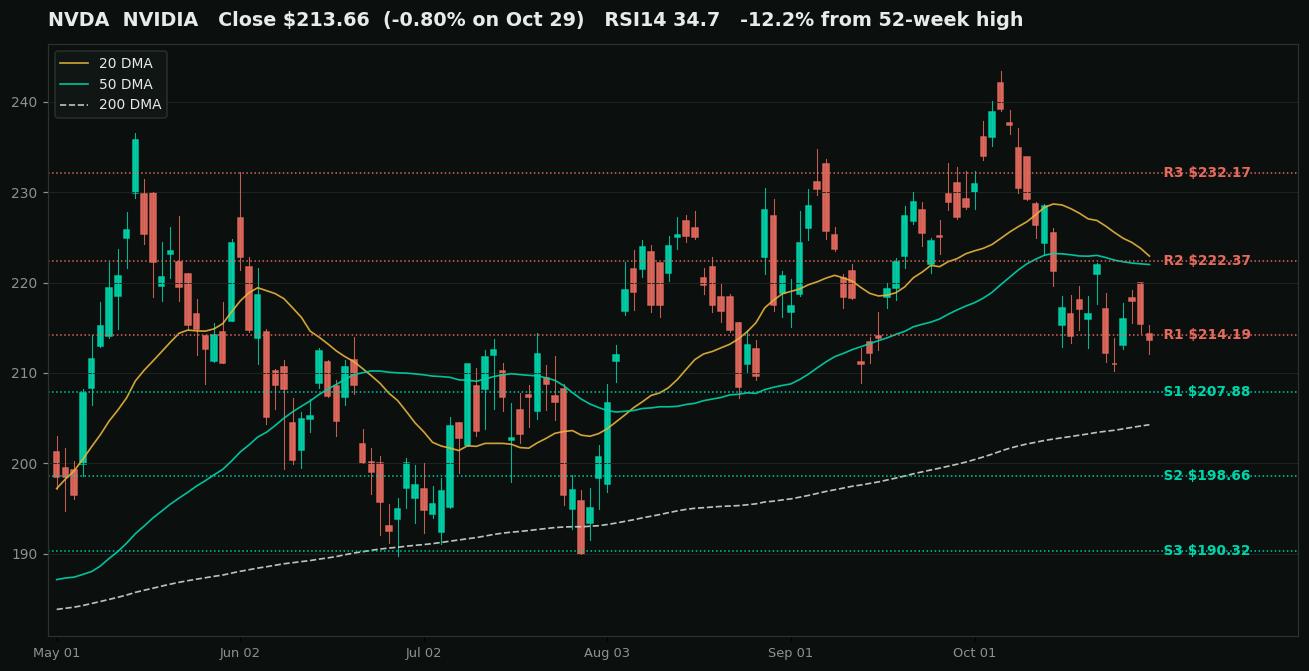
NVIDIA (NVDA). Bias: range drifting down.
The tape. Close $213.66. Day -0.80%. RSI 34.7. ATR $5.94. 20 DMA $222.93. 50 DMA $221.99. 200 DMA $204.28. From the 52-week high -12.2%.
The levels. Support at $207.88, $198.66, $190.32. Resistance at $214.19, $222.37, $232.17. Downside target $204.28. Bounce target $222.37.
NVIDIA is drifting, not breaking. The close at $213.66 sits below the 20-day average at $222.93 and the 50-day average at $221.99, and above the 200-day average at $204.28. RSI is 34.7. The quiet detail is volume at 0.77 times average. Sellers are not pressing. The stock is leaking lower on light trade while the complex argues about capex.
Support is $207.88 first, then the 200-day zone, then $198.66 and $190.32. Resistance is $214.19, then the average stack at $222.37, then $232.17. The downside target is the $204 to $208 shelf where the 200-day average and the first support meet. A close back above $222.37 ends the drift. Until one of those prints, NVIDIA is a range with a downward slope, and its earnings later in November are the obvious catalyst that resolves it.
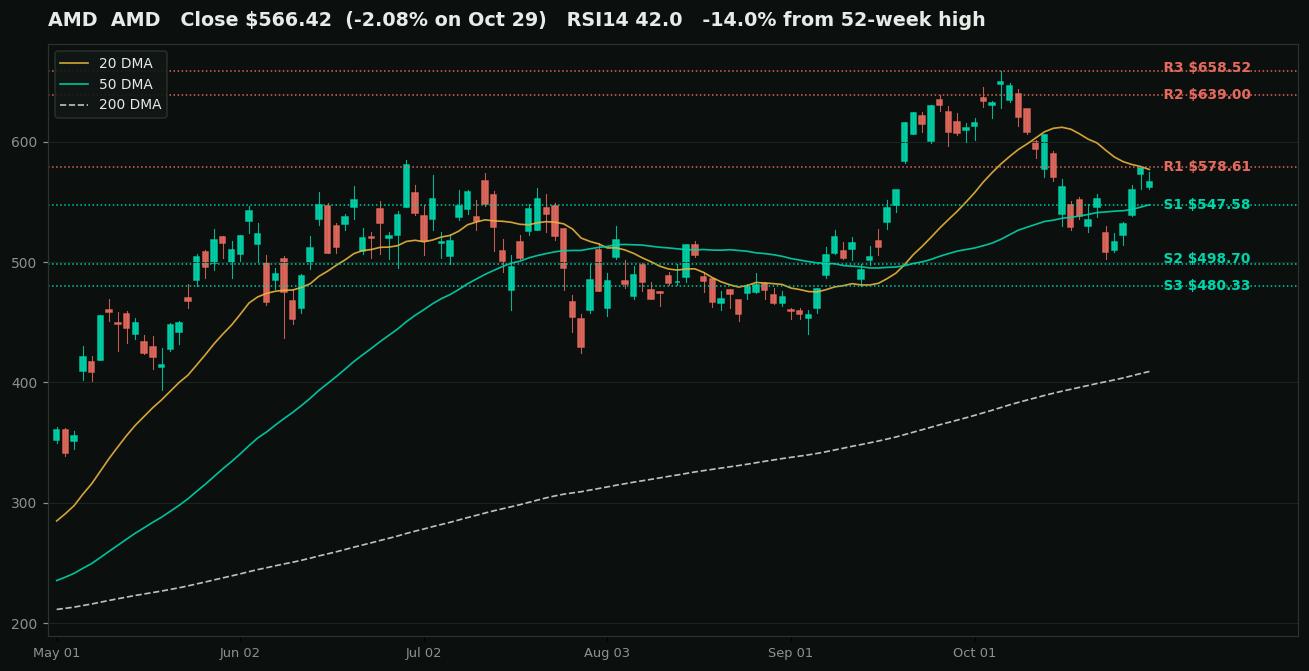
AMD (AMD). Bias: uptrend cooling.
The tape. Close $566.42. Day -2.08%. RSI 42.0. ATR $28.43. 20 DMA $576.90. 50 DMA $547.58. 200 DMA $409.08. From the 52-week high -14.0%.
The levels. Support at $547.58, $498.70, $480.33. Resistance at $578.61, $639.00, $658.52. Downside target $498.70. Bounce target $639.00.
AMD holds the healthiest semi structure after Qualcomm. The close at $566.42 sits above the 50-day average at $547.58 and far above the 200-day average at $409.08. The 14% slide from the $658.52 high has cooled RSI to 42.0 without breaking anything structural. One caution is printed on the tape strip. ATR is $28.43, so a normal day in this stock now moves about 5%.
Support is the 50-day average at $547.58, then a wide gap down to $498.70 and $480.33. That gap is the risk in the chart. If the 50-day fails there is little traded history until $498.70. Resistance is $578.61, then $639.00, then the high at $658.52. Holding the 50-day keeps the uptrend and the $639.00 target alive. Losing it targets $498.70.
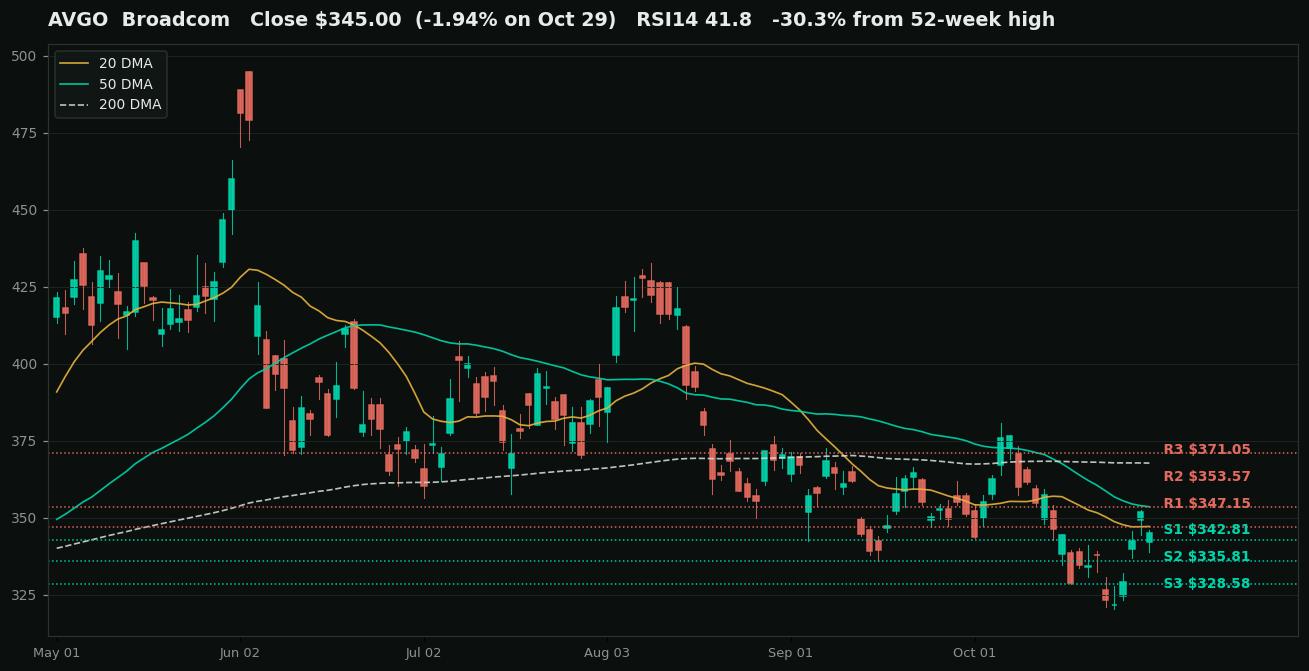
Broadcom (AVGO). Bias: slow-bleed downtrend.
The tape. Close $345.00. Day -1.94%. RSI 41.8. ATR $11.67. 20 DMA $347.15. 50 DMA $353.57. 200 DMA $367.74. From the 52-week high -30.3%.
The levels. Support at $342.81, $335.81, $328.58. Resistance at $347.15, $353.57, $371.05. Downside target $320.23. Bounce target $353.57.
Broadcom is the slow bleed. The stock is 30.3% below its high and RSI is only 41.8. That combination is the signature of a grind rather than a washout. There has been no capitulation candle and no volume climax, just a staircase down through every moving average. Price at $345.00 sits below the 20-day average at $347.15, the 50-day at $353.57, and the 200-day at $367.74.
Support steps down from $342.81 to $335.81 and $328.58, with the October low near $320.23 below that. Resistance is the average stack itself, $347.15 first and $353.57 second and $371.05 third. The downside target while the grind persists is the $320.23 low. A bounce target is only the 50-day average at $353.57 until the stock proves it can hold a reclaimed average for more than a day.
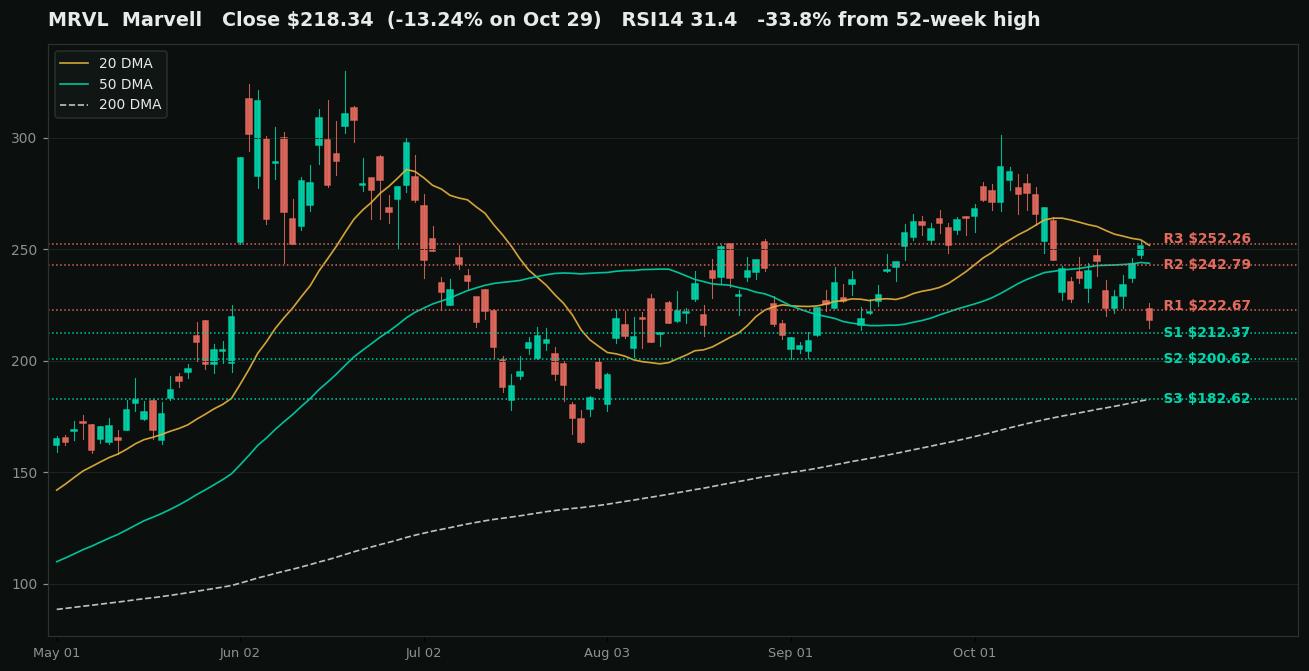
Marvell (MRVL). Bias: news breakdown.
The tape. Close $218.34. Day -13.24%. RSI 31.4. ATR $17.98. 20 DMA $251.79. 50 DMA $243.70. 200 DMA $182.62. From the 52-week high -33.8%.
The levels. Support at $212.37, $200.62, $182.62. Resistance at $222.67, $242.79, $252.26. Downside target $182.62. Bounce target $242.79.
Marvell broke on news. Reports of advanced talks to acquire Lumentum knocked 13.24% off the stock on Thursday, on volume 1.9 times average, and the gap carried price straight through the 50-day average at $243.70. RSI fell to 31.4. Deal fear does technical damage in a specific way. It converts willing holders into hedged holders, and the first support rarely holds on the first test.
Support is $212.37, then $200.62, then the 200-day average at $182.62. Resistance is the gap edge at $222.67, then $242.79 at the old 50-day zone. The downside target if $212.37 fails is $200.62, and a frightened tape can reach the 200-day average. The bounce target on any deal clarity is the gap edge at $222.67 first. Nothing about the chart argues for catching the first falling day.
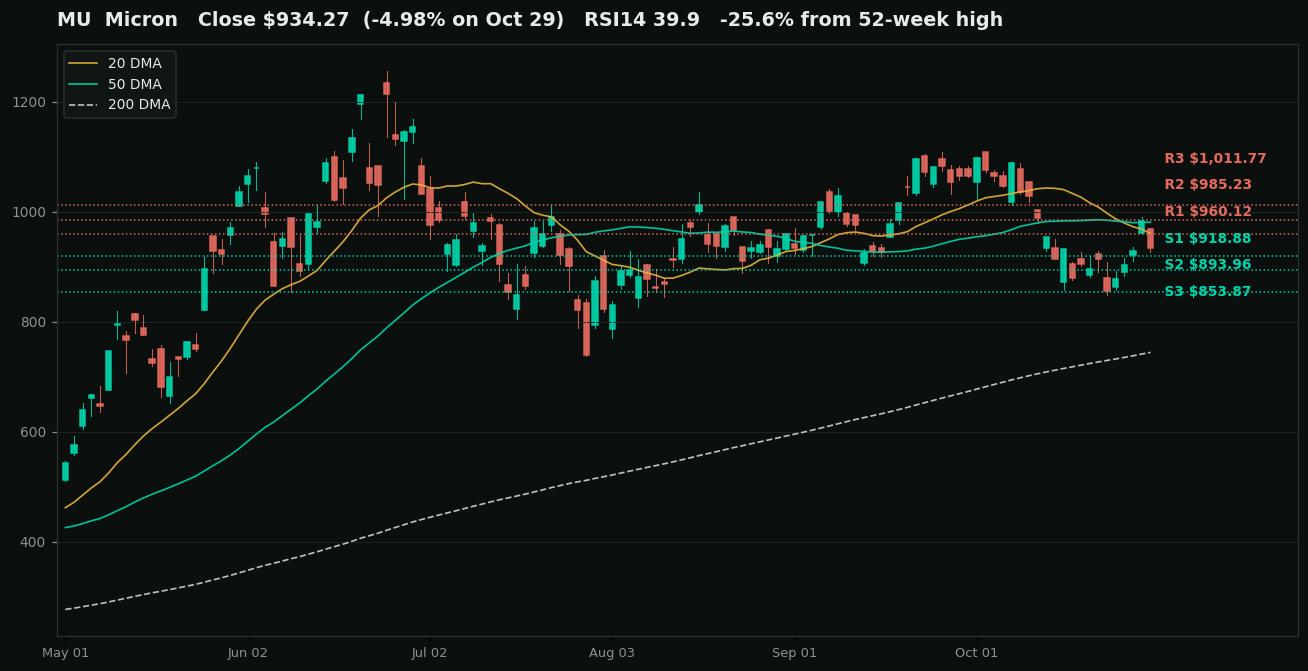
Micron (MU). Bias: momentum cooling.
The tape. Close $934.27. Day -4.98%. RSI 39.9. ATR $49.41. 20 DMA $960.12. 50 DMA $980.50. 200 DMA $744.07. From the 52-week high -25.6%.
The levels. Support at $918.88, $893.96, $853.87. Resistance at $960.12, $985.23, $1,011.77. Downside target $853.87. Bounce target $985.23.
Micron has the widest daily range in the complex and the chart demands respect for it. ATR is $49.41 on a $934.27 stock. Price sits below the 20-day average at $960.12 and the 50-day average at $980.50, and far above the 200-day average at $744.07. RSI is 39.9. The 25.6% drawdown from the $1255.00 high is a momentum unwind inside a still-intact long-term uptrend.
Support steps down from $918.88 to $893.96 and then the October shelf at $853.87. Resistance is $960.12, then $985.23, then $1011.77. The downside target is $853.87. The bounce target is the 50-day zone at $980.50 to $985.23. Position size in this name is a technical input, not a preference, because a two-ATR week moves the stock about $100 in either direction.
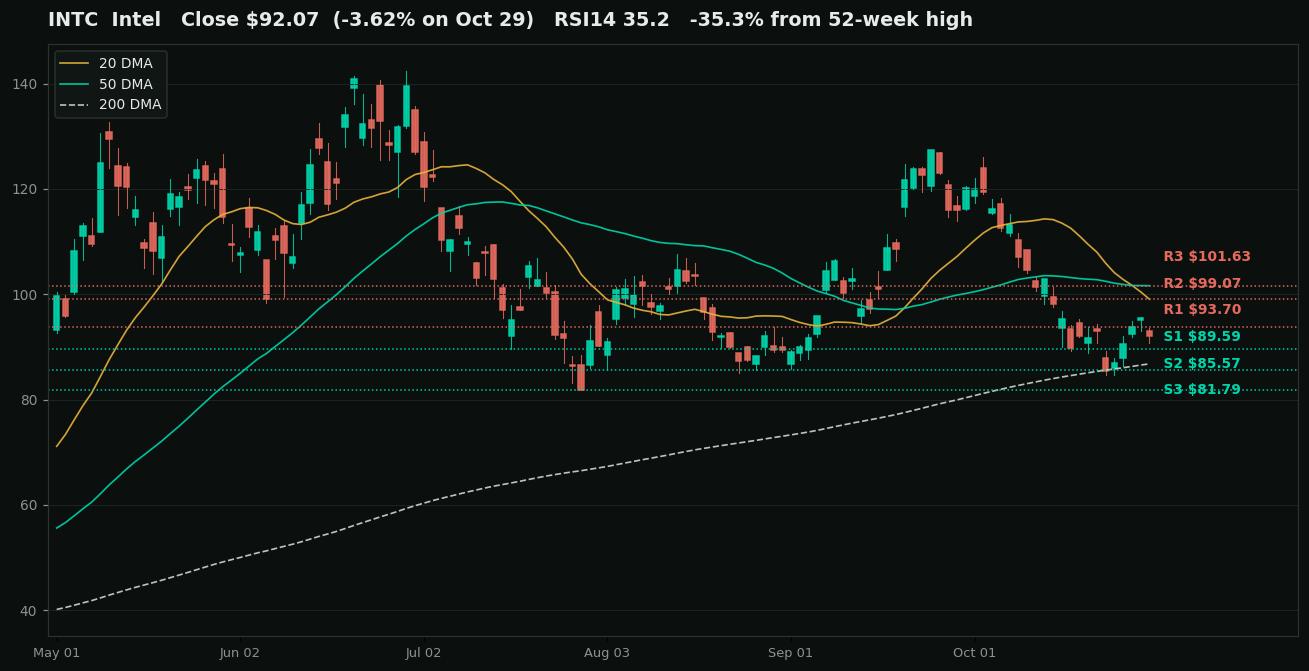
Intel (INTC). Bias: post-print gap down.
The tape. Close $92.07. Day -3.62%. RSI 35.2. ATR $5.08. 20 DMA $99.07. 50 DMA $101.63. 200 DMA $86.78. From the 52-week high -35.3%.
The levels. Support at $89.59, $85.57, $81.79. Resistance at $93.70, $99.07, $101.63. Downside target $68.50. Bounce target $81.79.
Intel closed the regular session at $92.07 with a damaged but standing chart. Price sat below the 20-day average at $99.07 and the 50-day average at $101.63, and above the 200-day average at $86.78. Then earnings landed after the close and the stock traded into the mid-70s in extended hours. Every marked support on the regular-session chart, $89.59 and $85.57 and $81.79, was jumped in a single gap. The displacement story behind the print is covered in the companion piece linked below.
Gap-down charts trade on older history. Below $81.79 there is almost no traded history until $68.50, where the stock closed twice in April 2026 on its way up. That makes the $68 to $70 zone the downside target zone and makes the air pocket itself the risk. Any recovery bounce meets its first supply at $81.79. Traders who need a line in this name should draw it at the after-hours low and judge Friday's close against it, because the old map is void below $81.79.
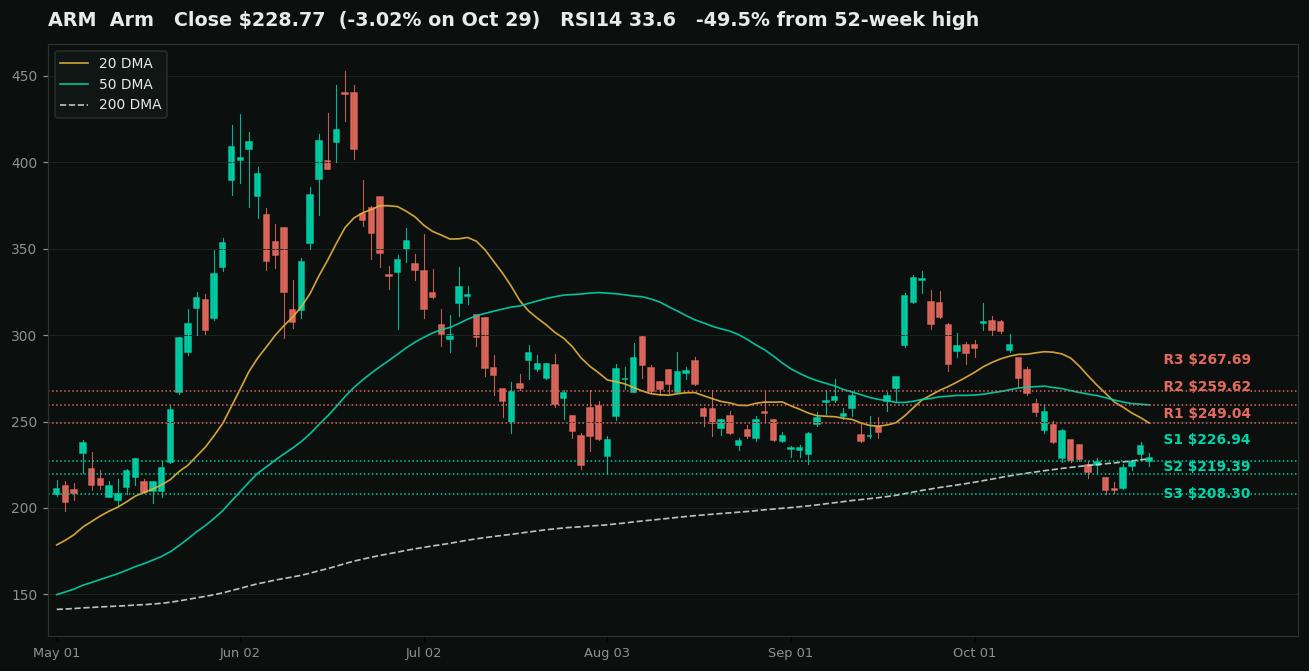
Arm (ARM). Bias: downtrend at the line.
The tape. Close $228.77. Day -3.02%. RSI 33.6. ATR $13.08. 20 DMA $249.04. 50 DMA $259.62. 200 DMA $228.42. From the 52-week high -49.5%.
The levels. Support at $226.94, $219.39, $208.30. Resistance at $249.04, $259.62, $267.69. Downside target $208.30. Bounce target $249.04.
Arm sits exactly on its line. The close at $228.77 is within cents of the 200-day average at $228.42. The stock is 49.5% below its high, second worst in the complex, and RSI at 33.6 is approaching oversold. The 20-day average at $249.04 and the 50-day average at $259.62 are far overhead, which tells you how fast this name fell.
Support is $226.94, then $219.39, then the October low at $208.30. Resistance is $249.04 first and $259.62 second. A weekly close below the 200-day average targets $208.30. A bounce that reclaims $249.04 would be the first repair step. Arm is also the purest listed expression of the displacement trade, which cuts both ways. The thesis is winning share and the stock is halved. That gap between story and tape is the whole position question in one chart.
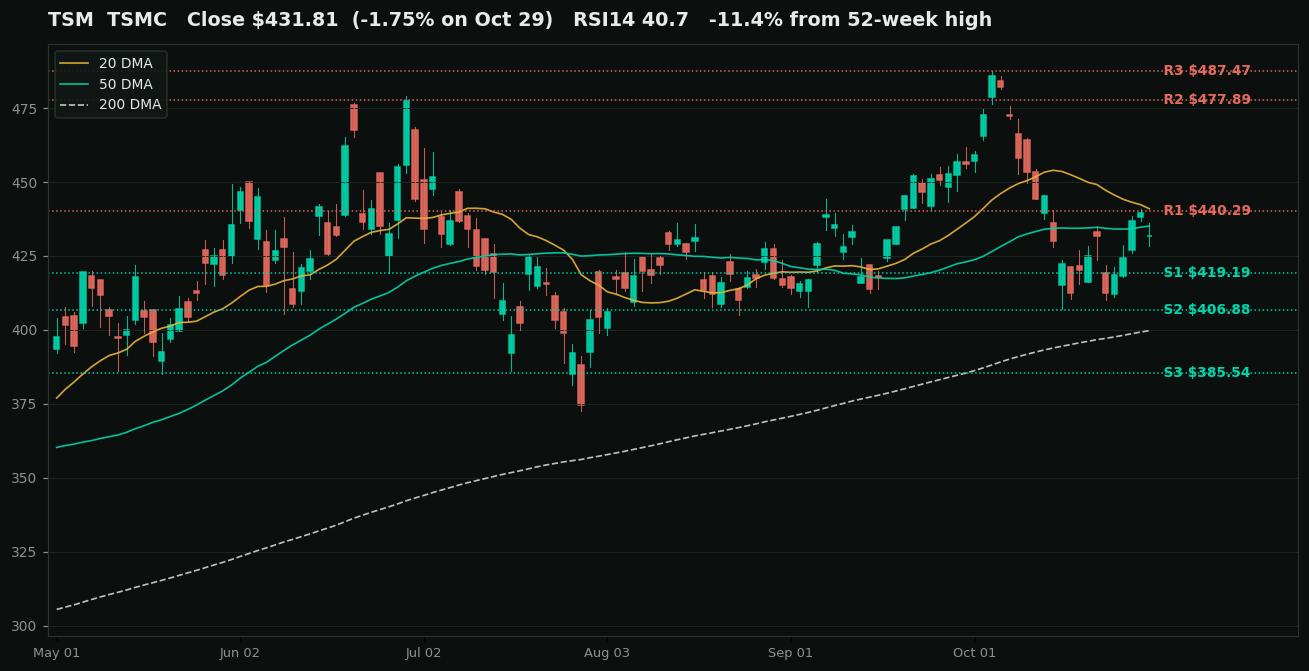
TSMC (TSM). Bias: orderly pullback.
The tape. Close $431.81. Day -1.75%. RSI 40.7. ATR $12.87. 20 DMA $440.97. 50 DMA $435.12. 200 DMA $399.77. From the 52-week high -11.4%.
The levels. Support at $419.19, $406.88, $385.54. Resistance at $440.29, $477.89, $487.47. Downside target $406.88. Bounce target $477.89.
TSMC is the orderly pullback. The close at $431.81 sits just under the 20-day average at $440.97 and just under the 50-day average at $435.12, with the 200-day average at $399.77 well below. At 11.4% below its high it carries the shallowest drawdown of any semi in this map. RSI is 40.7. Nothing here is broken. The stock is resting after a long run.
Support steps down from $419.19 to $406.88 and $385.54. Resistance is $440.29, then $477.89, then the $487.47 high. The downside target on a complex-wide washout is $406.88, where the recent swing lows cluster. The bounce target is $440.29 first and $477.89 second. When the foundry that makes every chip in this article has the calmest chart in the article, the selloff is about valuation and capex digestion, not about demand.
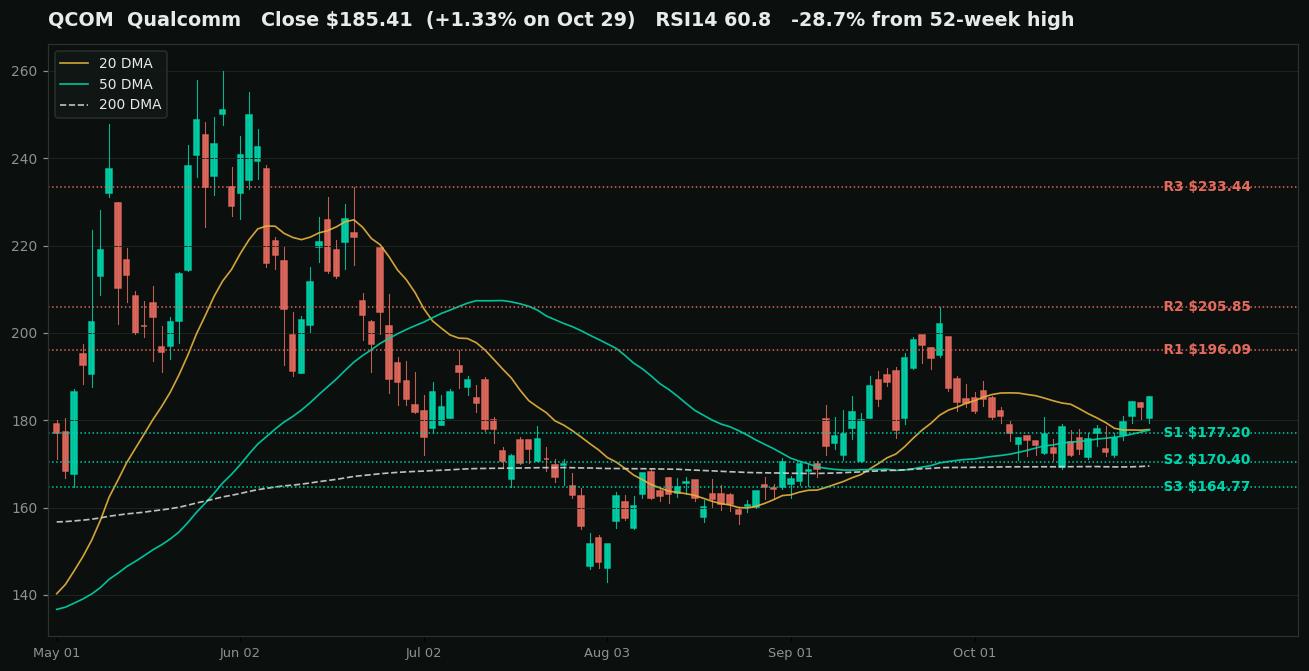
Qualcomm (QCOM). Bias: breakout holding.
The tape. Close $185.41. Day +1.33%. RSI 60.8. ATR $6.02. 20 DMA $177.89. 50 DMA $177.75. 200 DMA $169.52. From the 52-week high -28.7%.
The levels. Support at $177.20, $170.40, $164.77. Resistance at $196.09, $205.85, $233.44. Downside target $170.40. Bounce target $205.85.
Qualcomm is the holdout of the semi complex. It closed Thursday at $185.41, up 1.33% on the day, with an RSI of 60.8 that leads every name in this map. Price sits above the 20-day average at $177.89, the 50-day average at $177.75, and the 200-day average at $169.52. The three-month gain is 25.6%. In a week when the market punished AI capex, the name with handset and automotive diversification and a cheaper multiple simply went up.
Support is $177.20, which is the average stack, then $170.40 and $164.77. Resistance is $196.09, then $205.85, then $233.44. The continuation target is $196.09 first and $205.85 second. The failure signal is equally clean. A close below $177.20 breaks the stack and targets $170.40, and it would say the rotation out of the whole complex has reached its last shelter.
What do the benchmarks say?
SPY (SPY). Bias: intact.
The tape. Close $769.36. Day -0.38%. RSI 42.1. ATR $7.11. 20 DMA $771.16. 50 DMA $767.63. 200 DMA $728.53. From the 52-week high -1.6%.
The levels. Support at $758.68, $744.05. Resistance at $775.99. Downside target $744.05. Bounce target $781.62.
The index is not the story. SPY closed at $769.36, down 0.38% on Thursday, and sits 1.6% below its high. Breadth on Thursday was fine, with 373 of the 500 stocks rising while the mega caps dragged the average. Price holds just above the 50-day average at $767.63 and far above the 200-day average at $728.53. RSI is 42.1.
Support is the October 23 swing low at $758.68, then $744.05. Resistance is $775.99 and the high at $781.62. The index can absorb a lot of mega-cap pain because the other 493 stocks are not in a capex war. The level that changes that sentence is $758.68. Lose it and the rotation becomes a correction.
Nasdaq 100 (QQQ) (QQQ). Bias: short-term downtrend.
The tape. Close $715.34. Day -1.42%. RSI 33.8. ATR $12.56. 20 DMA $731.14. 50 DMA $725.41. 200 DMA $679.16. From the 52-week high -6.2%.
The levels. Support at $697.00, $661.14. Resistance at $733.35, $762.86. Downside target $679.16. Bounce target $725.41.
The Nasdaq 100 is where the capex fight actually lives. QQQ closed at $715.34, down 1.42% on Thursday, below the 20-day average at $731.14 and the 50-day average at $725.41, and above the 200-day average at $679.16. RSI is 33.8 and closing on oversold. The short-term trend is down and the long-term trend is intact, and the distance between those two statements is about 5%.
Support is $697.00 first. Below it the 200-day average at $679.16 is the line that decides the quarter, with $661.14 under that. Resistance is the 50-day average at $725.41 and then the high at $762.86. The downside target is $679.16. The repair target is a close above $725.41. Every hyperscaler and semi chart in this article is, in the end, a tributary of this one.
What do Tesla and SpaceX add to the picture?
Tesla (TSLA). Bias: uptrend stalling at $400.
The tape. Close $403.30. Day -0.23%. RSI 59.1. ATR $13.56. 20 DMA $379.24. 50 DMA $368.51. 200 DMA $385.50. From the 52-week high -19.2%.
The levels. Support at $393.63, $381.63, $368.56. Resistance at $415.38, $432.86, $445.60. Downside target $381.63. Bounce target $432.86.
Tesla is not a capex name, and its chart does not belong to the selloff. The stock closed Thursday at $403.30, down 0.23% in a quiet inside session on volume 0.61 times average. It has gained 29.6% in three months off the July low near $297. Price sits above the 20-day average at $379.24, the 50-day average at $368.51, and the 200-day average at $385.50. RSI at 59.1 is the second highest in this map. The uptrend is intact. The question on this chart is not survival. It is stamina at the $400 shelf.
After hours, stamina wobbled. Tesla traded to $395.77 in extended hours, down 1.87% from the close, slipping back under $400 toward first support at $393.63. Support steps down from $393.63 to the $381.63 shelf, where the 200-day average also sits, and then to $368.56 at the 50-day average. Resistance is $415.38, then $432.86, then $445.60. A Friday close under $393.63 targets the $381.63 shelf. A close above $415.38 reopens the run toward $432.86. The regular-session trend says up. The after-hours tape says the first test comes Friday morning.
SpaceX (SPCX). Bias: young listing in a downtrend.
The tape. Close $143.89. Day -0.92%. RSI 33.4. ATR $7.70. 20 DMA $154.57. 50 DMA $149.55. 200 DMA not yet available. From the 52-week high -36.2%.
The levels. Support at $143.04, $140.66, $130.39. Resistance at $149.68, $154.78, $158.13. Downside target $130.39. Bounce target $149.68.
SpaceX is the youngest chart in this map and it behaves like it. The stock listed on June 12, 2026 at a $135.00 offer price, spiked to $225.64 within days, collapsed to $104.83 by early August, and has been building a base ever since. It closed Thursday at $143.89, down 0.92% on light volume at 0.57 times its average. There is no 200-day average yet. The stock has not lived long enough to have one. Price sits below the 20-day average at $154.57 and the 50-day average at $149.55, so the short-term trend is down inside the base. RSI is 33.4 and approaching oversold.
After hours pressed the base. SpaceX traded to $141.35 in extended hours, down 1.77%, through first support at $143.04 and toward the $140.66 shelf. Below that shelf the levels thin out fast. The $135.00 IPO price is the next reference, then the swing cluster at $130.39, then the August low at $104.83. Resistance is $149.68 at the 50-day zone, then $154.78, then $158.13. The downside target if $140.66 fails on a close is $130.39. The bounce target on a hold is the 50-day zone at $149.68. A four-month-old stock with a beta near 5 does not do quiet technicals, and position size is again a technical input.
What would confirm the turn?
Drawdowns like this end on evidence, not on hope. Four prints would say the capex punishment is finishing.
A higher low in Alphabet. The most oversold name in the complex holding $278.50, or even $272.11, and building a base would mark the washout as complete. A second leg through $267.67 would say the opposite.
A QQQ close above $725.41. Reclaiming the 50-day average is the index-level repair signal. Holding the 200-day average at $679.16 on any further slide is the line that keeps this a drawdown inside an uptrend.
The RSI bench emptying. Names climb out of oversold by basing, not by V-shaped reversals. Meta holding above $594.81 while its RSI works back over 35 would be the template.
Microsoft holding $517.75. This is the risk tell rather than the repair tell. The holdout breaking its range low would say the selling has reached the name the market still trusts, and index support at $758.68 on SPY would come into play.
The map in one paragraph
The complex is oversold at the edges and broken in the middle. Alphabet and Meta carry the washout readings. Microsoft and Qualcomm carry the intact trends. Amazon and Arm sit on their 200-day lines, one of them already tested after hours. The next two weeks are a level-by-level negotiation between capitulation and repair, and the levels are all on the charts above. Fundamentals decide what these companies are worth. These lines decide where the argument happens.
The displacement forces underneath the semi charts are mapped in The Displacement Clock, and the Alphabet print that started this leg down is scored in Alphabet's Cloud Doubled. Its Cash Flow Failed.
Research and opinion, not investment advice. Do your own due diligence before investing.
Frequently asked questions
Which AI stock is the most oversold on technicals right now?
Alphabet, and it is not close. GOOGL closed October 29 at $283.82 with a 14-day RSI of 15.6 after a 12.64% one-day fall on 4.5 times average volume. Meta is the only other name under the 30 oversold line at 27.8. Marvell at 31.4, Arm at 33.6, and Amazon at 34.1 sit just above it.
What price levels matter most for the AI complex in the short term?
Three. Amazon closed within cents of its 200-day average at $243.38 and then traded down to its $225.55 support cluster after hours. Arm closed on its 200-day average at $228.42. The Nasdaq 100 sits between its 50-day average at $725.41 overhead and its 200-day average at $679.16 below, and which one breaks first sets the tone for November.
What happened in after-hours trading on October 29, 2026?
Every name that repriced after the close went down. Amazon traded to about $225.85, landing on its $225.55 support cluster. Intel traded into the mid-70s, below every support on its regular-session chart. Tesla traded to $395.77, down 1.87% from its close, and SpaceX traded to $141.35, down 1.77%, pressing its first support at $143.04. Extended-hours prices are thinner and less reliable than closing prices, and Friday's closes are the prints that confirm or deny them.
Are these price targets fundamental valuations?
No. Every target in this piece is a technical level, the next marked support below the price or the first marked resistance above it, measured on daily bars through the close of October 29, 2026. They describe where buying and selling interest has historically appeared. They are not valuations and they are not recommendations.
Disclosures
Not financial advice. This article is published for educational purposes only. Nothing here is a recommendation to buy, sell, or hold any security, and nothing here is financial advice. Technical levels are observations about past prices, not predictions. Investing involves risk, including the possible loss of principal.
Positions. The author holds long positions in Alphabet, Amazon, Meta Platforms, and AMD. The author holds no position in Microsoft, Oracle, NVIDIA, Broadcom, Marvell, Micron, Intel, Arm Holdings, TSMC, Qualcomm, Tesla, or Space Exploration Technologies.
Accuracy. Price data are daily exchange bars through the close of October 29, 2026, with extended-hours moves noted where earnings were released after that close. Indicators were computed from those bars. Errors can occur and facts change. Verify independently before acting on anything you read.
No advisory relationship. Reading this site does not create an advisor-client relationship of any kind. See the full disclosures page.