
What did Alphabet actually report in Q3 2026?
Alphabet reported after the close on Wednesday, October 28, 2026, the same day the Federal Reserve held rates steady. The quarter split cleanly in two. The growth engine did more than anyone asked of it, and the lines that fund the growth engine, earnings per share and free cash flow, both missed. The pre-print anchor used here is the consensus refreshed on October 26 in the DalalBytes earnings tracker: EPS of $3.03 and revenue of $127.91B.
| Alphabet, Q3 2026 | Yardstick | Call | |
|---|---|---|---|
| Revenue | $127.58B, +25% YoY | $127.91B anchor | Miss by $0.33B |
| Diluted EPS | $2.12 | $3.03 anchor (Zacks $2.94) | Miss by $0.91 |
| Core EPS (calculated) | About $2.67 | $3.03 anchor | Miss |
| Operating income | $40.58B, +30% YoY | $43.19B (FactSet, as reported) | Miss |
| Operating margin | 31.8% | 30.5% a year ago | Up 1.3 points |
| Net income to common | $26.17B | $34.98B a year ago | Down 25% |
| Google Cloud revenue | $30.71B, +103% YoY | About $29.1B expected | Beat |
| Search and other revenue | $63.35B, +12% YoY | $64.87B expected (IBD) | Miss |
| Capital expenditures | $51.36B | About $55B expected (as reported) | Below estimate |
| Free cash flow | Negative $9.07B | About +$2.7B expected (CNBC, as reported) | Large miss |
Two adjustments matter before judging the EPS miss. First, the headline is polluted by the investment portfolio, in the opposite direction from last quarter. Q2's $9.11 headline carried a $99B gain on equity securities; this quarter the same line swung to an $8.66B loss. The release discloses the after-tax effect precisely: the loss cut net income by $6.7B and EPS by $0.55. Add that back and core EPS is about $2.67 (calculated). The release did not name the holding behind the mark, but the call did: Ashkenazi told analysts the other income line was negative $8.2B due primarily to an unrealized loss on the company's investment in SpaceX, following a decline in its stock price in the third quarter.
Second, even the core number missed on real costs, not just marks. Investor's Business Daily put it plainly: investment losses explain $0.55 of the roughly $0.90 miss, and the rest is operating expense. Depreciation rose 49% year over year to $8.37B as the data center fleet flows into the income statement. Research and development rose 36% to $20.64B. The Alphabet-level activities line, primarily shared AI research, widened to a $7.66B loss from $4.47B a year ago. The build-out is no longer just a cash flow story. It is now an earnings story too.
How did the segments score?
Google Cloud is now a second engine, not a side bet. It was 15% of revenue a year ago and 24% this quarter, growing roughly nine times faster than Services, at a 36.2% operating margin. Cloud operating income of $11.12B also beat the roughly $9.8B FactSet estimate that Barron's cited, even with the third-party capacity bridging that management had warned would pressure near-term margins.
| Segment, Q3 2026 | Revenue | YoY | Operating income |
|---|---|---|---|
| Google Services | $96.30B | +11% | $39.16B |
| Google advertising | $82.01B | +11% | |
| Search and other | $63.35B | +12% | |
| YouTube ads | $11.21B | +9% | |
| Google Network | $7.46B | +1% | |
| Subscriptions, platforms, and devices | $14.29B | +11% | |
| Google Cloud | $30.71B | +103% | $11.12B |
| Other Bets | $0.37B | +8% | Loss of $2.05B |
| Alphabet-level activities | Loss of $7.66B | ||
| Total TAC | $16.37B | +10% | |
| Headcount | 204,757 | +8% YoY |
The soft spot is the core. Search growth has now decelerated for two straight quarters, from 19% in Q1 to 17% in Q2 to 12% in Q3, and the $63.35B print missed the $64.87B estimate. YouTube ads slowed to 9% from 13%. Services operating income of $39.16B came in below the roughly $40.8B Wall Street expected, per Barron's. The AI metrics management chose to print point the other way on usage: first-party model APIs now process nearly 32B tokens per minute, up 40% sequentially and more than four times a year ago, the Gemini app reached one billion users, and YouTube Music and Premium passed 150M subscribers including trials. Usage is compounding. Monetization of the newest usage is the open question, and the call took it up directly.
What did management say on the call?
Search: usage first, monetization second, and a named cause for the slope. Pichai's framing stayed one sentence long: "We are focused on building the best Search user experience, followed by monetization." The usage evidence remains strong: year-over-year query growth is the highest in five years, AI Mode queries run about three times longer than traditional searches, one in five AI Mode searches globally uses voice, images, or documents, and visual searches have crossed 50B a month. The deceleration explanation came from Philipp Schindler, and it was specific. FX, he said, was "the single largest driver of search deceleration relative to Q2." Behind it sat two vertical stories: APAC retail advertisers hit by the European Union eliminating its de minimis exception, and media and entertainment spend normalizing after a FIFA World Cup second quarter that pulled advertising budgets into June. The fourth driver is the one the market cares about most: AI Mode queries monetize at lower rates today, and their growth weighed on the revenue line. Schindler's counterweight was equally concrete. The majority of AI Mode queries are incremental, click-through rates on sponsored and organic product listings inside AI Mode are already similar, ads are now scaling inside both AI Overviews and AI Mode, ads in AI Mode are expanding into international markets for the first time, and multi-turn ads are live in the US. Ashkenazi added the forward cost of the comparisons: lapping the Search acceleration of late 2025 cost about three points of growth in Q3, with a couple more points expected in Q4, and the Q4 FX headwind looks slightly larger at current spot rates.
Cloud: the demand is on the record, the capacity is the constraint. Cloud CEO Thomas Kurian joined the call, and the backlog figure that live coverage had attributed to the call is now confirmed in management's own words: $561B at the end of Q3, per Ashkenazi, the majority of it tied to typical GCP contracts, with just over 55% expected to convert to revenue over the next 24 months. Kurian said GCP accounted for the vast majority of the quarter's revenue and that growth excluding TPU system sales was again very strong, though he gave no number when Bernstein's Mark Shmulik asked for one. On capacity, Ashkenazi was plain: the third-party bridging capacity discussed last quarter came online only at the very end of Q3, which limited its margin damage this quarter; it ramps through Q4, and management expects margin headwinds in the near term while it is used. Kurian conceded the constraint directly: "we could obviously serve a lot more demand with capacity." The TPU systems business got its fullest airing yet: nearly 100 customers now run TPUs, Apple is scaling pre-training of its foundation models on the latest generation, Anthropic buys both directly and through Broadcom, and Google has signed partnerships to deliver TPU systems with Crux AI and Oracle, including into customer data centers. Cloud now has 18 product lines above $1B in annual revenue, more than 2,600 customers have used at least 100B tokens on Gemini Enterprise in the past year, nearly 75 have used at least 10 trillion, and nearly 90% of the Fortune 100 use Gemini Enterprise.
Capex and cash: the guide held, the two big answers stayed deferred. The FY2026 capex guide was reaffirmed at $195B to $205B, which implies roughly $68B of spending in Q4 alone at the midpoint (calculated). On 2027, Ashkenazi repeated the sentence from Q2: "We continue to expect our capex to increase significantly in 2027, and we'll provide further details on our Q4 call." No free cash flow recovery date was offered either. What she offered instead was a framework: the company expects to generate an attractive return on invested capital that "remains meaningfully above our cost of capital," and she named two Q3 cash drags beyond capex itself, the TPU systems inventory build and a $5.2B cash payment of the 2018 European Commission fine, made after the appeal process completed. The commitment stock is also confirmed on the record now: $924B of future purchase commitments and $152B of pre-commencement leases and other obligations at the end of Q3, both stated as maximum contractual amounts, with variable pricing and volume flexibility that could result in lower spend. Barclays' Ross Sandler pressed the TPU resale economics directly, asking what share of a full system price, around $35B per gigawatt on his math, gets recognized as revenue and what the margin flow-through looks like. Ashkenazi declined product-level financials, but the mechanics she and Kurian laid out matter: signed system deals enter backlog first, components are procured and inventory is built only against signed contracts, cash goes out ahead of revenue, and deliveries bill as systems ship, with the revenue ramp weighted to 2027. The declared dividend holds at $0.22 a share. Buybacks were not mentioned once on the call.
Agents got real answers. Morgan Stanley's Brian Nowak asked what stands between today's agentic products and a billion-user rollout. Pichai pointed to distilled versions of the Carbon models so agents can run efficiently at that scale, a secure runtime and harness around the models, and an enterprise-first launch, with the same experience coming to consumers later this year, starting with the Gemini app's one billion users. Bank of America's Justin Post asked whether the agentic transition is a headwind; Schindler called agentic experiences "clearly additive" and argued the discovery part of shopping, the part users enjoy, will be designed into agentic flows with advertising models built for them. Pichai closed the call on platform philosophy: TPU systems, like the browser and the operating system before them, are a platform to be sold to everyone, including competitors, with Apple named as the standing example.
What was not said. The full call settles this: across seven analyst questions, no one raised the DOJ remedies phase, the DMA, or the app store cases, and management did not volunteer them. The only legal item anywhere on the call was the European Commission fine, and it appeared as a cash payment, not a discussion. The two numbers analysts most wanted, a 2027 capex figure and a free cash flow recovery date, were both deferred to the Q4 call for a second straight quarter. The prepared remarks also carried the long-term bets update: Waymo has driven more than 300M fully autonomous miles and now operates in 15 major US cities, with San Antonio, San Diego, and Tampa newly open to the public, and planned expansions into Canada, Germany, Singapore, and Spain.
What does the capex and cash picture look like?
The free cash flow path is now a four-quarter staircase down, and Q3 is the second consecutive negative quarter, worse than the first. Operating cash flow itself fell year over year, to $42.29B from $48.41B, while capex more than doubled. On the call, Ashkenazi put two further drags inside the quarter's cash flow: the buildup of inventory for TPU system sales, and a $5.2B cash payment of the 2018 European Commission fine, made following the completion of the appeal process. This is the exact pattern the pre-print scorecard defined as its cash flow fail: a second negative quarter, deeper than Q2, with buybacks still at zero.
| Quarter | Operating cash flow | Capex | Free cash flow |
|---|---|---|---|
| Q4 2025 | $52.40B | $27.85B | $24.55B |
| Q1 2026 | $45.79B | $35.67B | $10.12B |
| Q2 2026 | $39.07B | $44.92B | Negative $5.86B |
| Q3 2026 | $42.29B | $51.36B | Negative $9.07B |
| Trailing twelve months | $179.55B | $159.80B | $19.75B |
The funding side is the regime change. For the first nine months of 2026, Alphabet raised about $147.2B of outside capital (calculated from the release's cash flow statement): $42.87B of common stock, $19.06B of mandatory convertible preferred, and $85.22B of debt proceeds. In Q3 alone it sold 36M shares through its at-the-market program for about $12.4B and issued $28.7B of senior notes. Buybacks were zero in Q3 and zero for the nine months, against $39.81B in the same period of 2025; Barron's, citing FactSet, notes three straight quarters without repurchases for the first time since 2015. Long-term debt has risen to $125.10B from $46.55B at the end of 2025. The balance sheet is not strained: cash and marketable securities stand at $265.10B, and the declared quarterly dividend holds at $0.22 per share, payable December 14. But the direction is unmistakable. A company that retired stock for a decade is now issuing it, and the inventory line shows why the cash need keeps rising: inventory jumped to $13.31B from $2.44B at year end, the TPU systems build the CFO cited.
Thesis checkpoint: two gates passed, two failed, two landed in between
Alphabet has no published DalalBytes five-pillar report, so this print is checkpointed against the Q3 2026 earnings preview scorecard (prepared October 17, 2026, refreshed October 26 with the $3.03 EPS and $127.91B revenue anchor), not against a house score. The scorecard set six gates and warned in advance that the capex and cash flow gates, not the revenue beat, were the ones that would move the stock.
| Gate | Bar | Score | |
|---|---|---|---|
| 1. Revenue | $127.91B anchor; fail below $124B | $127.58B, +25% | Narrow miss |
| 2. Cloud holds | Growth at or above 65%, margin at or above 30% | +103%, margin 36.2%, backlog $561B | PASS |
| 3. Search holds | Mid-teens growth; fail at single digits | +12% | Between |
| 4. Core EPS | At or above $3.03; fail below $2.94 | About $2.67 ex the equity loss effect | FAIL |
| 5. Capex watch | Guide held at $195B to $205B, no large 2027 pre-commitment | Guide held; 2027 left at "increase significantly," details on the Q4 call | PASS, warning live |
| 6. Cash flow repair | FCF positive, or a smaller negative than Q2 | Negative $9.07B, worse than Q2's negative $5.86B, buybacks zero | FAIL |
The checkpoint reads negative for the print. The two failed gates are the earnings quality gate and the exact cash flow pattern the scorecard pre-defined as failure, and the market scored it the same way within the hour. The franchise read is separate, and it is not negative: Cloud passed its gate by the widest margin on the sheet, Search queries are growing at a five-year high, and the balance sheet carries $265.10B of cash and securities. This is a cash conversion break, not a business break. The technical section below is built on that distinction.
What do the technical levels say?
GOOGL closed Wednesday at $324.89, up about 1.3% on the day (calculated), on volume of 54.0M shares, roughly double its recent average, in a session that also carried the FOMC decision. The print then repriced it: Barron's had the stock down 8.6% after hours at $297.02, and IBD later showed extended trading near $291, a fall of more than 10% from the close. Going into the print the stock sat 20.5% below its 52-week intraday high of $408.61 (May 18, 2026), inside a year that has run from $266.50 to $408.61. The indicators below are computed from Yahoo Finance daily data through the October 28 close.
| Indicator | Reading | Note |
|---|---|---|
| Close, Wed Oct 28, 2026 | $324.89 | Up about 1.3% on the day (calculated) |
| After hours | $297.02, down 8.6% (Barron's); near $291 later (IBD) | Through the first support zone |
| 50-day moving average | $341.51 | Price about 5% below |
| 200-day moving average | $341.20 | Price about 5% below; the two averages sit on top of each other |
| RSI (14) | 38.7 | Weak, not washed out |
| 52-week range (intraday) | $266.50 to $408.61 | Close is 20.5% below the high (calculated) |
| October range (intraday) | $316.60 to $359.40 | The consolidation the print just broke |
| Volume trend | 20-day average 25.1M shares vs 33.1M in the prior 60 days | The October slide ran on shrinking volume; print day printed 54.0M |
The level map, from the same data. Resistance starts at $340 to $342, where the 50-day and 200-day averages converge almost exactly; that confluence capped the stock repeatedly in September and October and is the first ceiling on any recovery. Above it sit the September and October swing highs at $355 to $359, then the July and August highs at $371 to $378, then the May highs at $403 to $409. Support ran the other way: the $315 to $318 shelf (the October 26 low of $316.60 and the July 23 low of $314.90) was the floor of the three-month range, and the after-hours move has already cut through it. Below that, the map is built from the winter base at $296 to $302, the March low near $273 to $277, and the 52-week low at $266.50. RSI at 38.7 says the stock was weak into the print but not capitulated, which is consistent with what happened next: there was no washed-out base to catch it.
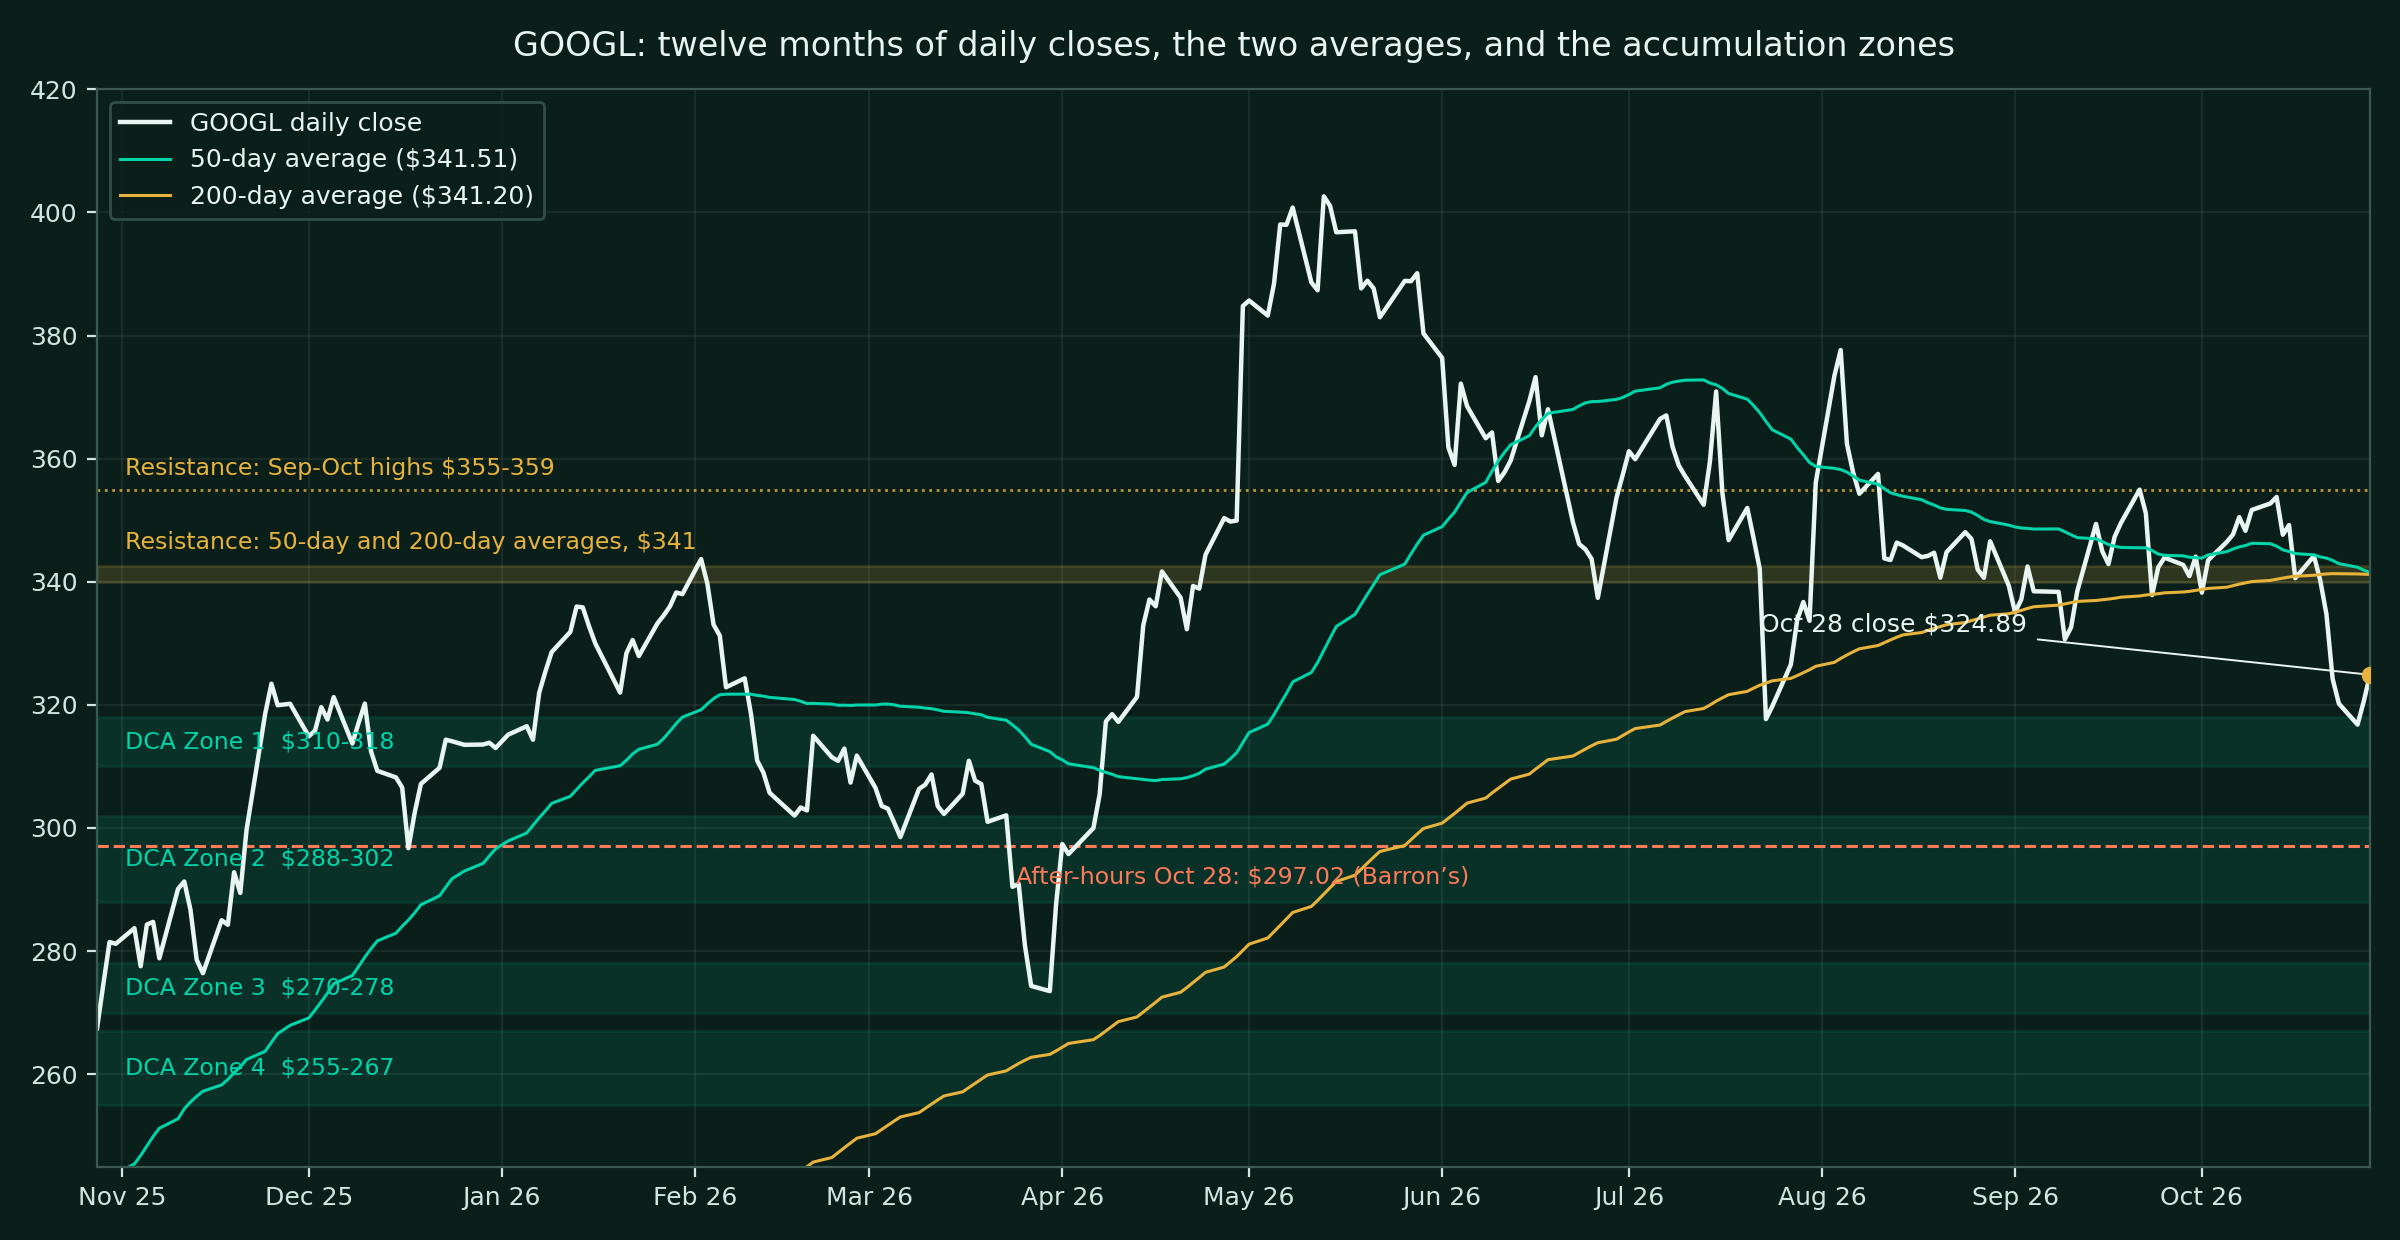
Where are the staged accumulation zones?
The framing matters. This ladder is for a long-term holder adding to an existing position in tranches if the price comes to them, sized as quarters of the intended total addition, not a trading plan and not personalized advice. It is anchored to the $324.89 close. The after-hours move has already skipped the first zone and landed inside the second, so Zone 1 now works as the first reclaim shelf on any recovery as much as a buying zone, and Zone 2 is the active one if Thursday opens where the evening session left off.
| Zone | Price range | Discount from $324.89 | Technical basis | Pacing |
|---|---|---|---|---|
| Zone 1 | $310 to $318 | About 2 to 5% | The base of the three-month range: the October 26 low of $316.60 and the July 23 intraday low of $314.90 | First quarter |
| Zone 2 | $288 to $302 | About 7 to 11% | The winter base cluster: closing lows of $296.72 (Dec 2025), $302.02 (Feb 2026), and $298.52 (Mar 2026). The after-hours range of $291 to $297 sits inside this zone | Second quarter |
| Zone 3 | $270 to $278 | About 14 to 17% | The March 30, 2026 closing low of $273.50 and the November 2025 closing low of $276.41 | Third quarter |
| Zone 4 | $255 to $267 | About 18 to 22% | The 52-week intraday low of $266.50 from October 28, 2025, and a full retracement of the year-long advance | Final quarter |
Invalidation. Each zone assumes the level holds on a closing basis. If a zone fails on a weekly close, the discipline is to stop adding at that level and let the next zone do the work, not to chase the break. A weekly close below $255 breaks the base structure of the entire year-long chart and invalidates the ladder as drawn; at that point the question stops being technical. The fundamental invalidations are the scorecard's own fail lines printed in a reported quarter: Search growth falling to single digits, or Cloud growth below 55%, or a remedies outcome that structurally separates the Chrome or Android distribution the Search economics rest on. None of those has happened. What has happened is a funding pattern, and funding patterns are what staged ladders are for.
Which risks are real after today, and what would change the view?
The print in one line. Alphabet asked shareholders to fund a $200B year of spending, declined to size next year's, and reported the second straight quarter in which the spending exceeded the cash the business generated. The growth it is buying is real and visible in Cloud. The bill is also real, and it is now being paid with issuance.
Capex without a ceiling. The 2027 increase is confirmed in direction and unquantified in size, with $924B of purchase commitments already on the books at Q3 end, a figure Ashkenazi confirmed on the call alongside $152B of pre-commencement leases and other obligations. Barron's also notes the Street expects capex to exceed operating cash flow into 2028. Until the Q4 call puts a number on 2027, every quarter re-opens the same argument Q2 and Q3 just had.
The dilution turn. Three straight quarters without a buyback, $42.87B of stock issued in nine months, and $27.6B still available on the ATM program. The share count rose to 12.37B diluted in Q3 from 12.20B a year ago. For a holder, this is the quiet line: the per-share compounding machine is running in reverse while the build-out lasts.
Search slope and the AI Mode gap. Search growth has halved in two quarters, 19% to 17% to 12%, and management attributes the slope to FX and to AI Mode mix that monetizes below traditional Search. Agentic browsing is the longer shadow: if agents do the searching, the query growth Pichai cited may not accrue to Google's ad surfaces. The five-year-high query growth is the bull answer; the 12% revenue growth is the current fact.
Cloud concentration. Barron's flagged the counterparty file on Monday: Anthropic's IPO prospectus mentions Google 109 times, as a competitor, a greater-than-5% shareholder after the IPO, and one of its most important suppliers, with Anthropic committed to about $114.5B of Google Cloud spend through 2033 per the filing coverage. Cloud's triple-digit growth has a named, newly public counterparty inside it, and the stock may start trading on Anthropic news the way Oracle trades on OpenAI news.
The portfolio swing. The equity book added $6.26 a share in Q2 and subtracted $0.55 in Q3. Headline EPS will keep whipsawing with private marks until the holdings list or IPO, and consensus will keep missing in both directions. Core EPS, stripped of the disclosed effect each quarter, is the only honest trend line, and this quarter it decelerated on depreciation and AI research costs.
What would change the view. A 2027 capex figure with a ceiling on it at the Q4 call. A dated free cash flow inflection. Search re-accelerating into the mid-teens. Cloud holding growth above 65% with margin above 30% for two more quarters, proving conversion rather than capacity buying. Any one of the first two would do more for the stock than another Cloud beat, because the gates that failed tonight were cash gates, not growth gates.
What to watch next. Thursday's open against the $288 to $302 zone. The Q4 print in early February, where the 2027 capex number is promised. Anthropic's listing, targeted for November, as a read on Cloud's largest disclosed customer. And the remedies calendar, which the call left untouched and the stock cannot ignore forever.
Research and opinion, not investment advice. Do your own due diligence before investing.
Frequently asked questions
Did Alphabet beat or miss in Q3 2026?
It missed on the lines that move the stock. Revenue of $127.58B came in just under the $127.91B pre-print anchor, headline EPS of $2.12 missed the $3.03 consensus, and core EPS of about $2.67, after adding back the disclosed $0.55 equity loss effect, still missed. Google Cloud was the clear beat, with revenue up 103% to $30.71B against about $29.1B expected.
Why did Alphabet stock fall after hours?
Free cash flow was negative for a second straight quarter at negative $9.07B, worse than the June quarter, buybacks stayed at zero, and management gave no 2027 capex figure and no date for cash flow recovery. Search growth also slowed to 12% from 17%. Shares fell 8.6% in after-hours trading to $297.02, per Barron's.
Where are the staged accumulation zones for GOOGL?
Four zones below the $324.89 close: $310 to $318 at the October base, $288 to $302 at the winter 2025 to 2026 base where after-hours trading already landed, $270 to $278 at the March 2026 low, and $255 to $267 at the 52-week low. A weekly close below $255 invalidates the ladder.
Disclosures
Not financial advice. This article is published for educational purposes only. Nothing here is a recommendation to buy, sell, or hold any security, and nothing here is financial advice. Investing involves risk, including the possible loss of principal. The technical levels and accumulation zones are general market analysis, not a personalized recommendation.
Positions. The author holds a long position in Alphabet.
Accuracy. This analysis is built from public sources believed to be reliable, including Alphabet's Q3 2026 earnings release, the earnings call transcript taken from the official Alphabet Investor Relations YouTube stream of the October 28, 2026 call, company filings, earnings call coverage, and market data. Errors can occur and facts change; verify independently before acting on anything you read.
No advisory relationship. Reading this site does not create an advisor-client relationship of any kind. See the full disclosures page.