

What do the technicals say if the trend has turned?
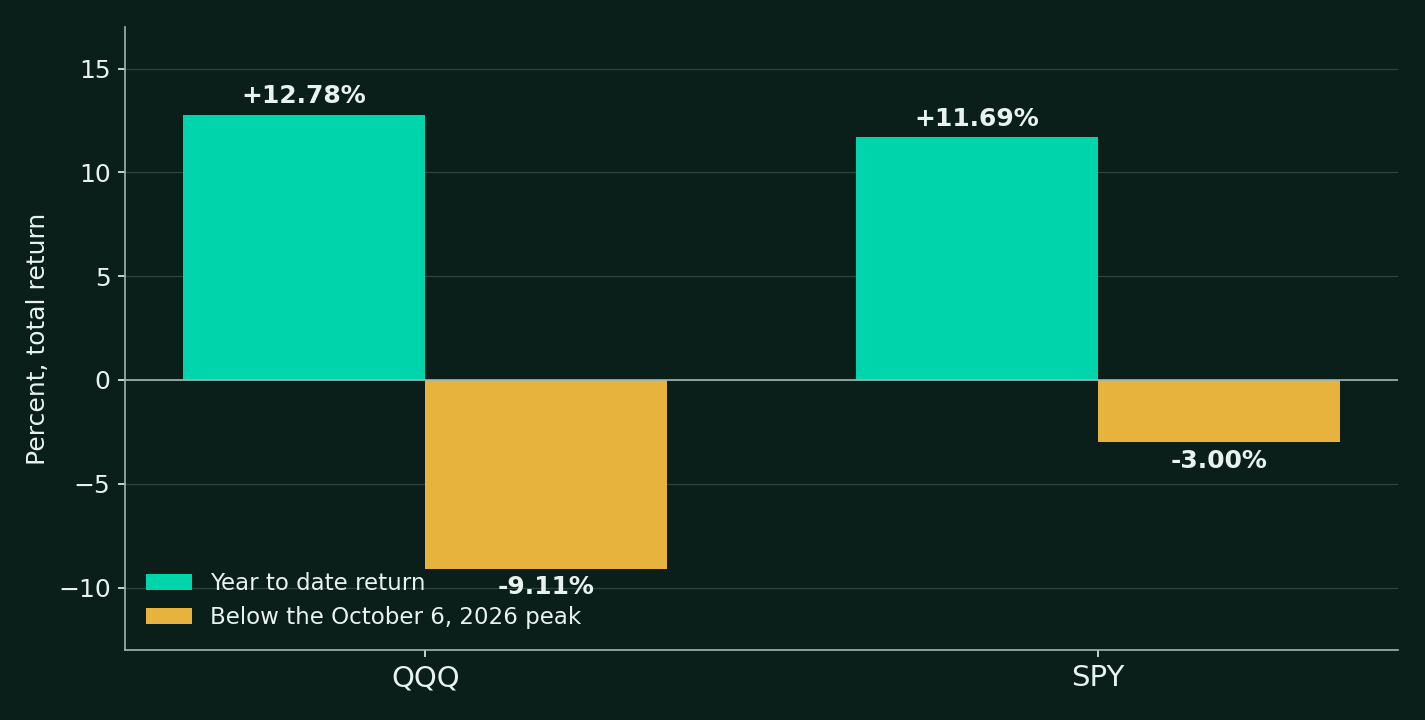
My read starts with the tape, because the tape is where the disagreement lives. The indexes say this year is fine. QQQ is up 12.78% year to date and SPY is up 11.69%, total return, through Friday's close. Look one layer down and the year looks very different. Both indexes peaked on October 6, 2026. QQQ has since fallen 9.11% from that peak and lost about 6.7% in October alone. SPY sits 3.00% below its peak, cushioned by everything inside it that is not a technology stock.
| Index | Year to date, total return | Below the October 6, 2026 peak |
|---|---|---|
| QQQ | Up 12.78% | Down 9.11% |
| SPY | Up 11.69% | Down 3.00% |
My technical rule is simple, and it is the first claim in this read. If the macro trend has turned down, most individual names have much further to go, because most of them never had the index's cushion to begin with. The index average is a weighted story about a handful of giants. The average stock's year has been far rougher than the average suggests.
October made the point name by name. In this site's monthly audit of the names I follow, computed from Finnhub daily closes, Alphabet fell 18.7% in October, Nebius fell 34.7%, and IREN fell 41.4%, in a month when SPY's one-month return was about negative 1%. Those are not index moves. They are what a turning trend does to crowded single names while the headline average still reads as a good year. Anyone whose comfort comes from the index level is reading the cushion, not the market.
Why is Apple the exception among the big names?
Most of the big names are doing badly, and October's audit is the evidence. The exception is the biggest name of all. Apple is up 26.77% this year, closed Friday at $344.63, and carries a market cap of about $5.07T. The reason is not a product cycle. It is what Apple refused to do.
Apple spent $12.7B on capex in all of fiscal 2025 and $6.8B through the first nine months of fiscal 2026, converting roughly 90% of its operating cash flow into $110B of free cash flow across those nine months. Microsoft spent $35.8B on capex in its June 2026 quarter alone, nearly three times Apple's full-year figure. In a quarter when the market punished Alphabet, Amazon, and Meta for exactly that spending, the one giant that sat out the capex race became the refuge.
The refuge is not cheap, and honesty requires the other side of it. Apple trades at a forward P/E of about 37.3x, the highest in its history, per TIKR. The market has already paid Apple in full for its discipline. If the spending names are ever forgiven, the refuge premium is the thing that deflates. Apple's own next test is immediate, with fiscal Q4 results scheduled for Monday, November 2.
What is the market actually waiting for on Tuesday?
On Tuesday, November 3, the United States votes, and the market's posture into the vote is mostly a wait. The expected result is a change of control. Republicans go in holding the Senate 53 to 47 and a narrow House majority. Both are priced to go.
| Question | Prediction markets, October 30 | Forecasters and polls |
|---|---|---|
| Democrats win the House | 92% to 94% on Polymarket and Kalshi | Decision Desk HQ at 80%. Generic ballot, Democrats ahead by 8.2 points |
| Democrats win the Senate | About 69% on Polymarket and Kalshi | Decision Desk HQ at 60% |
| Democratic sweep of both chambers | Priced near 67.5% on Kalshi | Seven Senate races rated toss-ups by the Cook Political Report |
Strip the party labels away and the market translation of those odds is one word. Gridlock. A Republican president facing a Democratic Congress cannot pass a program, and that Congress cannot pass one over his veto. Which raises the question this read actually turns on.
Is gridlock good for stocks, or is that a story investors tell themselves?
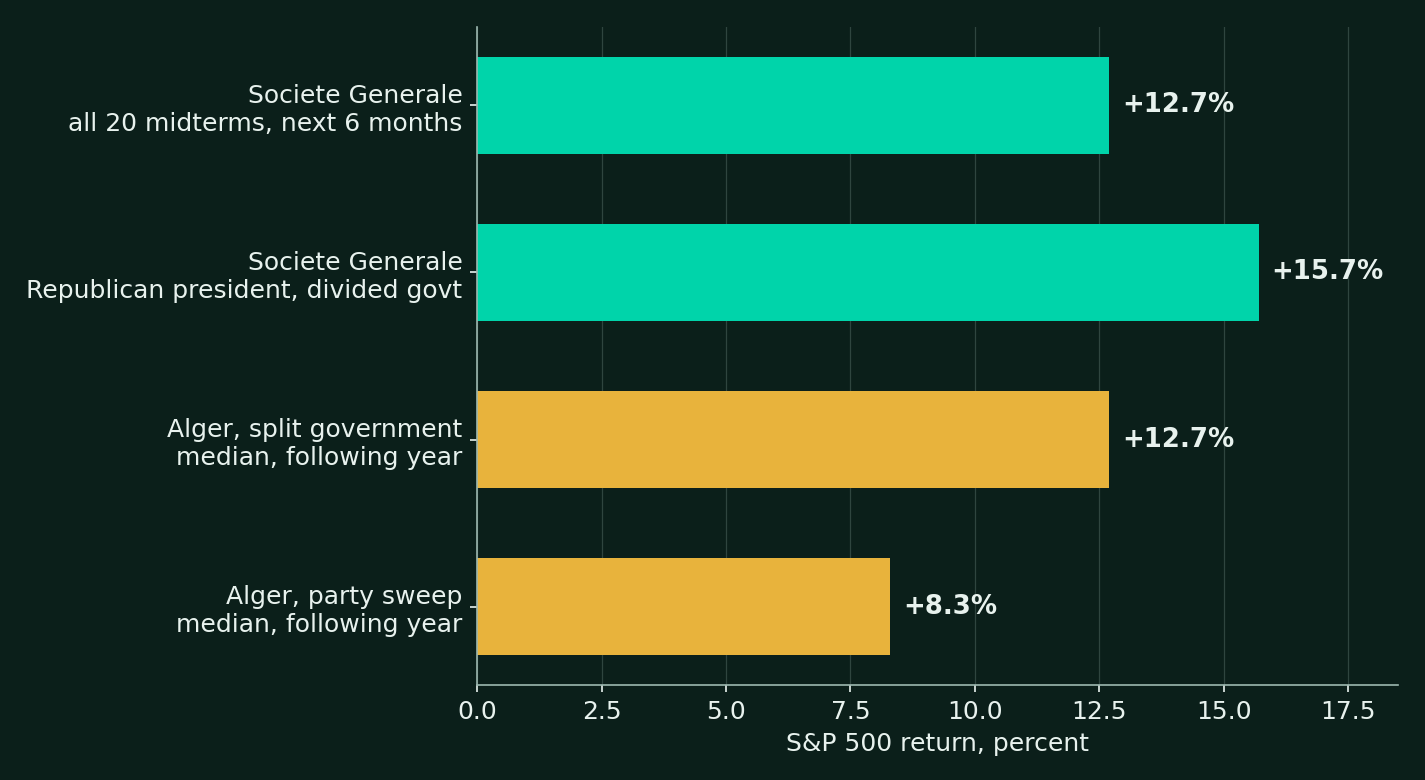
The honest answer is that the evidence disagrees with itself, and anyone quoting a single study is selling something. Start with the supportive side, because it is stronger than I expected. Societe Generale measured the six months after all 20 midterms in its sample and found an average S&P 500 gain of 12.7%, positive 95% of the time. Narrow the lens to a Republican president with a divided government, the configuration the odds point to, and the average gain rises to 15.7%, positive in all nine cases. Alger, using FactSet data over November to October windows from 1980 to 2025, found a median return of 12.7% in the year after elections that produced split government, against 8.3% after elections that produced a party sweep.
Now the other side, in a table, because the tension is the finding.
| Study | Window | Split or divided result | Unified or sweep result | Read |
|---|---|---|---|---|
| Societe Generale | 20 midterms, six months after the vote | 15.7% average under a Republican president with divided government, positive in all nine cases | 12.7% average across all midterms, positive 95% of the time | The post-midterm seasonal is strong. SG itself warns 2018 still drew down nearly 20% because the Fed was tightening |
| Alger, on FactSet data | November to October, 1980 to 2025 | 12.7% median after split government elections | 8.3% median after party sweeps | Split government ahead on medians |
| Janus Henderson | 50 years to October 23, 2026 | 9.24% annualized, volatility 18.50% | 8.73% annualized, volatility 15.35% | A wash on return. Split control is the more volatile regime |
| RBC Wealth Management | Since 1953 | A Republican president with a split or Democratic Congress sits among the more muted combinations | Strongest cells were a Democratic president with a split Congress, a Democratic president with a Republican Congress, or unified Republican control | The expected 2027 configuration is historically the muted one |
| Yale, ITAM, and Oxford study | Since 1871 | Divided governments trailed | Unified governments ahead by 7.05 annualized points, and slightly ahead since 1945 | The longest window disagrees with the folk wisdom outright |
My conclusion is narrower than the slogan. Gridlock is not a tailwind. It is the removal of a tail risk. No large tax change, no large regulatory program, and no large new spending commitment can clear a split government, and that ceiling on policy surprise is worth something to valuation multiples. It is not worth a rally by itself. What decides 2027's direction is what decided 2018's. The Federal Reserve and the profit cycle, which answer to neither chamber.
Where does gridlock actually bite?
Where gridlock does bite is the budget. A split government still has to fund itself, and every appropriation, every debt limit increase, and every supplemental becomes a negotiation with a majority on one side and a veto on the other. My expectation for the next two years is spending fights, continuing resolutions, and programs that stall at the approval stage rather than die in open debate. Getting anything approved becomes the challenge, and government spending is where that challenge lands.
The standing example of gridlock itself becoming the market event is 2011, when a divided government's debt ceiling standoff ran to the deadline and ended in a downgrade of United States credit. None of the return studies prices that kind of episode, because the studies average over it. The average is calm. The path is not.
Why is the window between the vote and January 3 the dangerous part?
The new Congress is sworn in on January 3, 2027. Between Tuesday and that date sits a lame-duck window of about two months, holding an outgoing Congress, an executive whose legislative clock has run out, and one large unresolved fact. The war.
The United States and Israel have been at war with Iran since February 28, 2026. The ceasefire of April 8 collapsed on July 10. Through October the war moved to the water. Tanker attacks in and around the Strait of Hormuz in October were the highest since 2017, and on October 30 a tanker was struck by an explosive device attached to its hull, the first hull-mine attack reported in this war. Brent crude settled Friday at $117.64, up 2.4% on the day and up 13.6% across October. WTI settled at $104.12, up 15.2% in the month. Oil sits at six-month highs because the market believes the calendar, and the calendar says whatever restraint an election imposes ends on Wednesday.
President Trump has repeatedly hinted that strikes on Iran could resume after the midterms. ING's strategists framed the two-sided version of the same trade. Traders are bracing for escalation after November 3, and if the escalation does not come, the war premium in oil erodes and prices fall even without any agreement. The diplomatic track runs in parallel. Vice President Vance has written to the head of Iran's security council seeking to revive talks, and Qatari mediators have circulated a new draft agreement.
My read is the strong version of the window argument. Things are very likely to escalate to a finish after the elections, and one way or another there will be an end in sight to this war before the new Congress is sworn in. A finished war, or a visibly finishing one, takes the energy premium out of the inflation data. An escalating war does the opposite, inside the same window. That is why the gap between the vote and January 3 is where the risk in this read concentrates.
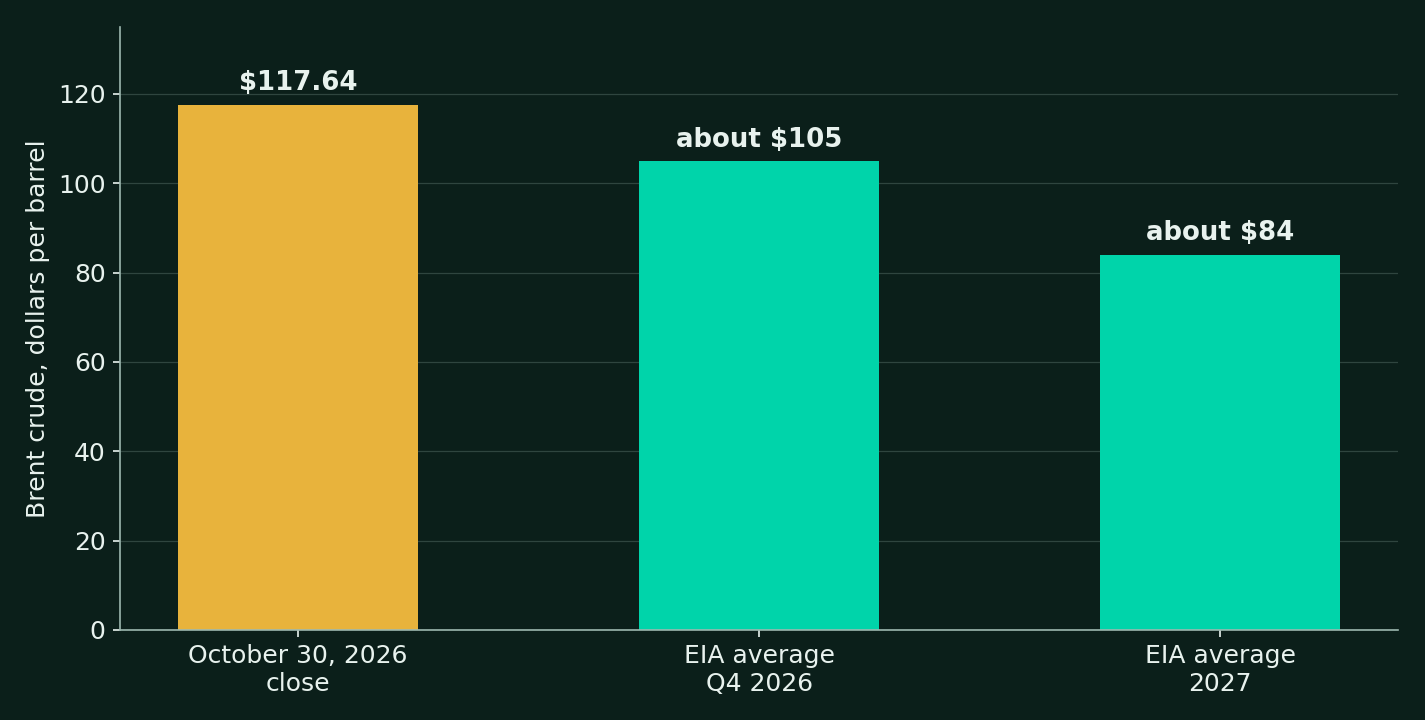
The EIA's numbers are what the de-escalation path looks like on a chart. Brent averaging about $96 across 2026 and about $105 in the fourth quarter, then about $84 across 2027 as flows recover. The agency is not forecasting peace. It is forecasting that flows normalize, which is what an ending war does to a price.
What happens to inflation and the AI race in 2027?
Inflation, in my read, will be brought under control next year, and the war is the swing variable in that sentence. Energy is the channel. A Brent price sliding from $117.64 toward the EIA's $84 average for 2027 is a disinflationary force that no rate decision has to manufacture.
Underneath it, the AI race continues on its own course, indifferent to Tuesday's result. The build is funded by balance sheets and debt markets rather than appropriations, and gridlock in Washington does not slow a data center in Virginia. That independence cuts both ways. Politics will not rescue the AI trade, and politics will not stop it. It gets settled by cash flow, which is where this read ends.
Why do I expect a sideways 2027, and who breaks out of it?
My 2027 read is a sideways market at the index level, with pockets of outperformance rather than a broad advance. The sideways part follows from everything above. A gridlocked government offers no fiscal accelerant. The war premium leaves energy prices slowly rather than in one relief rally. And the largest companies in the index are midway through the heaviest spending cycle in their history, which caps the index's free cash flow growth even while revenues compound.
The pockets, I expect, sit where the spending story changes tense. Through 2026 the market paid for AI revenue and punished AI capex. The turn, when it comes, arrives announcement by announcement. Each hyperscaler that credibly signals its capex peaks and winds down into 2028 converts its story from funding a build to harvesting one, and October's tape says the market pays for that conversion immediately. The announcements will come slowly, one company at a time, because no management team wants to call a peak while its competitors are still spending.
| Company | What it has actually said | Capex and cash position | Signal read |
|---|---|---|---|
| Oracle | A $20B funding cap, split $10B equity and $10B gross debt, called the final amount by its CFO. Free cash flow positive in the second half of fiscal 2028. At least $30B of free cash flow in fiscal 2029. Fiscal 2030 floors of revenue above $225B and EPS above $21 | Guidance given at the October 28, 2026 investor day | The wind-down, announced. The lead |
| Alphabet | 2027 capex will increase significantly. No figure given and no free cash flow recovery date offered | Q3 2026 capex of $51.36B and free cash flow of negative $9.07B. Fiscal 2026 guide held at $195B to $205B | Still accelerating, unquantified |
| Amazon | 2027 capex described only as meaningfully more | Fiscal 2026 capex held at about $220B. Trailing free cash flow of negative $42.4B | Still accelerating, unquantified |
| Meta | A non-voting Class C stock created to finance growth | 2026 capex narrowed to $135B to $145B. Q3 free cash flow of negative $2.12B | Financing the build, not dating its end |
Oracle has the lead on this, and it is not close. The company with the most leveraged balance sheet in the group is the one that has already used the grammar the others will eventually borrow. A cap. A date. A cash flow number. Alphabet, Amazon, and Meta have each so far said the opposite, in their own words. More is coming, and the amount is not being shared. DalalBytes graded the Amazon print in AWS Grew 39% and Guided Above 40%. The Market Sold the Cash Flow. and the Oracle commitments against delivery in the Oracle investment report.
There is a second half to that trade, and it belongs to the suppliers. One company's capex is another company's revenue. The hyperscalers at the top of that table are the hardware cycle's customers, and markets are forward looking. The hardware cycle will not wait for 2028 orders to fall before it slows. It slows in anticipation, through 2027, as each wind-down announcement lands. October already showed the shape of it. AMD fell 17.5% in a month when its roadmap news was good, with its Helios racks installed and testing at Meta. Nothing about the demand directly in front of AMD changed. What changed was the market's guess about the demand behind it.
The slowdown is not the end of the cycle, because the next leg is already visible. Robotics and edge AI will gain traction. The design wins and the inference launches are real. But that demand is in its infancy. It produces pilots and platform deals today, not orders at data center scale, and it is a few years away from carrying a hardware cycle. Between the data center build peaking and the physical AI build arriving at scale, there is an air pocket, and the hardware names sit inside it.
Forward looking cuts both ways. A market that prices the 2028 slowdown during 2027 can also price the recovery before the robotics orders show up. The hardware bottom, when it comes, will probably arrive while the headlines still read badly. That is what anticipation means.
Watch the language, not the launches. The first of the other three to stand up in 2027 and put a ceiling on the build, with a date for cash flow turning, is the one that breaks out of the sideways market first. Until then, the index goes sideways and the pockets belong to whoever calls the peak.
The read in one line. Gridlock removes the policy tail risk and adds a two-year spending fight. The war resolves, one way or the other, inside the lame-duck window. Inflation cools with the oil premium. And 2027 belongs, name by name, to whichever spender calls the capex peak first.
Frequently asked questions
Is gridlock good for stocks?
The evidence is genuinely split. Societe Generale found the S&P 500 averaged a 12.7% gain in the six months after midterms, and 15.7% under a Republican president with divided government. Janus Henderson found split and unified control nearly identical over fifty years. My reading is that gridlock removes policy tail risk without creating a tailwind.
Why is the period between the election and January 3 risky?
Because it is a lame-duck window with a war inside it. The outgoing Congress sits until January 3, 2027, the executive's legislative clock stops, and the restraint the election imposed on the Iran war ends. President Trump has hinted strikes could resume after November 3, and oil at $117.64 already prices some of that.
Why would 2027 be sideways, and what outperforms?
Sideways is what you get when gridlock offers no fiscal push, the war premium leaves energy prices slowly, and the biggest index weights are mid-way through a record spending cycle. The outperformance pockets sit with the hyperscalers. As each one signals capex winding down into 2028, its story turns from funding a build to harvesting one.
Disclosures
Not financial advice. This article is published for educational purposes only. Nothing here is a recommendation to buy, sell, or hold any security, and nothing here is financial advice. Investing involves risk, including the possible loss of principal.
This is a forecast. This article is the author's market view, written before the November 3, 2026 election. The election outcome, the course of the Iran war, the path of oil and inflation, and the shape of 2027 described here are opinions and forecasts, not facts, and they will be wrong in places. Where the article states facts, it names their sources so the reader can weigh the forecast against them.
Positions. The author holds long positions in Alphabet, Amazon, and Meta, all discussed in this article. The author holds no position in Apple or Oracle.
Accuracy. Index returns are from PortfoliosLab and TotalRealReturns through the October 30, 2026 close. Apple figures are from Finnhub, TIKR, and Motley Fool coverage. Election odds are as reported from Polymarket and Kalshi on October 30, 2026, with forecast comparisons from Decision Desk HQ, the RealClearPolling generic ballot average, and the Cook Political Report. Gridlock studies are from Societe Generale, Alger, Janus Henderson, and RBC Wealth Management, with the Yale, ITAM, and Oxford study as summarized by MarketWatch. Oil prices and war developments are from Reuters and market coverage, and the oil price outlook is from the EIA's October 2026 Short-Term Energy Outlook. Hyperscaler statements are from company releases, calls, and investor day remarks, as graded in DalalBytes earnings coverage. October single-name moves are from the DalalBytes monthly holdings audit of November 1, 2026, computed from Finnhub daily closes. Errors can occur and facts change; verify independently before acting on anything you read.
No advisory relationship. Reading this site does not create an advisor-client relationship of any kind. See the full disclosures page.