
What did Amazon actually report in Q3 2026?
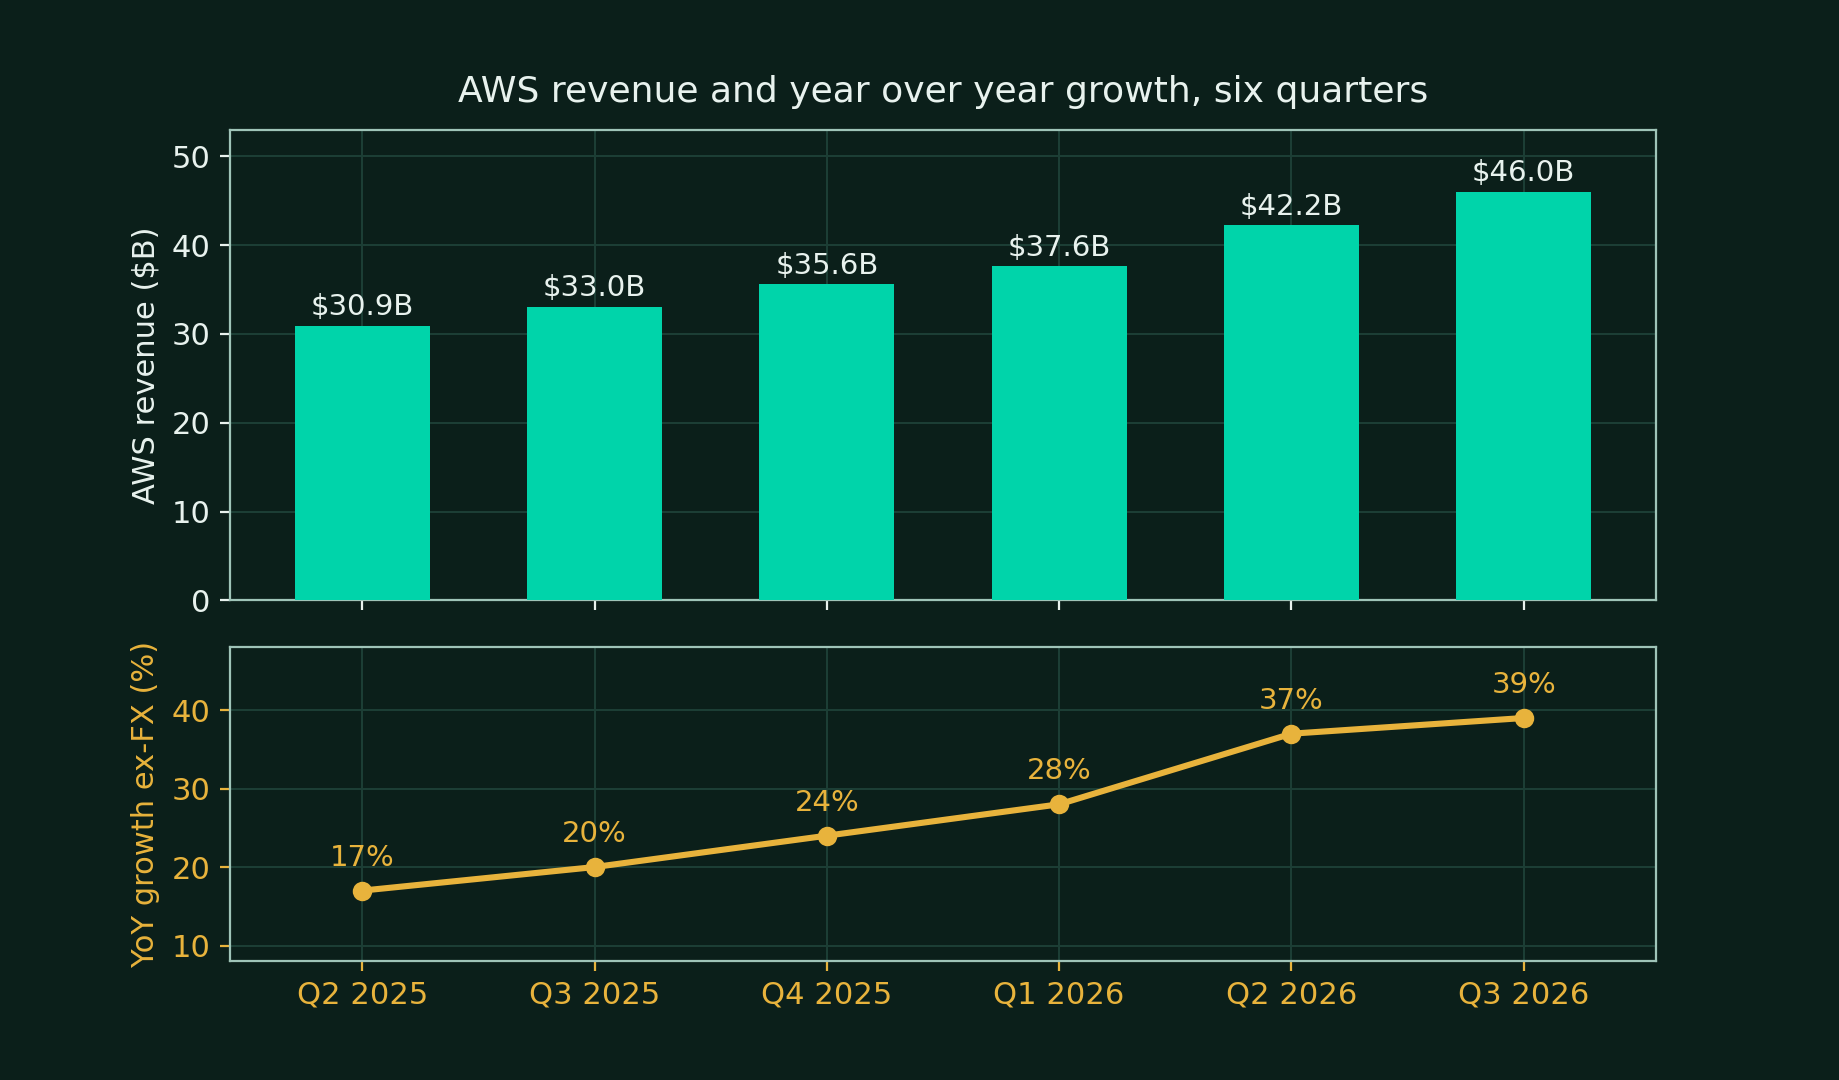
The verdict first. This was the strongest AWS quarter in years and the weakest cash quarter in Amazon's modern history, printed on the same page. AWS accelerated to 39.3% growth, backlog jumped to $578B, and management guided AWS growth above 40% for both 2027 and 2028. The cash flow statement answered with $75.9B of cash capex in a single quarter and a trailing twelve month free cash flow outflow of $42.4B. The market weighed both and sold the cash flow.
| Line | Q3 2026 actual | Benchmark | Read |
|---|---|---|---|
| Net sales | $201.94B, up 12% (up 13% ex-FX) | $202.11B Zacks, $202.31B LSEG; guide $197B to $202B | Narrow miss, at the guide top edge |
| Operating income | $28.08B, up 61% | $26.18B consensus; guide top $26.5B | Clear beat |
| Operating margin | 13.9%, a company record | About 12.9% expected | Beat |
| Diluted EPS | $1.89 | $1.96 LSEG, $2.01 Zacks | Miss |
| Net income | $20.69B, down from $21.19B | Prior year held a $9.5B pre-tax Anthropic gain | Comparison effect, not operations |
| AWS revenue | $45.98B, up 39.3% | $45.61B and 38.2% growth, LSEG | Beat |
| Advertising revenue | $19.64B, up 11% (up 12% ex-FX) | About $20.9B expected | Miss |
| Cash capex in the quarter | $75.9B | Gross purchases of $77.3B against about $58.7B expected, per CNBC | Far above plan pace |
Two framing facts matter before any judgment. Prime Day sat in Q2 2026 in most large countries and entirely in Q3 2025, and Amazon estimates the shift alone cost about 400 basis points of year over year sales growth. On a like for like calendar, revenue growth was nearer 17% than 13%. Second, the EPS decline is an accounting echo. Q3 2025 non-operating income held $9.5B of pre-tax gains on the Anthropic stake. Q3 2026 other income was a net expense of $703M, including a $653M loss on marketable equity securities. Operations improved sharply. The comparison line moved the other way.
There were no special charges inside the $28.1B of operating income. The named drags sit elsewhere. Interest expense rose to $1.7B in the quarter from $538M a year ago, the cost of the debt program detailed below. Headcount ended the quarter at 1,638,000, up 4% year over year, a seasonal build into the holiday quarter rather than a restructuring story.
How did the segments score?
| Segment | Sales | Growth | Operating income | Margin |
|---|---|---|---|---|
| North America | $112.85B | Up 6.2% | $8.72B, up 82% | 7.7% |
| International | $43.11B | Up 5.4%, up 8% ex-FX | $1.58B | 3.7% |
| AWS | $45.98B | Up 39.3% | $17.77B, up 55% | 38.7% |
AWS is now 23% of Amazon's sales and 63% of its operating income, at a $184B annualized run rate. North America margin of 7.7% is the retail engine funding its share of the build, helped by the regionalized fulfillment network and a twelfth straight quarter of faster delivery speeds. International remains thin at 3.7%, with management pointing to wage pressure in Europe and Japan.
The category table tells the softer story underneath. Online stores grew just 2% with the Prime Day shift against them. Third-party seller services grew 9%. Subscriptions grew 11% to $14.01B. Advertising is the one genuine disappointment in the print.
| Category | Q3 2026 | Reported growth | Note |
|---|---|---|---|
| Online stores | $68.47B | Up 2% | Prime Day sat in Q2 this year |
| Physical stores | $5.71B | Up 2% | Whole Foods and Amazon Fresh |
| Third-party seller services | $46.49B | Up 9% | Units from third-party sellers at 61% of mix |
| Subscription services | $14.01B | Up 11% | Beat the roughly $13.7B estimate |
| Advertising services | $19.64B | Up 11%, up 12% ex-FX | Down from 26% growth in Q2 2026 |
| Other | $1.65B | Up 16% | Health care and licensing among the lines |
Advertising decelerated from 26% growth in Q2 to 12% ex-FX in Q3. Management's explanation on the call was specific. The Prime Day shift alone cost about 850 basis points sequentially. A search engine marketing program change in Q3 2025 is now being lapped. And the fastest growing piece, sponsored products tied to shopping searches, slowed with the event calendar. Management guided advertising back to high teens growth in Q4, when the comparison gets clean. That guide is a promise the Q4 print will be graded against.
What did the call actually say?
The call was unusually concrete on AWS and unusually vague on money. Score it in two halves.
Real answers. Justin Post of Bank of America asked whether the acceleration was large deals landing at once. Jassy answered with the capacity cadence. Chunks of capacity are reserved in advance, some for 2027, 2028, and even 2029, and the company has visibility eight to ten quarters out. AWS is installing an AI accelerator about every 14 seconds, and customers absorb capacity almost as fast as it lands. Backlog reached $578B, up from $496B in Q2, and grew at a triple digit rate year over year.
Brian Nowak of Morgan Stanley asked for the trillion dollar math, and got it. Jassy guided AWS growth above 40% in both 2027 and 2028, called a trillion dollar revenue business plausible in five to ten years, and said inference is already well over half of AWS AI revenue, with Bedrock capable of becoming as large as EC2 over time. Bedrock token volume grew nearly 17 times year over year.
Eric Sheridan of Goldman Sachs asked about selling Trainium externally, and got the most candid trade-off of the night. External chip sales recognize revenue faster. Internal cloud use produces more absolute revenue and more free cash flow over a five to six year chip life. Amazon will do some external selling from late 2027 and keep most capacity internal. Graviton and Trainium revenue commitments each grew more than 20 times year over year, and customers saved over $2B in the quarter running on Amazon's own silicon.
Ross Sandler of Barclays asked why AWS margins hold up better than neocloud margins. Jassy's answer was structural. Amazon owns or long leases its data centers, negotiates power and land directly, and designs the full stack. A neocloud running the same AI workload in a third-party colocation facility runs at an operating margin roughly 35 percentage points worse, by his estimate. Most of the large AI training and inference workloads on Bedrock already run on Trainium rather than rented GPUs.
Deflections. Mark Mahaney of Evercore asked for AWS margin guidance and did not get it. Olsavsky cited mix shift toward lower margin AI services and component pricing, and stopped there. Doug Anmuth of JPMorgan asked what level of capex the AI opportunity requires, and got the once in a lifetime framing with no figure attached. Break-even timelines on new capacity are, in Jassy's words, moving left, also with no figure attached. The financial guide for 2027 capex remains a single phrase, meaningfully more, repeated from the release into the call.
The dog that did not bark. Anthropic's equity stake was never discussed. Anthropic appeared only as a product partner, with Claude Code integrated into the AWS Continuum security service and Anthropic models sold through Bedrock. No analyst asked about the $238.7B carrying value detailed below, and management did not volunteer it. Advertising got a direct question on agentic shopping, and Jassy's answer was equally direct. Asked whether AI shopping agents are affecting the ads business, he said the answer is no, because agents are not yet driving meaningful shopping volume. Alexa for Shopping reached over 400M customers in twelve months with interactions up 570% year over year, and shoppers using it spend about 50% more per order.
What does the capex and cash picture look like?
Operating cash flow is not the problem. It grew 29% on a trailing basis to $168.3B, and the quarter alone produced $42.4B. The problem is the other side of the ledger. Cash capex was $75.9B in Q3 2026 against $34.2B a year earlier. Gross purchases of property and equipment were $77.3B. Quarterly free cash flow, calculated as operating cash flow less net property and equipment purchases, printed near negative $33.5B. The trailing twelve month outflow reached $42.4B, against an inflow of $14.8B a year ago.
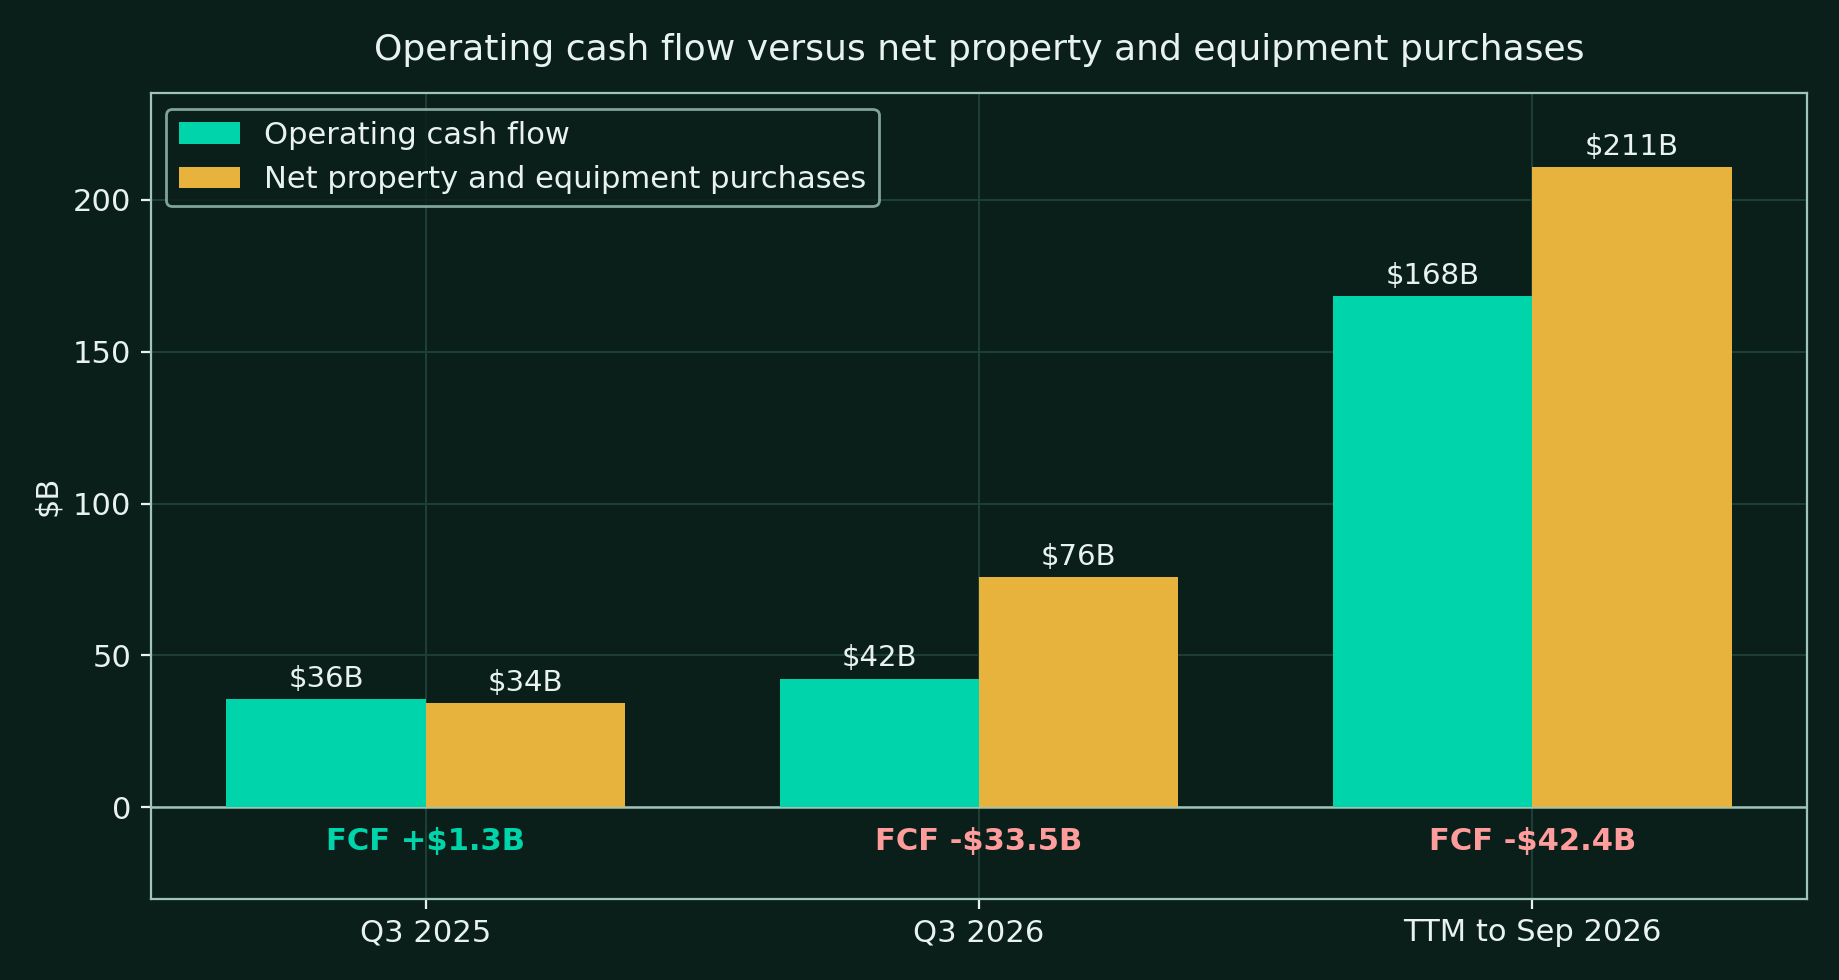
The build is now debt funded at the margin. Long-term debt reached $173.1B at September 30, up from $65.6B at the end of 2025. Amazon raised $53.4B of debt proceeds in Q3 alone and $135.8B across the first nine months of 2026. Cash and marketable securities total $114.2B, so the balance sheet has moved from a large net cash position to roughly $59B of net debt in nine months. None of this threatens solvency at Amazon's scale. All of it changes what the equity is. The stock now carries a leveraged infrastructure build whose payoff management dates to 2027 and 2028 growth rates.
Guidance did not move. Full year 2026 cash capex stays at approximately $220B. For 2027, the 10-Q repeats the call language. Spending will be meaningfully more, with no number attached. One more guide detail deserves attention. Amazon Leo, the satellite business renamed from Kuiper, begins initial service this year, but its costs keep running through operating expense in Q4 because capitalization starts in Q1 2027, later than the CFO had previously expected. That timing choice is one reason the Q4 operating income guide of $28.5B to $33.5B sits wide.
What happened to the Anthropic stake this quarter?
Two days ago this site published the carrying math on Amazon's Anthropic position, in Amazon Owns a Fifth of Anthropic. Its Share Price Does Not Care. The Q3 2026 10-Q, filed October 30, updates that math, and the update cuts against the original framing in an interesting way. The stake grew by about $48B in one quarter. It added nothing to earnings.
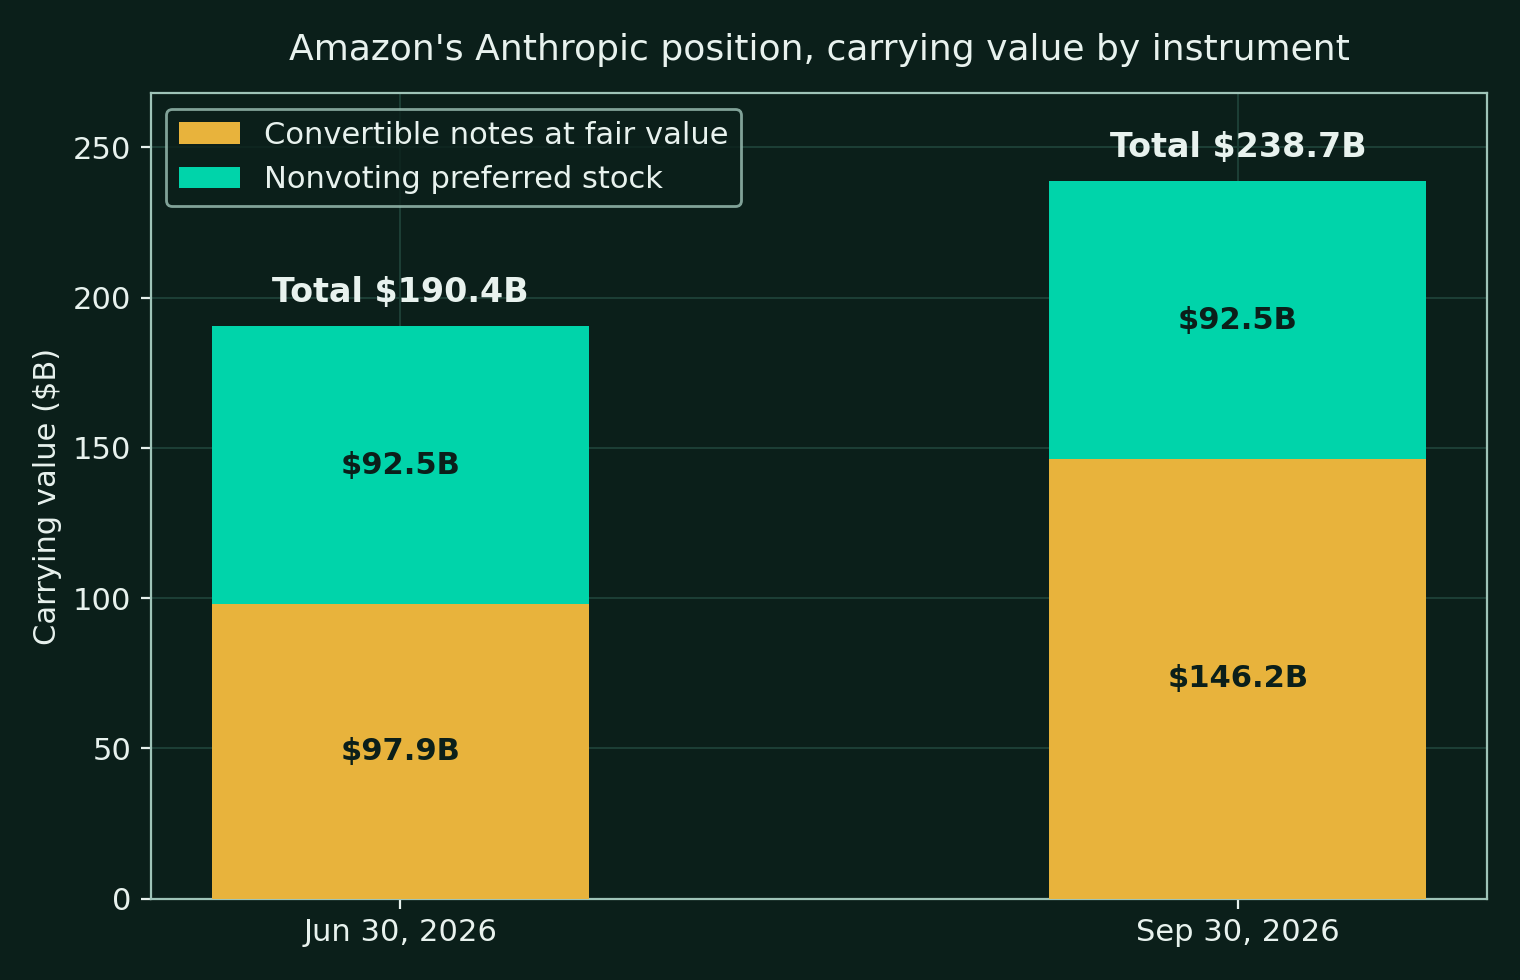
| Instrument | Jun 30, 2026 | Sep 30, 2026 | Change |
|---|---|---|---|
| Convertible notes, at fair value | $97.9B | $146.2B | Up $48.3B |
| Nonvoting preferred stock | $92.5B | $92.5B | Unchanged |
| Total carrying value | $190.4B | $238.7B | Up $48.3B |
| Per Amazon share, on 10.797B basic shares | $17.66 | $22.11 | Up $4.45 |
The mechanics matter. The preferred stock carrying value did not move. The entire increase sits in the convertible notes, and it ran through accumulated other comprehensive income, where the unrealized gain on the Anthropic securities reached $140.3B at September 30. Almost none of it touched the income statement. Upward adjustments on private company investments were just $39M in the quarter. That is why Q3 EPS could miss while the balance sheet quietly added $48B. Under the accounting Amazon applies to these notes, the gain is real, marked, and parked outside earnings until conversion or a liquidity event.
The 10-Q also discloses the second mega bet running in parallel. Amazon invested $50.0B in OpenAI Series C Preferred Stock during the first nine months of 2026, $21.3B of it in Q3, and has committed up to $35.0B more on contingent terms. Combined with the $18B of cash into Anthropic, Amazon has now committed roughly $103B of cash and commitments to two AI labs. Anthropic's IPO remains the unlock for the larger position. Its S-1 is public, press reports have targeted pricing in November, and Amazon's notes and preferred convert into common stock at the IPO, subject to the 12% ownership cap and an expected lock-up.
How does Amazon stack up against the other hyperscalers?
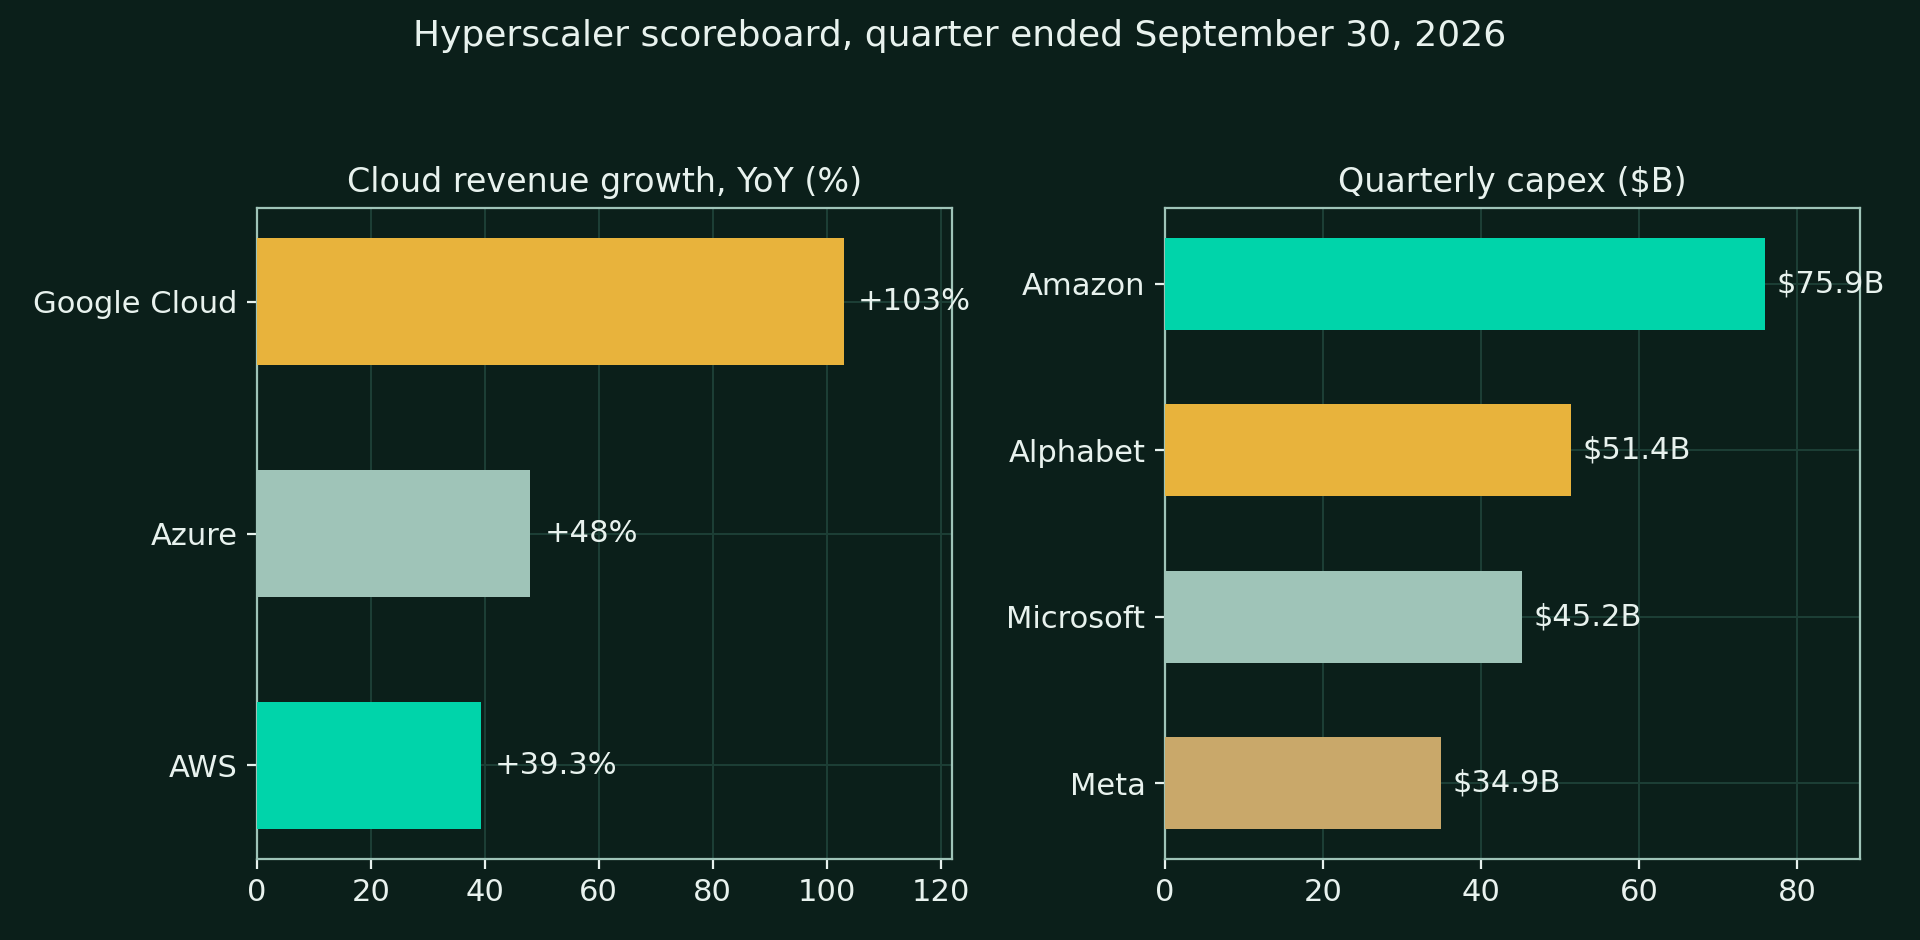
All four hyperscalers have now reported the September quarter, and the pattern rhymes with variations. Cloud growth is extraordinary everywhere. Cash flow is negative at three of the four. Microsoft is the exception, and its exception has a specific cause. Some third-party capacity deliveries were delayed, which cut its quarterly capex below forecast and kept its free cash flow positive.
| Company | Cloud growth | Backlog | Quarterly capex | Quarterly FCF | FY2026 capex guide |
|---|---|---|---|---|---|
| Amazon, AWS | Up 39.3% to $46B | $578B | $75.9B cash capex | Near negative $33.5B, calculated | About $220B, held |
| Alphabet, Google Cloud | Up 103% to $30.7B | $561B | $51.4B | Negative $9.1B | $195B to $205B, held |
| Microsoft, Azure | Up 48% to $33.2B | $677B commercial RPO | $45.2B including leases | Positive $18.6B | About $170B for calendar 2026 |
| Meta | No cloud segment | Not disclosed | $34.9B including leases | Negative $2.1B | $135B to $145B, floor raised |
Read the table with the definitions attached. Microsoft's quarter is its fiscal Q1 2027, also ended September 30, 2026, and Azure revenue was disclosed in dollars for the first time this quarter, per Microsoft's release coverage. Backlog definitions differ by company and are not directly comparable. The honest summary is this. Google Cloud is growing fastest off a smaller base. Azure is growing faster than AWS at a similar scale and still converts to positive cash flow, helped by a delivery delay. AWS remains the largest cloud in absolute dollars, holds the highest cloud operating margin of the three at 38.7%, and spends the most to defend the position.
Thesis checkpoint: the AWS gates passed, the cash gates failed
The pre-print scorecard, refreshed October 26, set six gates. The print split them cleanly down the middle of the business.
| Gate | Pass line | Evidence | Grade |
|---|---|---|---|
| 1. Revenue and operating income vs guide | Revenue at or above $202B with operating income at or above about $26B | Revenue $201.94B, a hair under the line. Operating income $28.08B, well over it | MIXED |
| 2. AWS growth | 33% or better | 39.3% reported, the sixth straight quarter of acceleration | PASS |
| 3. AWS margin | 37% or better | 38.7%, down from 39.4% in Q2 and up from 34.6% a year ago | PASS |
| 4. Capex watch | $220B held with no second raise | Guide held at about $220B. Quarterly cash capex of $75.9B still ran far above the roughly $58.7B analysts expected for the quarter | PASS |
| 5. Free cash flow trajectory | Outflow narrowing, not widening | TTM outflow widened from about $7.6B at Q2 to $42.4B. The quarter alone was near negative $33.5B | FAIL |
| 6. Q4 guide and advertising | A clean guide and ads at 20% or better | Q4 guide brackets consensus with the midpoint light. Ads grew 12% ex-FX, with a guided return to high teens in Q4 | FAIL |
Three passes, one mixed, two fails. The scorecard's framing question was whether AWS growth and backlog conversion would justify roughly $220B of capex. On growth and backlog, the answer this quarter is yes, with the $578B backlog and the above 40% guide for 2027 and 2028 as the evidence. On cash, the answer is not yet, and the gap widened instead of narrowing.
What did the stock do?
The stock was sold before the print and sold harder after it, then spent Friday morning arguing with itself.
| Moment | Price | Move | Source |
|---|---|---|---|
| Close, Tue Oct 27 | $253.10 | Pre-article reference, market cap about $2.73T | DalalBytes, October 28 |
| Close, Wed Oct 28 | $254.60 | Going into the print | Market coverage, October 30 |
| Close, Thu Oct 29 | $243.79 | Down 4.25% in the regular session, before the release | Benzinga data via INDmoney |
| After hours, Thu Oct 29 | Near $226 | Down about 7% from the close | INDmoney and TradingKey |
| Premarket, Fri Oct 30 | About $226 | About 11% below the Wednesday close | TradingKey |
| Intraday, Fri Oct 30 | $241.29 late morning | Down about 1% on the day after recovering from a $229.36 low | Finnhub quote, October 30 |
The recovery matters for reading the tape. The after-hours verdict priced a cash flow disaster. The Friday session, with the full release and call digested, priced something closer to a very expensive growth story. At $241.29 the market cap is roughly $2.6T. The Anthropic position alone carries at about $22 per share of that price, before any IPO markup. Whether the stock follows the AWS line or the cash flow line from here depends on which one moves first in Q4. The gates above say what to watch.
Which risks are real after today, and what would change the view?
The core tension. Management is asking shareholders to fund the largest build in the company's history on the strength of growth rates two years forward, while declining to put a number on next year's spending or on AWS margins. The demand evidence this quarter was genuinely strong. The ask is still an act of trust, and trust is what the after-hours tape repriced.
2027 capex is unquantified. Meaningfully more than $220B, at a company already running a $42.4B trailing cash outflow, with long-term debt up nearly three times in nine months. Interest expense has already tripled year over year. Every quarter without a number extends the period in which the cash flow gate cannot pass.
AWS margin mix is a real headwind. Management conceded that AI services carry lower margins than core cloud and declined to guide the segment margin. It held at 38.7% this quarter. If mix shift accelerates faster than core efficiency, the margin gate gets harder from here, not easier.
Advertising has one quarter to prove the timing story. The 850 basis point Prime Day explanation is checkable, and Q4 has a clean comparison. A second quarter in the low teens would turn a timing story into a share story, with agentic shopping waiting as the obvious suspect even though management dismissed it on this call.
What would change the view. A quantified 2027 capex figure with any free cash flow inflection language on the Q4 call would repair the largest damage. AWS margins holding at or above 38% while growth stays above 40% would do the same. On the other side, an Anthropic IPO priced anywhere near the reported $1.5T to $2T range would force the carrying value conversation into the open, because the notes and preferred convert at that print. The position is already $22.11 per share at carrying value. The market is currently paying no visible premium for it.
Frequently asked questions
Did Amazon beat or miss in Q3 2026?
Both, on different lines. Operating income of $28.1B beat the $26.5B guidance top and the $26.18B consensus, and AWS beat on revenue and growth. Headline revenue of $201.9B and EPS of $1.89 both landed just under consensus, and advertising missed outright at $19.6B.
Why did Amazon stock fall when AWS grew 39%?
Because the cash flow statement overruled the income statement. Quarterly capex hit $75.9B of cash spending, quarterly free cash flow printed near negative $33.5B, and the trailing twelve month figure fell to negative $42.4B. Management then guided 2027 capex higher without a number, and the Q4 revenue midpoint landed under consensus.
What is Amazon's Anthropic stake carried at now?
The Q3 2026 10-Q carries the position at $238.7B at September 30, 2026, up from $190.4B at June 30. The convertible notes account for $146.2B of it and the nonvoting preferred stock for $92.5B. The entire $48.3B quarterly increase ran through other comprehensive income, not earnings.
Disclosures
Not financial advice. This article is published for educational purposes only. Nothing here is a recommendation to buy, sell, or hold any security, and nothing here is financial advice. Investing involves risk, including the possible loss of principal.
Positions. The author holds long positions in Amazon, Alphabet, and Meta, all discussed in this article. The author holds no position in Microsoft.
Accuracy. This analysis is built from public sources believed to be reliable, including Amazon's Q3 2026 earnings release (Form 8-K Exhibit 99.1), Amazon's Q3 2026 Form 10-Q filed October 30, 2026, consensus estimates as published by Zacks and by LSEG via CNBC and Reuters, Microsoft fiscal Q1 2027 figures from its release coverage, and market data from Finnhub, Benzinga, and TradingKey. The earnings call account is built from a full transcript taken from the captions of a complete call recording published on YouTube, and management remarks were cross-checked against the release where figures overlap. Calculated figures, including quarterly free cash flow and the Anthropic total carrying value, are labeled as calculated where they appear. Errors can occur and facts change; verify independently before acting on anything you read.
No advisory relationship. Reading this site does not create an advisor-client relationship of any kind. See the full disclosures page.