What actually happened in Q3 2026?
Tesla's energy generation and storage segment printed a combination that should not exist at the height of an AI power boom: more product shipped, less money taken in. Deployments rose 10% year over year to 13.7 GWh, yet revenue fell 16% to $2,881M and missed consensus, and deployments themselves missed the roughly 15.9 GWh company-compiled consensus. Over the first nine months of 2026 the pattern holds: revenue of $8,428M is down 6% year over year on 36.0 GWh deployed, up 11%. This is not a demand quarter gone wrong. It is a price quarter, and it has been building for three years.
| Fiscal year | Revenue | Gross profit | Gross margin | Storage deployed |
|---|---|---|---|---|
| FY2022 | $3,909M | $288M | 7.4% | 6.5 GWh |
| FY2023 | $6,035M | $1,141M | 18.9% | 14.7 GWh |
| FY2024 | $10,086M | $2,640M | 26.2% | 31.4 GWh |
| FY2025 | $12,771M | $3,802M | 29.8% | 46.7 GWh |
The annual arc is a business that industrialized beautifully: revenue up 3.3x in three years, gross margin from 7.4% to 29.8%. The quarterly arc is where the story turns. Read the last seven quarters carefully, because the margin line is noisy in a way that matters later.
| Quarter | Revenue | Gross margin | Storage deployed |
|---|---|---|---|
| Q1 2025 | $2,730M | 28.8% | 10.4 GWh |
| Q2 2025 | $2,789M | 30.3% | 9.6 GWh |
| Q3 2025 | $3,415M | 31.4% | 12.5 GWh |
| Q4 2025 | $3,837M | 28.6% | 14.2 GWh |
| Q1 2026 | $2,408M | 39.5% | 8.8 GWh |
| Q2 2026 | $3,139M | 20.4% | 13.5 GWh |
| Q3 2026 | $2,881M | 33.1% | 13.7 GWh |
Three of those margin prints carry one-off cargo. Q1 2026's 39.5% included over $250M of tariff-related recognitions. Q2 2026's 20.4% absorbed a vendor-cell warranty true-up reported at about $240M. Q3 2026's 33.1% was flattered, on management's own call commentary, by tariff refunds and vendor warranty true-downs, in amounts Tesla did not quantify. The clean series underneath is a gross margin somewhere in the 20s, a segment gross profit that fell year over year in Q3 despite the flattering items, and gross profit per GWh down from $86 in Q3 2025 to $70 in Q3 2026 (calculated). The segment sits inside the wider Tesla picture covered in our Tesla investment report; this article isolates the energy question a reader put to us directly: where did the money go?
Where did the money go?
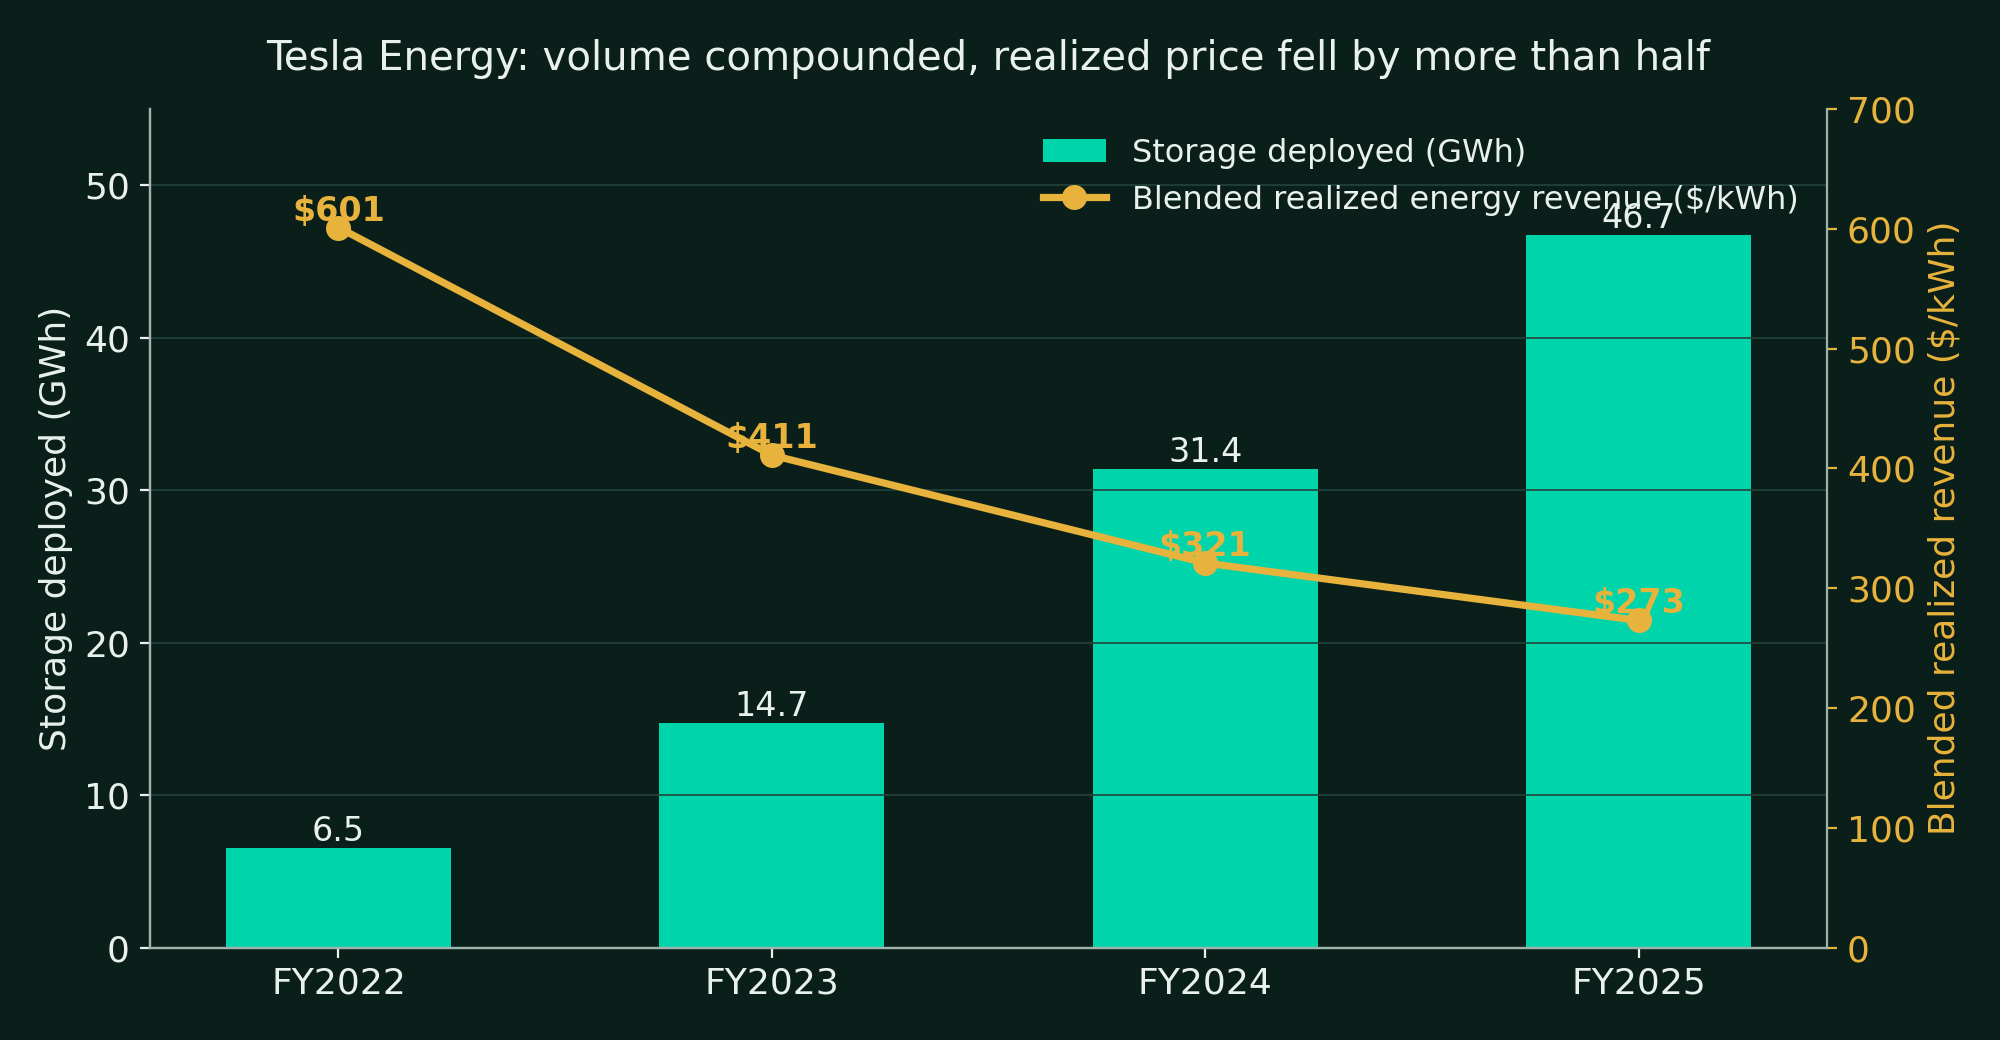
Divide segment revenue by deployments and you get a blended realized revenue per kWh. It is a calculated figure, and it needs its caveat up front, in the same breath: the numerator is the whole segment's revenue (Megapack, Powerwall, and a shrinking solar business), while the denominator is battery deployments only, so this is a blended realization measure, not a Megapack price. The solar distortion is small and shrinking: Tesla last disclosed solar deployments at 223 MW in FY2023 and has now gone 11 straight updates without disclosing them; solar was plausibly 10-15% of segment revenue in FY2024-25 (estimated) and is likely less now. With that said, the series is the single most informative number in this article.
| Period | Blended realized revenue per kWh (calculated) |
|---|---|
| FY2022 | $601 (solar-heavy mix; not comparable as a storage price) |
| FY2023 | $411 |
| FY2024 | $321 |
| FY2025 | $273 |
| Q3 2025 | $273 |
| Q1 2026 | $274 |
| Q2 2026 | $233 |
| Q3 2026 | $210, down 23% YoY |
Tesla's own published list prices tell the same story with the company's name on it. The Megapack's single-unit project price peaked at about $622/kWh in September 2022. The clean like-for-like comparison, tracked by pv magazine, runs from $482/kWh in April 2023 ($1,879,840 for a 3.9 MWh unit, hardware only) to $266/kWh in July 2024 ($1,039,290 for the same unit): down 44% in 14 months. An October 2023 CPUC filing shows a 102-pack installed California quote at $338/kWh. And then the trail stops: no verified Tesla list price exists for 2025 or 2026, because Tesla stopped publishing one where researchers can find it. We print that as a stated gap rather than filling it. What fills the gap instead is the realized series above, and it kept falling through 2026.
So the Q3 answer is mechanical. Deployments up 10%, realized revenue per kWh down 23%, revenue down 16%. Nothing about that requires weak demand. It requires a seller whose price is being set by a falling market, which is the subject of the next three sections.
How fast is the market growing, and what is Tesla's real share?
Start with a warning: nobody agrees how big this market is, and every share claim in this industry smuggles in a denominator. On BloombergNEF's installations count, the global market was 97 GWh in 2023, about 170 GWh in 2024, and about 257 GWh in 2025. Benchmark Mineral Intelligence counts about 315 GWh of 2025 installations and about 460 GWh of 2025 shipments; InfoLink counts 375 GWh of shipments. That is a near 2x spread between the most conservative and the most generous yardstick for the same year, which is why the conflicts section of this article exists.
Here is the sentence that survives every denominator. Tesla's deployments grew 49% in 2025. The market, on BNEF actuals, grew about 48% in GW terms, and on most counts somewhere in the 48-51% range. Tesla grew at the market rate in 2025, after years of growing far above it. On BNEF installations, Tesla's share was about 18% in both 2024 and 2025: flat. On Benchmark shipments, Tesla's 46.7 GWh is about 10%. Both can be true; they measure different things. What neither shows is a share gain, in the fastest-growing large hardware market in the world, from the company that effectively created the category.
That distinction matters for how you read the Q3 print. A company growing at market rate in a deflating market will post exactly what Tesla posted: rising volume, falling revenue per unit, revenue roughly flat to down in any quarter where mix or timing slips. The growth-rate privilege is gone. The remaining questions are who holds the share Tesla no longer gains, and whether Tesla's cost falls as fast as the market's price.
Who is winning the storage business?
Ask three research houses who leads this industry and you get three answers. The table below is the honest version of the league standings, with the methodology attached, because the methodology is doing most of the arguing.
| Scoreboard | No. 1 | Tesla's place | What to know |
|---|---|---|---|
| Benchmark, 2025 shipments | BYD, over 60 GWh (13%) | No. 2, 46.7 GWh (10%) | Sungrow No. 3 at about 43 GWh (9%); CRRC, CATL, and Hyper Strong about 6% each; eight of the top ten are Chinese |
| Wood Mackenzie, 2025 market share (published July 2026) | Tesla | No. 1, third straight year | Sungrow No. 2, BYD No. 3 (up five places); top-three combined share fell from 36% in 2024 to 30% in 2025; Chinese-headquartered firms took 76% of the global market |
| InfoLink, FY2025 all-system shipments | Tesla | No. 1 | Flattered by Powerwall residential volume; InfoLink's own utility-scale table puts Sungrow No. 1, with BYD passing Tesla in Q3 2025; its AC-side table has had Sungrow ahead since Q3 2024 |
| Wood Mackenzie, vendor capability ranking (qualitative, same month) | Sungrow | No. 2 | A capability assessment, not a share count, and routinely mis-cited as one |
The regional split is the part every methodology agrees on. Tesla leads North America, with a 39% share in 2024 and the lead retained in 2025. Europe's 2025 podium is entirely Chinese: Sungrow, BYD, Huawei. CRRC leads APAC. Tesla's crown, where it still wears one, is regional.
BYD shipped over 60 GWh in 2025 on Benchmark's count and is converting scale into flagship wins. It launched the 14.5 MWh HaoHan system in September 2025, delivered a 12.5 GWh project for Saudi Electricity (grid tests completed in May 2026), and took the larger share of the Masdar Abu Dhabi 19 GWh round-the-clock scheme: Sungrow won phase one at 7.5 GWh, BYD took the remaining 11.275 GWh, and Western bidders were shut out entirely. Indicative 2026 delivered pricing (estimated, from a single trade source) puts BYD's MC Cube Pro at $130-160/kWh against $155-200/kWh for Tesla's Megapack 3. If those ranges are even roughly right, BYD is landing systems at prices near Tesla's realized average across all products.
Sungrow shipped about 43 GWh in 2025, storage became its largest segment at 42% of revenue, and it leads Europe. Its home-market pricing shows where the floor is set: in a September 2026 China tender, Sungrow bid 0.5111 RMB per Wh, right at a market average of about $70-75/kWh for winning bids (SMM data; an October 2026 CNNC procurement cleared at 0.4995-0.5329 RMB per Wh). A turnkey system in China now changes hands for roughly what a bare pack cost in the US two years ago.
CATL attacks from underneath. It is the No. 1 BESS cell supplier at about 20% share, all top-ten cell suppliers are Chinese with over 90% of the market between them, and SNE Research credits CATL with supplying 38.8% of the cells that went into North America's energy storage market in H1 2026: even Tesla's defended home market runs substantially on Chinese cells. CATL is also moving downstream, announcing 5.4 GWh of TENER system deals in a single May 2026 wave and a 60 GWh sodium-ion framework with HyperStrong.
Huawei holds about 5% of Benchmark shipments, sits No. 3 in Europe, co-leads residential storage with Tesla, and is excluded from the US utility market. Fluence, the Western pure-play, is the mirror image of Tesla's quarter: its backlog hit a record $5.6B in May 2026 and then $6.4B in August (up 30% year over year), it signed two hyperscaler master supply agreements and over $850M of data-center awards, yet it cut FY2026 revenue guidance twice in five weeks, to $2.9-3.1B and then to about $2.4B, on late US factory ramps, with a reported negative $200M adjusted EBITDA guide (single-sourced) and a securities lawsuit attached. And the cautionary tale: Powin, North America's No. 3 in 2024, went bankrupt in 2025 and was acquired by FlexGen, while NextEra entered the regional top three. Winning orders in this market and making money on them are now visibly different skills.
How much of this is cost deflation, and how much is Tesla losing?
This is the analytical core of the article, so let us be careful. BloombergNEF's numbers describe a cost curve in freefall. Stationary storage pack prices fell 45% in 2025, to $70/kWh, from about $127. The global average battery pack price across uses was $108/kWh in 2025 against $139 in 2023; LFP packs averaged $81; packs in China averaged $84 against $121 in North America. Turnkey system prices fell 31% globally in 2025, to $117/kWh, with China at $73, Europe at $177, and the United States at $219, down only 7%. Behind it all sits capacity: Chinese cell manufacturing capacity passed 2 TWh in 2024, roughly 60% above China's domestic demand, which means the marginal Chinese cell is priced by an industry that has to export or idle.
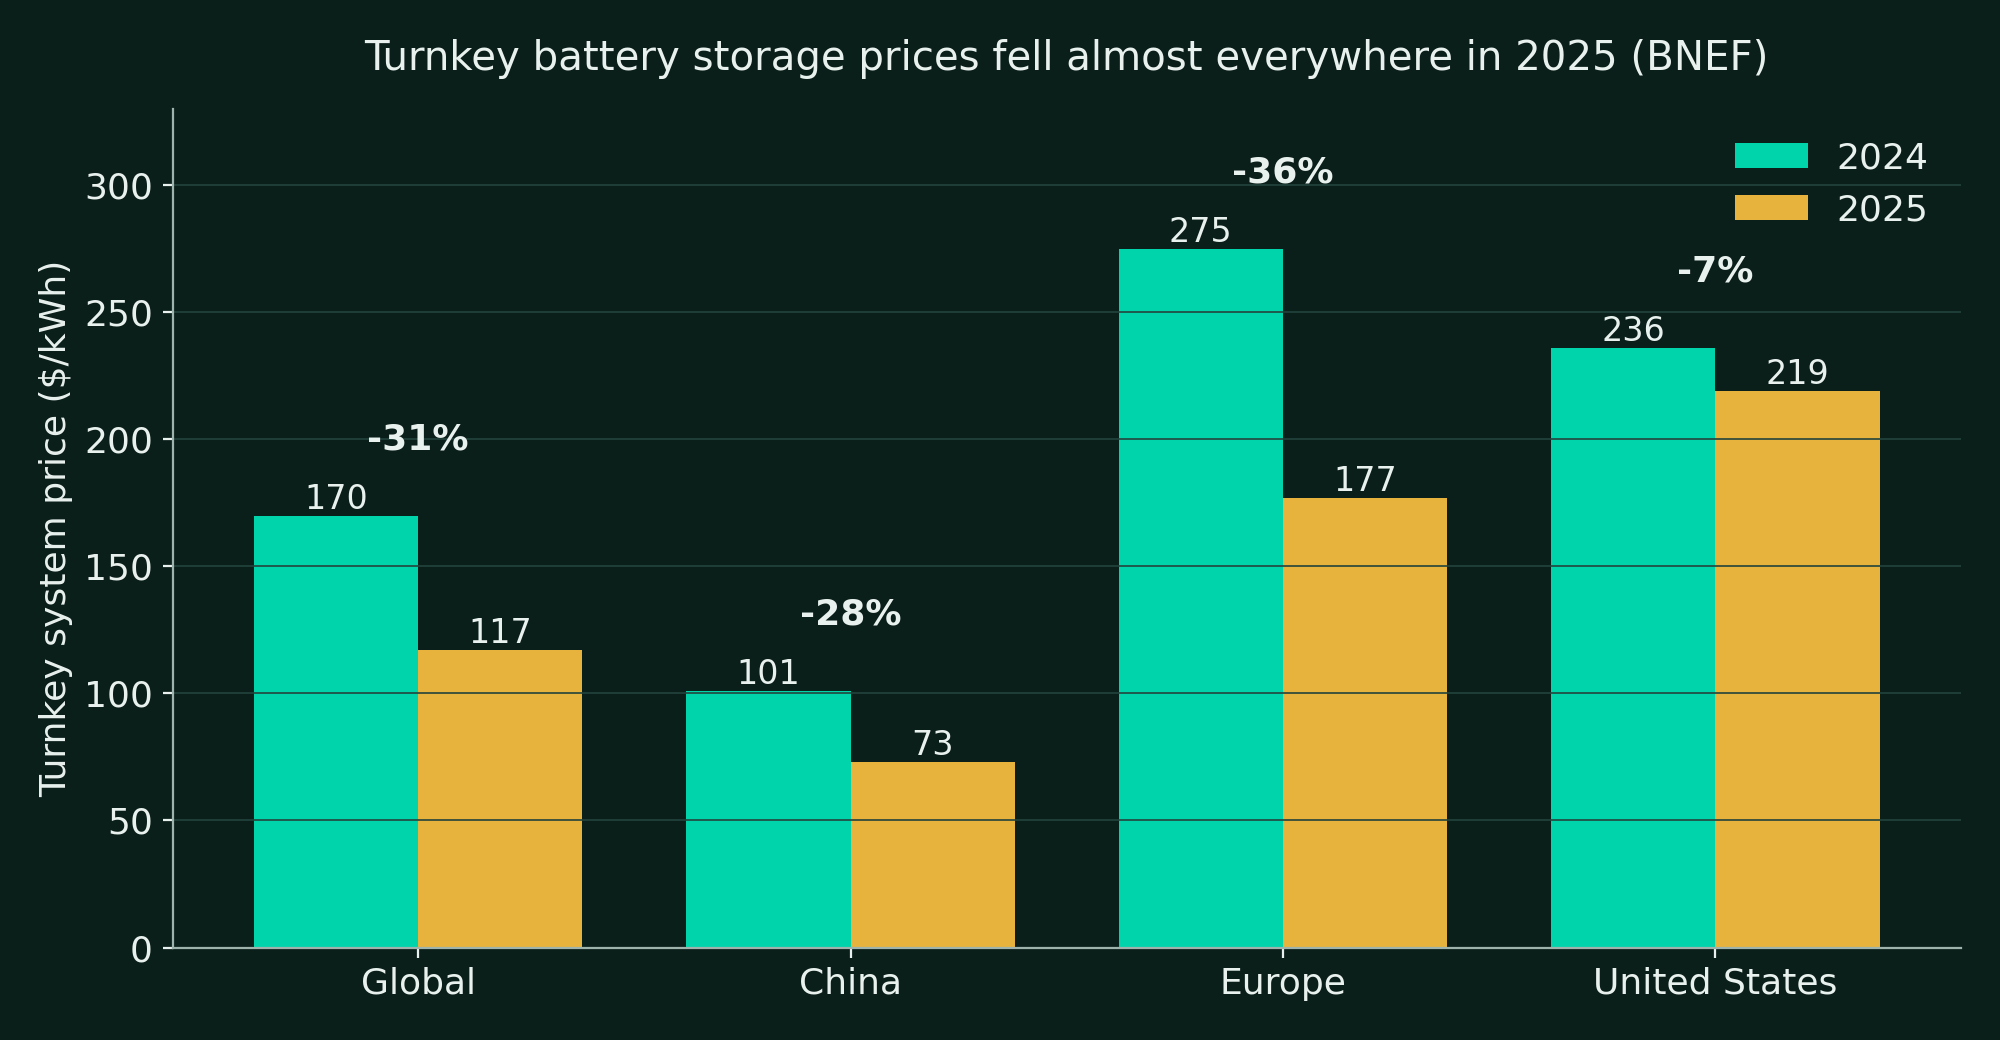
The pass-through verdict. Tesla's realized revenue per kWh fell 15% in FY2025 and 23% year over year in Q3 2026. Both declines are smaller than the market's cost deflation over the comparable window (packs down 45%, turnkey systems down 31% in 2025). That gap is why segment gross margin has held around 30%, noisily, instead of collapsing. What Tesla is experiencing so far is input pass-through with partial retention: it cuts prices because its inputs got cheaper, keeps a slice, and hands the rest to buyers. That is not below-cost desperation, and it is not share panic. It is what a deflating hardware market does to every participant, including the leader.
The risk is the forward slope, and management has already drawn it. Tesla guides long-run energy gross margin to normalize in the low-to-mid 20s, down from the noisy 30% area of the last two years. If system prices keep falling at anything like the 2025 rate while Tesla's US-centered cost base falls more slowly, pass-through quietly becomes compression: each year the company must run faster on volume to stand still on revenue, at thinner margins. At a realized $210/kWh and falling, deployments need to compound at roughly 25% a year just to keep segment revenue growing at all. In 2025 Tesla managed 49%. In the first nine months of 2026, it managed 11%.
Where does Tesla's premium still hold?
In exactly one region, and it holds there because policy built a wall and Tesla learned to manufacture behind it. In North America, the Section 301 tariff on Chinese non-EV batteries rose to 25% on January 1, 2026; the stacked effective rate on Chinese packs was reported at about 40.9% by July 2026 (single-sourced on the stack detail). Federal domestic content thresholds require 55% in 2026, rising to 75%, with foreign-entity-of-concern restrictions on top (the OBBBA framework). Chinese turnkey deflation mostly stops at that wall, which is why the US turnkey price fell only 7% in 2025 while Europe's fell 36%.
Tesla has been repositioning its supply chain behind the wall. The first Megapacks built solely with Tesla's own Nevada-made LFP cells shipped in Q3 2026, off a 7 GWh cell line that is still in early ramp. It signed a $4.3B LGES supply deal for LFP cells for the Megapack 3, running from August 2027 (reported by Electrek). Wood Mackenzie's moat assessment credits Autobidder, Tesla's trading and controls software, and plain bankability: utilities and lenders treat Tesla as a counterparty that will exist in 20 years, which Powin's customers learned to value the hard way. And the demand visibility is disclosed, not just claimed: Tesla's Q1 2026 10-Q showed an energy revenue backlog of $10.15B, with $5.02B of it due within 12 months.
The capacity picture cuts both ways, so read the denominator twice. Nameplate capacity is about 110 GWh (Lathrop 40, Shanghai 20 on current decks, Texas 50), and Megapack 3 production began in August 2026. Trailing-twelve-month deployments of 50.2 GWh are about 46% of that nameplate (calculated), which sounds like slack. Against the roughly 60 GWh that was actually in production for most of that window, utilization was about 84%: the Texas factory is the swing capacity, and the 110 GWh figure is a plan, not a present fact. Shanghai, meanwhile, produced just over 2,000 Megapacks in 2025, about 7.8 GWh (calculated), shipped mostly to Europe and Australia: precisely the markets where Tesla holds no podium and Chinese pricing sets the terms. The premium is real, regional, and policy-made. Policy can be rewritten.
Is the AI storage boom real, and who is capturing it?
The demand side is not in doubt. The IEA projects data-center electricity consumption rising from 415 TWh in 2024 to about 950 TWh in 2030. The EIA expects a record 24 GW of US utility-scale battery additions in 2026, with Texas accounting for about 12.9 GW of it, tied directly to ERCOT data-center clusters. AI campuses need firming, frequency response, and backup, and batteries are the fastest firming asset that can be permitted and built. The boom is real.
Tesla's disclosed capture of it is one customer, and the customer is family. xAI is the only identified data-center Megapack buyer of scale, and it is a related party. Tesla's 10-K discloses $430M of storage products sold to xAI in FY2025, which is 3.4% of energy segment revenue (calculated). Electrek's tally adds a further $269M in 2026 (single-sourced). xAI's Colossus 1 site had 168 Megapacks installed as of May 2025. The Colossus 2 numbers, as the conflicts section details, cannot even be reconciled across reports. Beyond xAI, Tesla discloses no data-center-attributed GWh at all. On the Q3 2026 call, CFO Vaibhav Taneja said, "The business is witnessing extreme demand from data centers," and predicted "improvements in ASP" from it. Both may prove true. Neither is yet a disclosed number.
The third-party AI storage order book, where it can be seen, is being written by others. Fluence holds two hyperscaler master supply agreements, a first $300M data-center developer deal, a further $550M of hyperscaler data-center awards from July 2026, and a data-center pipeline above 16 GWh. Canadian Solar's e-STORAGE signed a 2.5 GWh US data-center deal in March 2026. NextEra has a Kentucky data-center hub in development (single-sourced). And one discipline note before the narrative runs away: most headline AI power deals are generation and gas. Storage is the firming layer of the AI buildout, essential but rarely the headline asset, and the firming layer is exactly where a dozen hungry integrators compete on price.
What has management said, and what happened next?
Tesla's energy commentary has a consistent shape: the demand language is superlative, the deployment outcomes are strong but smaller, and the price language has quietly reversed over two years. The dated file:
| When | What management said | What happened |
|---|---|---|
| June 2024, shareholder meeting | Musk: storage deployments "tracking for 200-300% YoY growth," to about 40 GWh in 2024 | Actual: 31.4 GWh, up 114%. Strong growth, roughly half the guided rate |
| October 2024 | Musk: "It won't be long before we're shipping 100 GWh a year" | Two years later, trailing-twelve-month deployments are 50.2 GWh |
| January 2025 | Deck and Taneja: deployments to grow "at least 50%" in 2025; Musk called demand "insane," with Megapack and Powerwall "supply constrained" | Actual: +49%. A narrow, formal miss of a stated floor |
| July 2026, Taneja | "ASPs for industrial storage is coming down amidst growing competition"; first numeric margin guide: normalize "in the mid to low 20% range" | The most candid sentence management has offered on this segment, and it points down on both price and margin |
| October 2026, Taneja and Musk | Taneja: ASP will see "improvements" ahead. Musk: "almost sold out of all Megapacks for 2027," gross margins to "increase meaningfully" | Printed in the same quarter that realized blended revenue per kWh fell 23% year over year (calculated) |
The Q3 2026 disclosures added a new wrinkle: the update deck attributed part of the revenue decline to "tariff-related customer refunds," unquantified, while the call attributed the margin to tariff refunds and vendor warranty true-downs, also unquantified. Electrek's October 21, 2026 verdict on the pattern was blunt: Tesla "keeps describing them without quantifying them," noting margins of "39.5% in Q1, 20.4% in Q2, 33.1% in Q3" across 2026. GLJ Research's Gordon Johnson adds the bear's footnote: trailing deployment growth has "stalled." Both are commentators with positions, and both are describing real features of the print: the one-off items are doing visible work in every 2026 margin, and TTM deployment growth has decelerated from 49% to the low teens.
Where do the claims conflict?
This section exists because energy storage coverage is a hall of mirrors, and several things said about this quarter, including in early coverage of it, do not survive contact with the filings. Nine conflicts, claim against claim:
1. Who is No. 1? BYD, on Benchmark shipments. Tesla, on InfoLink all-system shipments and on Wood Mackenzie market share. Sungrow, on Wood Mackenzie's qualitative capability ranking and on InfoLink's utility-scale and AC-side tables. Methodology (shipments vs installations, whether residential Powerwall volume counts, AC-side scope) explains most of the disagreement, but the three crowns are real and mutually exclusive.
2. How big is the market? 2025 installations of about 257 GWh (BNEF) vs about 315 GWh (Benchmark); 2025 shipments of 375 GWh (InfoLink) vs about 460 GWh (Benchmark). A near 2x spread. Any share figure quoted without its denominator is marketing.
3. How big is Shanghai? Tesla's Q4 2025 update deck printed 40 GWh of Shanghai Megafactory capacity. Its Q1, Q2, and Q3 2026 decks print 20 GWh, with no explanation. The Shanghai municipal government's page implies about 40 GWh from unit counts. Every nameplate total in this article, including the 110 GWh, inherits that uncertainty.
4. Sold out, or missing? October 2026 management commentary claims the highest-ever order rate and backlog, with Megapacks "almost sold out" for 2027. The same quarter: deployments missed the roughly 15.9 GWh consensus, revenue fell 15.6% year over year (calculated), and gross profit fell year over year. A $10.15B disclosed backlog (Q1 2026) is genuine. So is the miss. Backlogs describe tomorrow; prints describe today; Tesla asks investors to weight tomorrow, and prices the stock accordingly.
5. Which way are ASPs going? Taneja, July 2026: ASPs are "coming down amidst growing competition." Taneja, October 2026: ASP will see "improvements" ahead. Realized blended revenue per kWh, down 23% year over year (calculated), currently agrees with July.
6. Which way are margins going? Musk, October 2026: gross margins to "increase meaningfully." Taneja, July 2026: margins normalize to the mid-to-low 20s. The Q3 print of 33.1% sits above both paths and was flattered by unquantified one-offs, which is precisely why it cannot settle the argument.
7. Are tariffs good or bad for Tesla Energy? Both, in sequence, in undisclosed amounts. Tariffs were a cost and compression risk through 2025. Then over $250M of tariff-related recognitions lifted Q1 2026 margin to 39.5%; the non-repeat dragged Q2; refunds flattered Q3's margin while tariff-related customer refunds cut Q3's revenue. Tesla discloses no cumulative tariff P&L for the segment, so the net effect across 2025-26 is unknowable from the filings.
8. The APAC mix claim, corrected. Some commentary attributed Q3 energy weakness to APAC mix. The call transcript ties APAC mix to automotive margin, specifically the ex-credits improvement from 16.3% to 18.1%, not to energy. The energy drivers management actually named were tariff-related customer refunds (revenue, per the deck) and tariff refunds plus vendor warranty true-downs (margin, per the call). Geographic mix may well matter, since Shanghai output ships mostly to Europe and Australia, but Tesla has not disclosed it as an energy driver, and this article does not print it as one.
9. How big is Colossus 2? Satellite imagery counted 720 Megapack containers in July 2026; other reports state 3.3 GWh (the container count implies about 2.8 GWh, calculated); reported deal values run from $269M to over $375M across sources (single-sourced at both ends). Tesla's largest disclosed AI storage relationship cannot currently be sized from public information, which is itself the finding.
So, is competition eating Tesla Energy?
Conclusion: yes, through the cost curve, not through demand
Competition is eating Tesla Energy, but it is eating the price, not the volume, and the distinction decides what kind of business this becomes. Demand is booming on every credible count. Tesla's problem is that in a deflating market, booming demand no longer belongs to whoever shows up with product. It belongs to whoever rides the cost curve down fastest, and that is currently a Chinese industry manufacturing about 60% more cells than its home market can absorb.
The arithmetic. Deployments up 10% and revenue down 16% in the same quarter means realized price fell about 23%. In a demand boom, that is a pricing verdict, not a volume verdict. No reading of Q3 2026 as a demand failure survives the segment's own deployment line.
The mechanism. Stationary pack prices fell 45% in 2025 and turnkey systems 31%. Tesla's realized decline is smaller than the deflation rate, and margins around 30% say pass-through with partial retention, so far. But the shelter is thinning on a schedule management itself published: long-run margins guided to the low-to-mid 20s.
The scarcity era is over. Tesla grows at market rate now, not above it. It lost the shipments crown to BYD, holds no podium in Europe, and was shut out of the Middle East's flagship 19 GWh round-the-clock scheme. Its remaining premium is regional and policy-made: the North American tariff wall, domestic content rules, its own Nevada cells, Autobidder, and bankability. Premiums granted by policy are durable exactly as long as the policy.
The AI capture is thinner than the narrative. On disclosed evidence, Tesla's AI storage business is one related party at 3.4% of segment revenue. The third-party AI order book belongs, for now, to Fluence, Canadian Solar, and the utilities. If Tesla is winning hyperscaler storage business at scale, it has chosen not to disclose a single attributed gigawatt-hour of it.
What this means for the Tesla story. Energy is becoming a good industrial business: real scale, genuine cost discipline, a defended home market, normalized margins guided to the low-to-mid 20s. It is not becoming a scarcity-rent second engine. At about $210/kWh realized and falling, volume must compound at 25% or better just to keep revenue growing, and a segment with that profile cannot carry a valuation narrative built on robotaxis and Optimus. It can fund it, modestly. That is a different, smaller claim, and it is the true one.
What to watch next. Q4 2026 deployments and the realized $/kWh they imply (does the October ASP-improvement claim survive the next print?). Energy gross margin excluding one-offs, against the low-to-mid-20s normalization guide. Megapack 3 and the Texas factory converting 110 GWh of nameplate into shipped product. Any data-center-attributed GWh disclosure or a named third-party hyperscaler deal. And the Shanghai capacity figure: whether Tesla's decks quietly stay at 20 GWh or explain the missing 20.
Research and opinion, not investment advice. Do your own due diligence before investing.
Frequently asked questions
Why did Tesla energy revenue fall if storage demand is booming?
Because price, not volume, did the damage. Tesla deployed 13.7 GWh in Q3 2026, up 10% year over year, but blended realized revenue fell to about $210 per kWh, down 23% (calculated). Stationary battery pack prices fell 45% in 2025 on BNEF data, and Tesla passed much of that deflation through.
Is Tesla still the largest battery storage company in the world?
It depends on the scoreboard. On Benchmark shipments, BYD is No. 1 with over 60 GWh and Tesla No. 2 at 46.7 GWh. On Wood Mackenzie market share and InfoLink all-system shipments, Tesla is still No. 1. Every methodology agrees Tesla leads North America and holds no podium in Europe.
What would change this conclusion?
Evidence that Tesla is keeping price, not just passing costs through. Watch realized revenue per kWh stabilizing while pack prices fall, third-party data-center storage deals with Tesla's name on them rather than one related party, and energy gross margin holding in the high 20s without one-off recognitions.
Disclosures
Not financial advice. This article is published for educational purposes only. Nothing here is a recommendation to buy, sell, or hold any security, and nothing here is financial advice. Investing involves risk, including the possible loss of principal.
Positions. The author holds no position in Tesla. Tesla is a tracked, not owned, name in the author's coverage universe. The full five-pillar treatment of the company is in the Tesla investment report published October 22, 2026 (58/100 Neutral). The author may hold positions in other securities mentioned here.
Accuracy. This analysis is built from public sources believed to be reliable, including company filings, earnings releases, earnings call transcripts, and third-party market research from BloombergNEF, Benchmark Mineral Intelligence, Wood Mackenzie, InfoLink, and SNE Research. Where sources conflict, the article says so rather than choosing silently. Errors can occur and facts change; verify independently before acting on anything you read.
No advisory relationship. Reading this site does not create an advisor-client relationship of any kind. See the full disclosures page.