
What is the summary comparison?
The short version
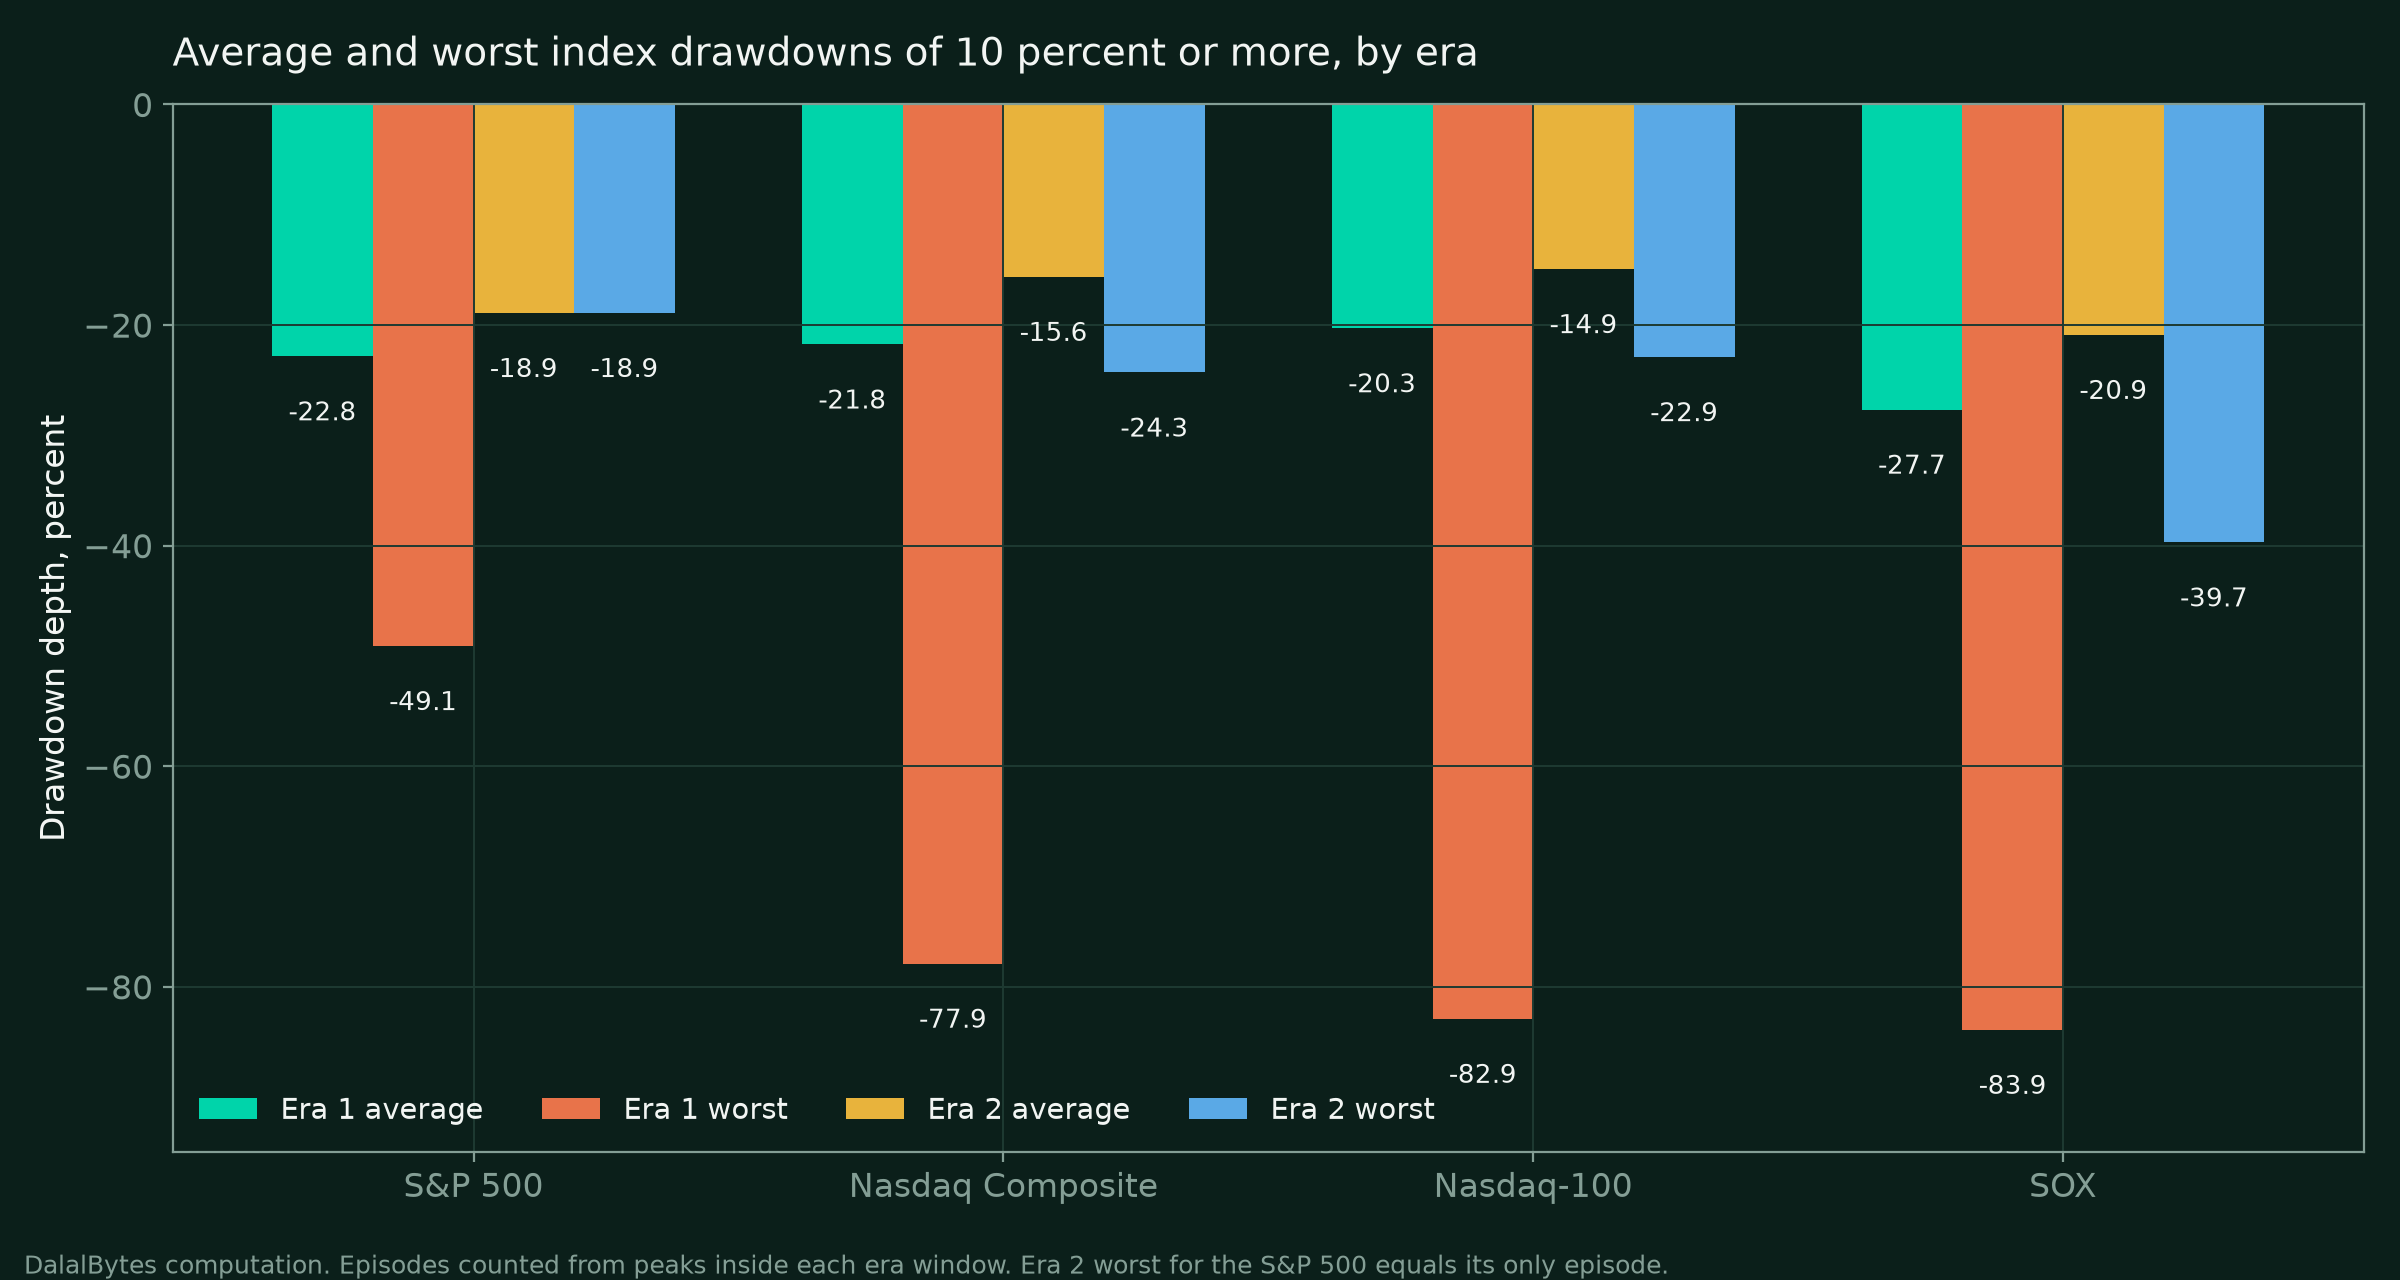
Era one broke deeper and longer. Era two has broken nearly as often per year, but shallower, faster, and mostly inside the semiconductor complex.
- Count: 32 index drawdowns of 10 percent or more from era one peaks against 17 from era two peaks. Era one ran six years and era two has run just under four, so the per year rate is closer than the raw count: about 5.3 episodes a year against about 4.4.
- Average depth: 22.9 percent in era one against 17.8 percent in era two. The averages hide the tails, and the tails are the story.
- Worst episode: 83.9 percent (the SOX, March 2000 to October 2002) against 39.7 percent (the SOX again, July 2024 to April 2025).
- Average peak to trough duration: 162 days in era one against 71 days in era two. Era one's defining episodes took about 31 months to bottom. No era two index episode has taken longer than 9 months.
- The current drawdown, measured at the November 6, 2026 close: S&P 500 down 5.7 percent from its October 6 peak, Nasdaq Composite down 10.9 percent, Nasdaq-100 down 13.6 percent, and the SOX down 35.8 percent from a peak it set back in June 2026.
Every comparison of this market to 2000 eventually becomes an argument about drawdowns, so we stopped arguing from memory and computed them. The table below is the whole piece in one screen. Everything after it is the audit trail: the episode tables, the stock tables, the causes, and the conditions under which the verdict at the end would flip.
| Index | Era 1 episodes | Era 1 average | Era 1 worst | Era 2 episodes | Era 2 average | Era 2 worst |
|---|---|---|---|---|---|---|
| S&P 500 | 4 | -22.8% | -49.1% | 1 | -18.9% | -18.9% |
| Nasdaq Composite | 9 | -21.8% | -77.9% | 4 | -15.6% | -24.3% |
| Nasdaq-100 | 11 | -20.3% | -82.9% | 5 | -14.9% | -22.9% |
| SOX (semiconductors) | 8 | -27.7% | -83.9% | 7 | -20.9% | -39.7% |
| All four indexes | 32 | -22.9% | -83.9% | 17 | -17.8% | -39.7% |
Three things in that table deserve a second look. First, the S&P 500 has produced exactly one qualifying episode in the entire AI era, the tariff drawdown of early 2025, because an episode is measured from a new high and the broad index kept making them. Second, the SOX is the most violent index in both eras: deepest average, deepest worst, and in era two nearly half of all episodes. The AI trade lives in the semiconductor index, and so does its pain. Third, era two's worst completed episode, the SOX falling 39.7 percent from July 2024 to April 2025, is deeper than era one's average episode and deeper than anything the broad indexes have done in either era outside the terminal collapses. Era two is not a calm era. It is an era whose violence is concentrated in one complex instead of spread across the whole market.
How these numbers were computed. Prices are Yahoo Finance daily closes downloaded on November 7, 2026, split adjusted and not dividend adjusted, so every depth here is a price decline, slightly deeper than a total return decline would be. An episode begins at a running peak and counts when the close falls at least 10 percent below it for indexes and at least 20 percent for individual stocks. The trough is the lowest close before the first close back at or above the peak, which is the recovery date. Eras are assigned by peak date: era one peaks fall between January 1, 1996 and December 31, 2001, era two peaks between January 1, 2023 and the last close on November 6, 2026. Where an era one peak was never recovered, the trough search stops at the end of 2004 so the 2008 to 2009 bear market is not folded into the era's measurement; those rows are flagged. Episodes still open are counted at their depth so far. Because episodes are measured from new highs, a decline that starts below an older, still unrecovered peak belongs to that older episode: the 2023 correction, which began below the January 2022 S&P 500 peak, is part of the 2022 episode and is not counted as an era two episode. Nortel, Lucent, Sun Microsystems, and Dell have no downloadable daily series, so their figures are documented from the sources named where they appear and are never blended into the computed tables.
How deep did the indexes fall, era by era?
The short version
Era one's table is a story of a gentle slope of corrections, then one cliff. Era two's table is a story of repeated sharp air pockets that recovered in months, with the SOX doing most of the falling.
- 27 of era one's 32 episodes fell between 10 and 30 percent, ordinary bull market weather, which is why so few investors recognized the terminal one when it started.
- The terminal episodes bottomed together in October 2002, about 31 months after the peaks, at depths of 49.1 percent (S&P 500), 77.9 percent (Nasdaq Composite), 82.9 percent (Nasdaq-100), and 83.9 percent (SOX).
- Recovery, not depth, is era one's cruelest number: the Nasdaq Composite needed until April 2015 to close above its March 2000 peak, the Nasdaq-100 until November 2015, and the SOX until November 2017.
- Every completed era two episode recovered within 14 months of its peak, and most within a single quarter of its trough.
- Three era two episodes are still open: the Nasdaq pair from October 6, 2026, and the SOX from June 22, 2026, already 38.4 percent deep at its November 5 trough.
Era one: peaks between January 1996 and December 2001. Read the table top to bottom and watch the character change. The 1996 to 1999 rows are the ordinary weather of a bull market: the 1997 Asian crisis, the 1998 Russia and LTCM collapse (the Nasdaq Composite fell 29.5 percent and the SOX 53.0 percent peak to trough across 1997 to 1998), and a string of 10 to 15 percent shakeouts in 1999 that recovered in weeks. Then the last row of each index is the same event, and it does not behave like the others. It does not recover in weeks. It does not recover in years.
| Index | Peak | Trough | Depth | Months to trough | Recovered |
|---|---|---|---|---|---|
| S&P 500 | Oct 7, 1997 | Oct 27, 1997 | -10.8% | 0.7 | Dec 5, 1997 |
| S&P 500 | Jul 17, 1998 | Aug 31, 1998 | -19.3% | 1.5 | Nov 23, 1998 |
| S&P 500 | Jul 16, 1999 | Oct 15, 1999 | -12.1% | 3.0 | Nov 16, 1999 |
| S&P 500 | Mar 24, 2000 | Oct 9, 2002 | -49.1% | 30.5 | May 30, 2007 |
| Nasdaq Composite | Jun 5, 1996 | Jul 24, 1996 | -16.6% | 1.6 | Oct 7, 1996 |
| Nasdaq Composite | Jan 22, 1997 | Apr 2, 1997 | -13.5% | 2.3 | May 23, 1997 |
| Nasdaq Composite | Oct 9, 1997 | Dec 24, 1997 | -14.1% | 2.5 | Feb 23, 1998 |
| Nasdaq Composite | Apr 22, 1998 | Jun 15, 1998 | -10.5% | 1.8 | Jul 8, 1998 |
| Nasdaq Composite | Jul 20, 1998 | Oct 8, 1998 | -29.5% | 2.6 | Nov 27, 1998 |
| Nasdaq Composite | Feb 1, 1999 | Feb 17, 1999 | -10.4% | 0.5 | Apr 5, 1999 |
| Nasdaq Composite | Apr 26, 1999 | May 25, 1999 | -10.2% | 1.0 | Jun 30, 1999 |
| Nasdaq Composite | Jul 16, 1999 | Aug 10, 1999 | -13.1% | 0.8 | Sep 10, 1999 |
| Nasdaq Composite | Mar 10, 2000 | Oct 9, 2002 | -77.9% | 31.0 | Apr 23, 2015 |
| Nasdaq-100 | Jun 5, 1996 | Jul 23, 1996 | -14.4% | 1.6 | Sep 13, 1996 |
| Nasdaq-100 | Jan 22, 1997 | Apr 2, 1997 | -15.3% | 2.3 | May 5, 1997 |
| Nasdaq-100 | Oct 9, 1997 | Dec 24, 1997 | -18.2% | 2.5 | Feb 19, 1998 |
| Nasdaq-100 | Jul 20, 1998 | Oct 8, 1998 | -23.0% | 2.6 | Nov 9, 1998 |
| Nasdaq-100 | Feb 1, 1999 | Mar 2, 1999 | -11.4% | 1.0 | Mar 29, 1999 |
| Nasdaq-100 | Apr 9, 1999 | Apr 19, 1999 | -11.9% | 0.3 | Apr 26, 1999 |
| Nasdaq-100 | Apr 26, 1999 | May 25, 1999 | -11.6% | 1.0 | Jun 21, 1999 |
| Nasdaq-100 | Jul 16, 1999 | Aug 10, 1999 | -12.0% | 0.8 | Aug 25, 1999 |
| Nasdaq-100 | Jan 3, 2000 | Jan 6, 2000 | -11.9% | 0.1 | Jan 19, 2000 |
| Nasdaq-100 | Jan 21, 2000 | Jan 28, 2000 | -10.5% | 0.2 | Feb 3, 2000 |
| Nasdaq-100 | Mar 27, 2000 | Oct 7, 2002 | -82.9% | 30.4 | Nov 3, 2015 |
| SOX | May 27, 1997 | Jun 12, 1997 | -12.9% | 0.5 | Jul 9, 1997 |
| SOX | Aug 20, 1997 | Oct 8, 1998 | -53.0% | 13.6 | Jan 20, 1999 |
| SOX | Jan 29, 1999 | Mar 2, 1999 | -17.4% | 1.1 | May 19, 1999 |
| SOX | May 19, 1999 | May 25, 1999 | -13.1% | 0.2 | Jun 9, 1999 |
| SOX | Jul 16, 1999 | Jul 26, 1999 | -11.4% | 0.3 | Aug 24, 1999 |
| SOX | Sep 14, 1999 | Oct 19, 1999 | -15.8% | 1.2 | Nov 3, 1999 |
| SOX | Dec 6, 1999 | Dec 14, 1999 | -13.8% | 0.3 | Dec 21, 1999 |
| SOX | Mar 10, 2000 | Oct 9, 2002 | -83.9% | 31.0 | Nov 21, 2017 |
The chart below puts the terminal episode's shape next to era two's. The difference is not only depth. It is shape. Era one's defining line falls, rallies hard enough to trap buyers at least four times, and keeps making new lows for two and a half years. Era two's lines fall once, hard, and then climb back over their peaks within months.
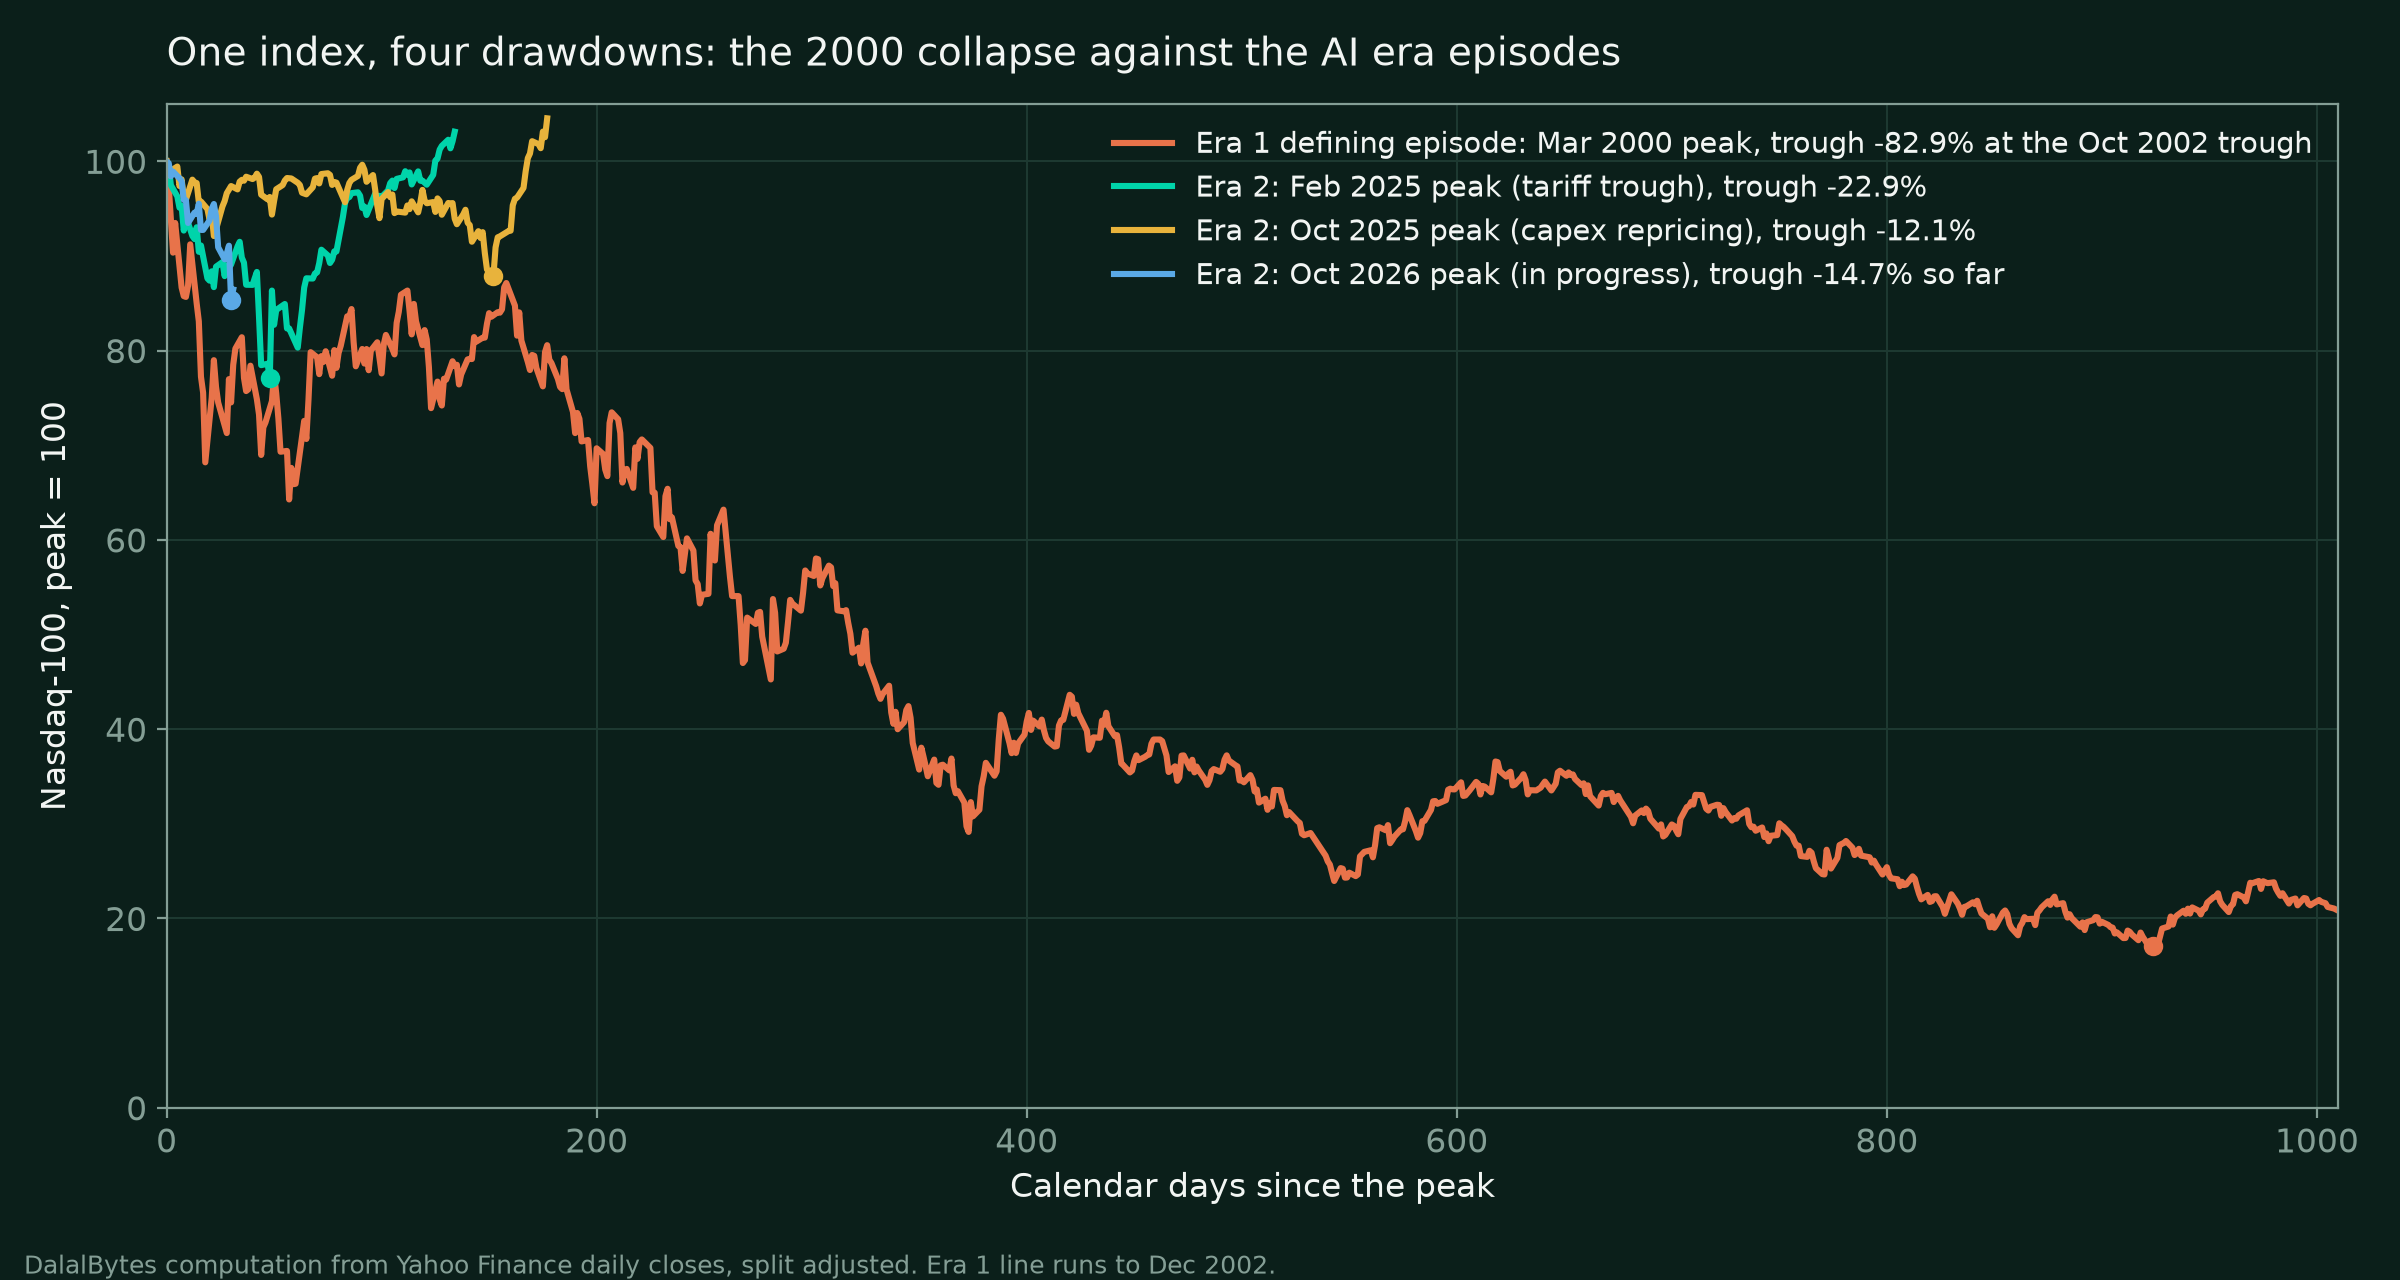
Era two: peaks between January 2023 and November 6, 2026. Seventeen episodes, and the pattern inverts. The declines are sharp and the recoveries are fast, because each one so far has ended when its specific cause ended: the tariff shock paused, the capex guides were raised again, the summer air pocket refilled. The SOX is again the exception that carries the era's real damage, including the only era two episode that ground on for the better part of a year.
| Index | Peak | Trough | Depth | Months to trough | Recovered |
|---|---|---|---|---|---|
| S&P 500 | Feb 19, 2025 | Apr 8, 2025 | -18.9% | 1.6 | Jun 27, 2025 |
| Nasdaq Composite | Jul 10, 2024 | Aug 7, 2024 | -13.1% | 0.9 | Oct 29, 2024 |
| Nasdaq Composite | Dec 16, 2024 | Apr 8, 2025 | -24.3% | 3.7 | Jun 27, 2025 |
| Nasdaq Composite | Oct 29, 2025 | Mar 30, 2026 | -13.2% | 5.0 | Apr 15, 2026 |
| Nasdaq Composite | Oct 6, 2026 | Nov 5, 2026 | -11.9% so far | 1.0 | In progress |
| Nasdaq-100 | Jul 10, 2024 | Aug 7, 2024 | -13.6% | 0.9 | Nov 6, 2024 |
| Nasdaq-100 | Feb 19, 2025 | Apr 8, 2025 | -22.9% | 1.6 | Jun 24, 2025 |
| Nasdaq-100 | Oct 29, 2025 | Mar 30, 2026 | -12.1% | 5.0 | Apr 15, 2026 |
| Nasdaq-100 | Jun 2, 2026 | Jul 29, 2026 | -11.3% | 1.9 | Sep 22, 2026 |
| Nasdaq-100 | Oct 6, 2026 | Nov 5, 2026 | -14.7% so far | 1.0 | In progress |
| SOX | Mar 7, 2024 | Apr 19, 2024 | -16.6% | 1.4 | May 24, 2024 |
| SOX | Jul 10, 2024 | Apr 8, 2025 | -39.7% | 8.9 | Sep 10, 2025 |
| SOX | Oct 29, 2025 | Nov 20, 2025 | -13.3% | 0.7 | Dec 8, 2025 |
| SOX | Dec 10, 2025 | Dec 17, 2025 | -10.3% | 0.2 | Jan 6, 2026 |
| SOX | Feb 25, 2026 | Mar 30, 2026 | -15.6% | 1.1 | Apr 8, 2026 |
| SOX | Jun 3, 2026 | Jun 10, 2026 | -12.3% | 0.2 | Jun 15, 2026 |
| SOX | Jun 22, 2026 | Nov 5, 2026 | -38.4% so far | 4.5 | In progress |
Two rows deserve emphasis. The SOX episode that began on July 10, 2024 did not bottom until April 8, 2025, 39.7 percent lower, and the index needed until September 10, 2025 to close above its July 2024 peak: a genuine bear market inside the AI era, in the AI era's core index, that most index level commentary missed because the S&P 500 made new highs through much of it. And the open SOX episode is the second deepest of the era already, 38.4 percent from the June 22, 2026 peak of 14,634.72 to the November 5, 2026 trough of 9,011.14. Whatever the verdict on the broad market, the semiconductor complex is not having a correction. It is having its bear, in installments.
What happened to the major players?
The short version
Era one's leaders were destroyed even when their businesses survived. Era two's leaders have been cut by a third, give or take, and one of them by almost two thirds, without a single terminal case.
- Era one maximum drawdowns, computed at a 20 percent threshold: Cisco 89.3 percent, Qualcomm 86.8 percent, Oracle 84.2 percent, Intel 82.3 percent, Microsoft 65.2 percent, Amgen 60.2 percent.
- The documented dead: Nortel fell about 99 percent from its July 2000 peak to October 2002 and its shareholders received nothing in the 2009 bankruptcy. Lucent fell from $82.31 in December 1999 to $0.55 in October 2002 and was merged away into Alcatel in 2006.
- Recovery dates are the era one stock story: Cisco did not close above its March 2000 peak again until December 2025, Intel until April 2026, Qualcomm until November 2019, Oracle until June 2017, Microsoft until October 2016.
- Era two maximum drawdowns so far: AMD 63.0 percent, Palantir 48.2 percent, Broadcom 41.5 percent, NVIDIA 36.9 percent, Microsoft 34.9 percent, Meta 34.2 percent, Amazon 30.9 percent, Alphabet 30.7 percent.
- No era two leader has gone bankrupt, been taken under, or missed a recovery for longer than 19 months. Every completed era two leader episode has recovered.
Era one's leaders. These were not speculative shells. Cisco, Microsoft, Intel, Oracle, and Qualcomm were the profitable core of the technology industry, and the algorithm's verdict on owning the best businesses of the era at its peak is below. Note what the recovery column says: in era one, buying quality at the top did not save you. It only changed whether you eventually got out whole, and eventually meant 10 to 25 years.
| Company | Episodes of 20% or more | Maximum drawdown | Peak | Trough | Peak reclaimed |
|---|---|---|---|---|---|
| Cisco | 3 | -89.3% | Mar 27, 2000 | Oct 8, 2002 | Dec 10, 2025 |
| Qualcomm | 7 | -86.8% | Jan 3, 2000 | Aug 5, 2002 | Nov 7, 2019 |
| Oracle | 7 | -84.2% | Sep 1, 2000 | Jun 3, 2002 | Jun 21, 2017 |
| Intel | 6 | -82.3% | Aug 31, 2000 | Oct 8, 2002 | Apr 24, 2026 |
| Microsoft | 3 | -65.2% | Dec 27, 1999 | Dec 20, 2000 (flagged) | Oct 21, 2016 |
| Amgen | 6 | -60.2% | Jul 21, 2000 | Jul 15, 2002 | Jul 20, 2005 |
The flagged Microsoft trough follows the methods note: Microsoft never fell further after 2000 than its December 20, 2000 low inside the measurement window that closes at the end of 2004, and it did not close above its December 1999 peak again until October 2016. The deepest quality drawdown of the era belongs to Cisco, 89.3 percent, and Cisco's reward for surviving, dominating its market for two more decades, and never facing an existential crisis was that a peak buyer waited until December 2025, more than 25 years, to be whole on price.
The documented dead and diminished. Four era one leaders have no downloadable daily series, so these figures are documented, not computed. Nortel peaked at C$124.50 on the Toronto exchange on July 26, 2000 (CBC News), made up more than a third of the entire TSE 300 index, and fell about 99 percent by October 2002; it filed for bankruptcy on January 14, 2009, and common shareholders received nothing. Lucent peaked at $82.31 in December 1999 and traded at $0.55 in October 2002, a fall of about 99 percent, before merging into Alcatel in 2006. Sun Microsystems closed at its all time high of $64.66 in September 2000, at about 10 times sales and a market value above $200 billion; it traded below $5 within about two years, and Oracle acquired it in 2010 for $9.50 a share, $7.4 billion in total, under 4 percent of its peak value. Dell fell 65.8 percent in calendar 2000 alone, from $51.00 to $17.44 on split adjusted yearly closes (1stock1 data), and was taken private in 2013 at $13.75 a share, below its 2000 peak close. WorldCom, the era's other great balance sheet, filed what was then the largest bankruptcy in American history in 2002. Era one's terminal cases were not fringe names. Two of them were, at their peaks, among the largest companies on earth.
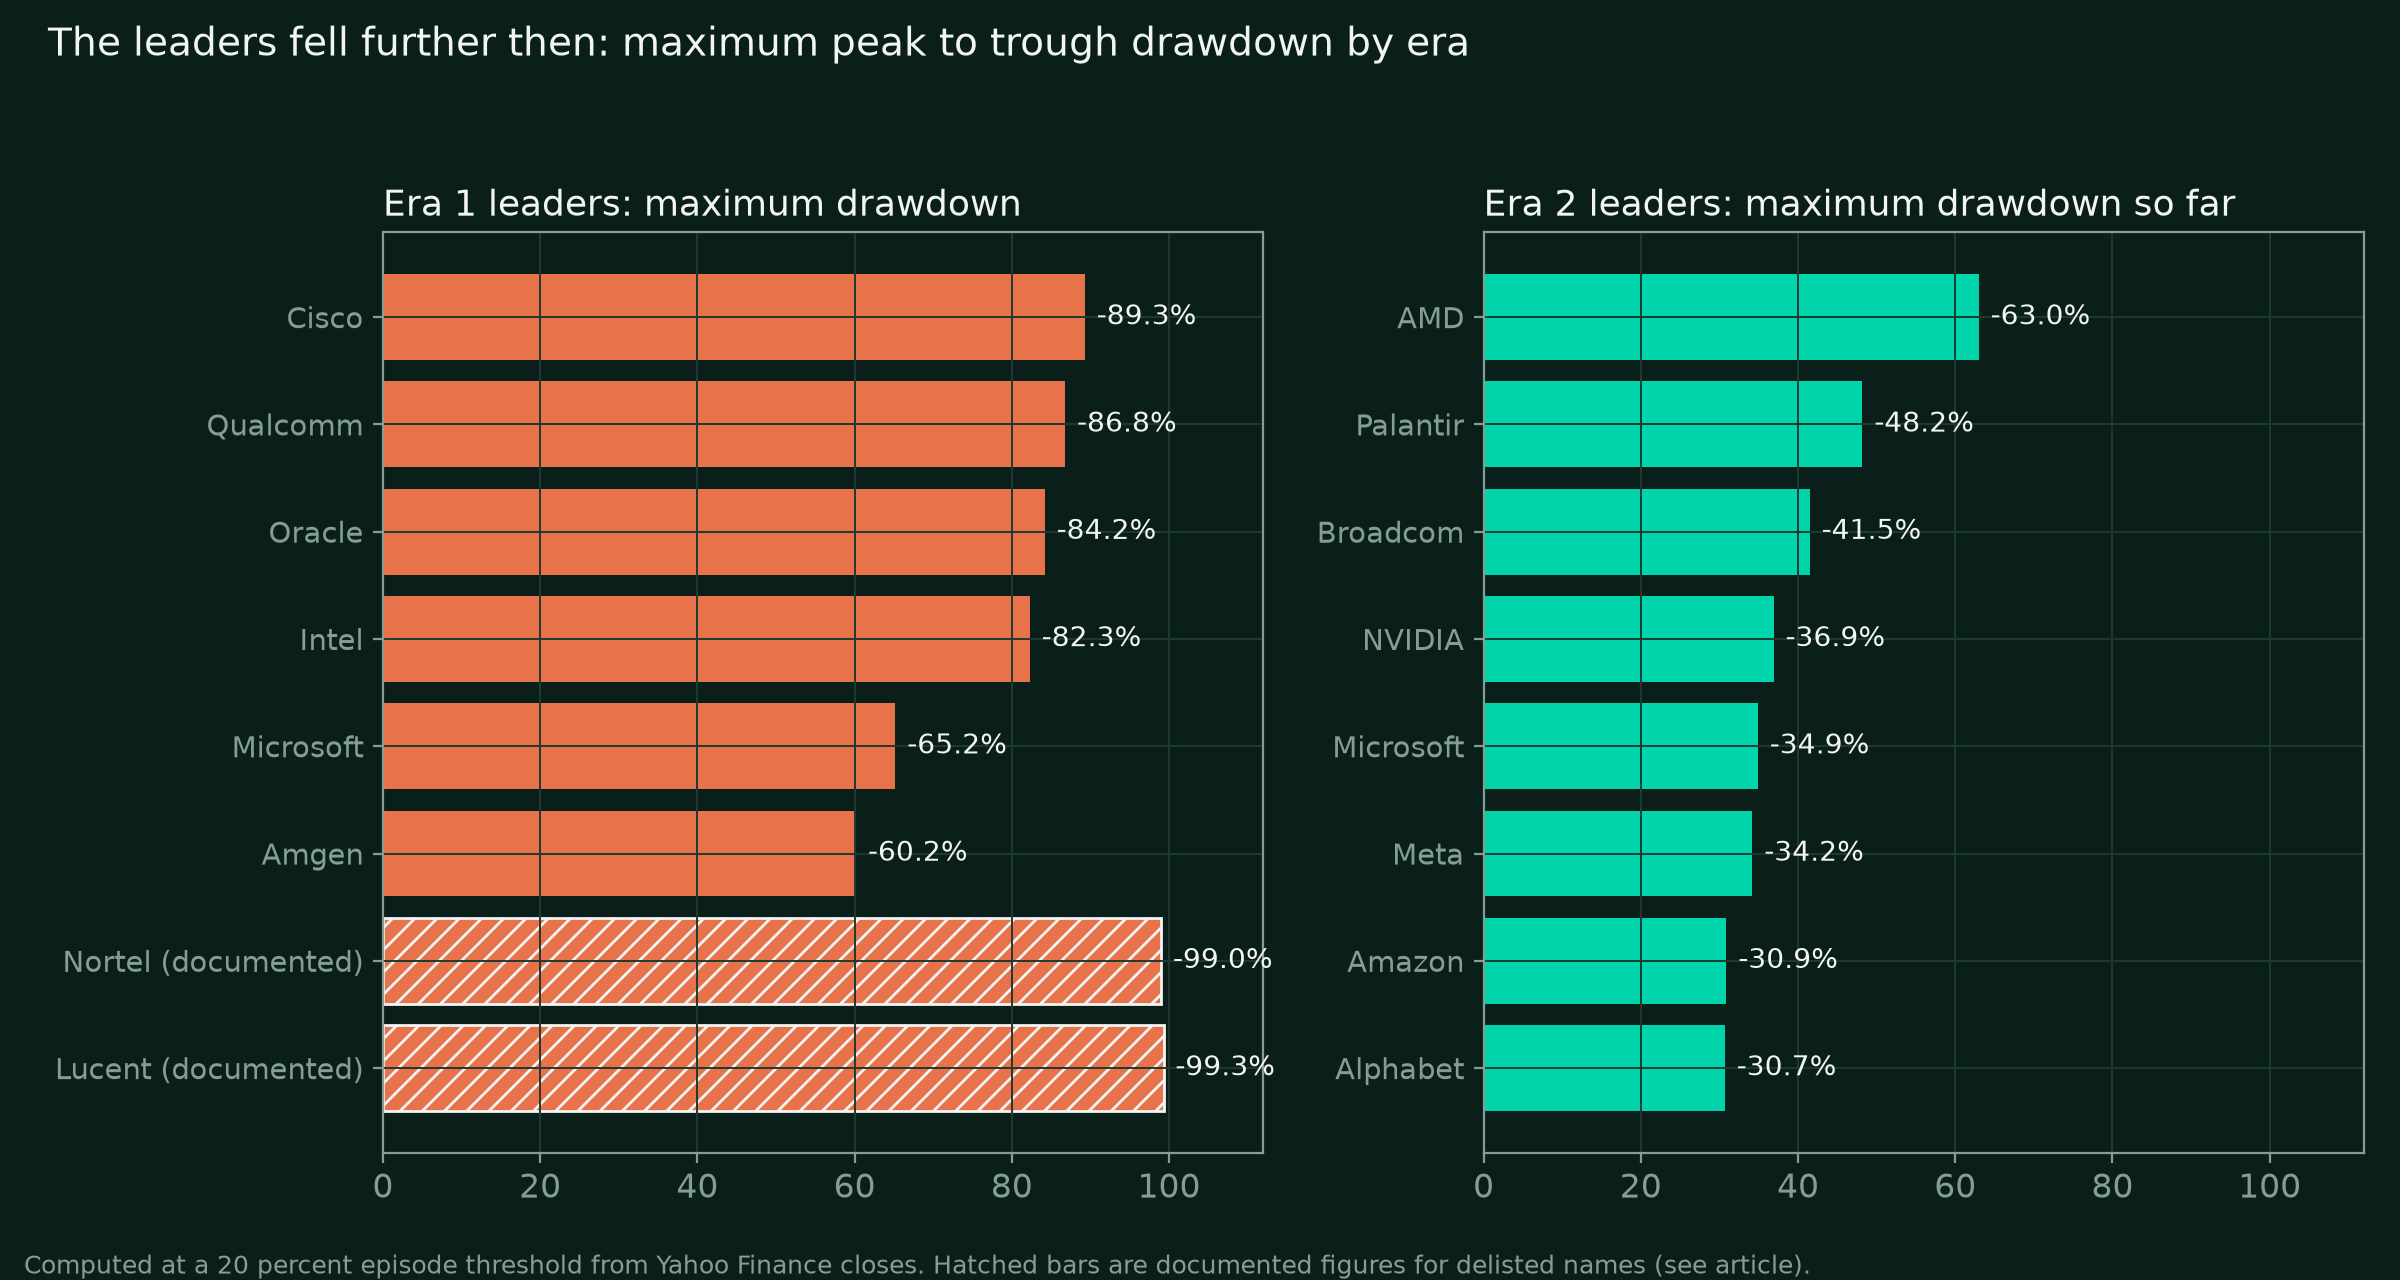
Era two's leaders. The distribution is different in kind. The falls are real, several are larger than a full ordinary bear market, and AMD's 63.0 percent slide from March 2024 to April 2025 shows that era two can destroy a leader's shareholders for a year without touching the index story. But the right tail is missing. Nothing in era two has done what Cisco did, let alone what Nortel did, and every completed episode in the table has already recovered, most within months.
| Company | Episodes of 20% or more | Maximum drawdown | Peak | Trough | Peak reclaimed |
|---|---|---|---|---|---|
| AMD | 4 | -63.0% | Mar 7, 2024 | Apr 8, 2025 | Oct 7, 2025 |
| Palantir | 4 | -48.2% | Nov 3, 2025 | Jun 25, 2026 | Oct 9, 2026 |
| Broadcom | 4 | -41.5% | Dec 16, 2024 | Apr 4, 2025 | Jun 3, 2025 |
| NVIDIA | 4 | -36.9% | Jan 6, 2025 | Apr 4, 2025 | Jun 25, 2025 |
| Microsoft | 2 | -34.9% | Oct 28, 2025 | Jun 25, 2026 | Oct 13, 2026 |
| Meta | 2 | -34.2% | Feb 14, 2025 | Apr 21, 2025 | Jun 30, 2025 |
| Amazon | 2 | -30.9% | Feb 4, 2025 | Apr 21, 2025 | Oct 31, 2025 |
| Alphabet | 4 | -30.7% | May 13, 2026 | Nov 2, 2026 | Not yet |
The open positions in that table matter for the verdict. Alphabet's maximum drawdown is its current one, still open from its May 13, 2026 peak. Broadcom sits 39.0 percent below its June 2, 2026 peak at the November 6 close, AMD 30.9 percent below its October 6 peak, NVIDIA 22.0 percent below its October 6 peak, and Palantir 23.3 percent below its October 9 peak. Era two's leaders are, right now, in the middle of the second largest collective drawdown of the era. The question the rest of this article answers is whether that is what an ending looks like.
What caused the drawdowns in each era?
The short version
Era one's corrections were caused by the outside world. Its collapse was caused by the inside of the story: prices that required earnings that did not exist, financed by debt that could not be serviced.
- Era one's pre 2000 episodes map to external shocks: the 1997 Asian crisis and the 1998 Russian default and LTCM failure.
- The terminal episode needed four ingredients at once: extreme valuations, a telecom debt and capacity build, a Federal Reserve that tightened from 4.75 percent to 6.5 percent between mid 1999 and May 2000, and earnings that never arrived to meet the prices.
- Every era two episode so far maps to a named, datable shock: the August 2024 carry unwind, the January 2025 DeepSeek shock, the April 2025 tariff shock, and two capex and free cash flow repricings, in October 2025 and October to November 2026.
- No era two episode has yet been caused by the era one terminal mechanism: a leveraged capacity build meeting earnings that failed to show up.
Era one. The early episodes were not about the bubble at all. The October 1997 drawdowns were the Asian financial crisis reaching New York. The deep 1998 episodes, 19.3 percent on the S&P 500, 29.5 percent on the Nasdaq Composite, and 53.0 percent peak to trough on the SOX across 1997 to 1998, were Russia's default and the LTCM collapse squeezing a leveraged system. The bubble absorbed both and made new highs within months, which taught a generation of investors that every fall was a buying opportunity. That lesson is what made the terminal episode so destructive: by March 2000 the market had been trained, by 27 ordinary corrections, to buy a fall that this time was not ordinary.
The terminal episode had four causes, and it needed all of them. Valuation extremes. The Nasdaq-100 traded at 60.1 times forward earnings at the peak and the Nasdaq Composite at roughly 175 times trailing earnings (figures detailed in the next section), which meant prices were not discounting a future so much as requiring a miracle on schedule. The debt build. The Telecommunications Act of 1996 unleashed a capacity race: industry histories put telecom capital spending at about $121 billion in 2000 alone, much of it debt financed, and the equipment makers financed their own customers to keep the orders flowing, Lucent most aggressively. When the capacity turned out to be years ahead of demand, the debt remained. Nortel's revenue fell from $30.3 billion in 2000 to about $10.9 billion in 2001, and the equity story fell with it. The rate cycle. The Federal Reserve raised its policy rate from 4.75 percent in mid 1999 to 6.5 percent by May 2000, directly attacking the discount rate under the longest duration assets in the market. The earnings that never arrived. By Jay Ritter's count, 86 percent of the technology companies that went public in 1999 and 2000 were unprofitable. The second and third legs of the bust, through 2001 and 2002, were simply the quarterly arrival of that fact.
Era two. Each episode in the era two table has a proximate cause in the record, and the list is worth reading as a list, because its character is the argument.
| Episode | Indexes hit | Proximate cause |
|---|---|---|
| Mar to Apr 2024 | SOX | A spring rate repricing and soft foundry guidance; the shallowest kind of semi air pocket. |
| Jul to Aug 2024 | Nasdaq pair; start of the long SOX slide | The yen carry unwind and the August 5, 2024 global selloff, landing on a market already arguing about whether AI capital spending would earn its keep. |
| Dec 2024 and Feb 2025 to Apr 2025 | All four | Began with the January 2025 DeepSeek shock, which cut NVIDIA 36.9 percent peak to trough, and bottomed on the April 2025 tariff shock, the era's only broad index event. |
| Oct 2025 to Mar 2026 | Nasdaq pair, SOX | The first capex and free cash flow repricing: the October 2025 prints raised spending guides again and the market spent five months marking down the cash cost. |
| Jun to Jul 2026 | Nasdaq-100, SOX | A summer air pocket in the most extended complex in the market. The SOX had risen 96.0 percent from its December 10, 2025 close to its June 22, 2026 peak (our computation), and it gave back ground in installments from there. |
| Oct to Nov 2026 | All four, still open | The second capex and free cash flow repricing, after the Q3 2026 prints: Alphabet's quarterly free cash flow printed at negative $9.07 billion and Meta's at negative $2.12 billion on $34.91 billion of quarterly capital spending (covered in this site's earnings work), and the market is repricing the buildout's cash cost again, harder. |
Notice what is absent from the era two list: leverage unwinding, fraud surfacing, a financing channel closing, an earnings base that turns out to be fictional. Era two's drawdowns have been repricings of a real buildout's price and cash timing, triggered from outside or by the buildout's own bill. Era one's terminal drawdown was the discovery that the demand itself had been borrowed from the future and financed with debt. Those are different diseases, and they have different prognoses.
How do the eras differ underneath the price action?
The short version
On forward earnings the eras are not close. On long run valuation they are uncomfortably close. The earnings, the balance sheets, and the identity of the borrower are all different this time, and the concentration is not.
- Forward P/E at the peaks: S&P 500, 24.4 in March 2000 against 18.7 on October 30, 2026 (FactSet both). Nasdaq-100, 60.1 against about 19.5 to 22.4. Cisco at its peak, 130.3 times forward earnings (FactSet series), against NVIDIA at 16.9 times in the October 30, 2026 snapshot.
- The honest counterweight: the Shiller CAPE ratio peaked at 44.2 in December 1999 and stood at 40.7 on October 1, 2026. On the long run gauge, this market is nearly as expensive as that one.
- Earnings: S&P 500 earnings grew 30.2 percent year on year in Q3 2026 (FactSet). At era one's peak, 86 percent of the era's new technology listings had no earnings at all.
- Leverage changed address: from junk financed telecom carriers and vendor financing in era one, to investment grade bond issuance by cash generating hyperscalers in era two.
- Concentration did not change: technology was about 35 percent of the S&P 500 at the 2000 peak and 39.4 percent at the start of June 2026, on the same index data compilation.
| Valuation gauge | Era one peak | Era two, latest | Source |
|---|---|---|---|
| S&P 500 forward P/E | 24.4 (Mar 24, 2000) | 18.7 (Oct 30, 2026) | FactSet, both readings |
| Nasdaq-100 forward P/E | 60.1 (Mar 2000) | about 19.5 to 22.4 (Oct 30, 2026) | FactSet data, both readings |
| Nasdaq Composite trailing P/E | about 175 (Mar 2000) | No comparable primary series | Wall Street Journal estimate for 2000 |
| Shiller CAPE, S&P 500 | 44.2 (Dec 1999) | 40.7 (Oct 1, 2026) | Robert Shiller's data |
| S&P 500 technology sector forward P/E | above 55 (2000) | 29.7 (2026) | Yardeni Research |
| The era's champion at its peak | Cisco, 130.3 times forward | NVIDIA, 16.9 times forward | FactSet series for Cisco; StockAnalysis consensus snapshot of Oct 30, 2026 closes for NVIDIA |
Providers differ on the 2000 S&P 500 figure (the J.P. Morgan series puts the March 2000 forward multiple at 27.2), so the table keeps one provider, FactSet, on both sides of the comparison. The conclusion survives the choice of provider: on what investors pay for next year's expected earnings, era two trades at roughly a third of era one's Nasdaq peak and at a discount to era one's broad market peak. On the CAPE ratio, which divides price by ten years of real earnings and so refuses to credit the AI earnings surge until it has persisted, the two eras are nearly tied. Both statements are true, and the tension between them is the honest summary of the valuation debate: this market is expensive in the way a profitable market gets expensive, not in the way a profitless one does.
Earnings and cash. Era one's speculative edge had no earnings to fall back on, and when prices fell there was no cash flow floor under them, which is why so many era one charts go to zero instead of to a trough. Era two's leaders are the largest cash generators in market history, and the index level earnings are compounding, not hoped for: FactSet's blended count had S&P 500 earnings growing 30.2 percent year on year in the third quarter of 2026. The autumn drawdown's proximate cause is itself proof of the difference. Alphabet and Meta were marked down for spending their cash flows too aggressively on the buildout, a complaint that only exists because the cash flows exist. Era one's equivalent complaint never arose. Its companies were marked down for not having any.
Leverage and the borrower. Era one's leverage sat exactly where the losses landed: with telecom carriers building ahead of demand on borrowed money, and with equipment makers lending to their own customers and booking the loans as revenue. When demand disappointed, the debt converted a price decline into bankruptcies, and the bankruptcies converted a bear market into a depression for the sector. Era two's buildout is financed primarily from operating cash flow, and where debt is used it is investment grade paper issued by the hyperscalers themselves: this site's filing work on the Q3 2026 reports put Amazon's long term debt at a face value of $180.9 billion and Alphabet's 2026 issuance at $147 billion raised in nine months. That is a great deal of debt, and it deserves watching, but it is debt owed by the most profitable companies in the world against contracted demand, not junk owed by carriers against hoped for demand. The failure mode, if it comes, is a return on capital disappointment spread over years, not a solvency cascade spread over quarters.
Concentration and the marginal trader. The one structural feature the eras genuinely share is concentration. Technology was about 35 percent of the S&P 500's value at the 2000 peak and 39.4 percent at the start of June 2026 on the same compilation of index data, and the ten largest stocks were 29.2 percent of the index in March 2000 on Ned Davis Research figures, a share today's top ten exceeds. Nortel alone was more than a third of the Toronto index at its peak; no single stock carries that weight in the S&P 500 today, but the complex does. The marginal buyer differs, though. Era one's marginal buyer was a momentum buyer and its marginal financing was an IPO calendar and a junk bond desk. Era two's marginal buyer is a passive flow and, until this year, the companies' own buyback desks, two of which, Alphabet's and Amazon's, sat out 2026 entirely on this site's filing work. The marginal seller this autumn is a reallocating institution trimming a concentration it already owns, not a margin clerk. The tape agrees so far: the sharpest break, on November 5, was followed on November 6 by a higher close on all four indexes, which is not how forced liquidation sequences usually print.
Is the current drawdown the end of the AI wave?
The short version
No, on the evidence computed here. The current drawdown sits inside era two's own correction distribution, its lows are holding far above the era's prior troughs, and the earnings and capex direction, as of the latest prints, still points up. The semiconductor complex is the exception: it is already in a full bear of its own.
- Depth check: the Nasdaq-100 at 13.6 percent below its peak is an ordinary era two correction (era two average for the index, 14.9 percent; worst, 22.9 percent). The S&P 500 at 5.7 percent below its peak has not yet qualified as an episode at all.
- Structure check: the November 5 troughs sit far above the March 2026 troughs (Nasdaq-100, 26,629.81 against 22,953.38) and further above the April 2025 troughs. Higher lows are what corrections inside a wave print. Era one's terminal episode printed lower lows for 31 consecutive months.
- Fundamental check: Q3 2026 earnings grew 30.2 percent and the October prints raised capex guides again. The drawdown is a repricing of the buildout's cash cost, not a collapse in its demand.
- The bear's best evidence: the CAPE at 40.7 against 44.2 at the 2000 peak, and a SOX already down 38.4 percent, which says the clearing in the most extended complex is well advanced whether or not the broad wave continues.
- Four named lines would flip this verdict. They are listed at the end of this section, with levels.
The verdict
The current drawdown is a correction inside the AI wave, not the end of it. The evidence is distributional: nothing the broad indexes have done this autumn falls outside the range of what this era has already done and recovered from three times. It is structural: the lows are holding above the era's prior lows by wide margins. And it is fundamental: the earnings are growing into the prices at a rate era one never approached, and the buildout's customers raised their spending guides in the very prints that triggered the selling. Era one's ending did not look like this. It looked like 78 to 84 percent declines, 31 months of lower lows, and a decade and a half of recovery. This site's standing cycle read, late middle cycle with hardware margins eroding through 2027 and 2028, argues for respecting the drawdown, not for calling the wave over. A correction inside a late middle cycle is exactly what the ledger shows.
Three qualifications keep the verdict honest. First, the verdict is about the wave and the indexes, not about every name in it. AMD fell 63.0 percent inside this era while the wave was healthy, and Alphabet is in its maximum drawdown of the era right now, still open. Era one's Amgen fell 60.2 percent and was a fine company throughout. Individual leaders can be destroyed by valuation and competition inside a living wave, and several era two leaders are priced richly enough for that to remain possible. Second, the SOX has already had the experience the verdict says the broad market is not having: down 38.4 percent from June, on top of a 39.7 percent bear that ended only in April 2025. If the wave's core complex needs a second full bear to clear its positioning, the index level calm of the S&P 500 is partly an accounting illusion created by diversification. Third, the CAPE ratio does not care about any of this. At 40.7 it sits within 8 percent of the highest reading ever recorded, and it is the one gauge on which 2026 genuinely resembles 2000. Long run returns from here can be poor for years without the wave ending, and the verdict says nothing about returns. It says the drawdown pattern is a correction's pattern.
What would flip it. Verdicts without tripwires are opinions. These four are computed from the same data as everything above, and if any two trigger, the conclusion of this article reverses. One: the Nasdaq-100 closes below 22,953.38, its March 30, 2026 trough. That breaks the higher low structure that separates every era two correction from era one's grind, and it would put the index 26.5 percent below its October peak with the prior floor gone. Two: the S&P 500 closes below 6,255.14, twenty percent under its October 6, 2026 peak of 7,818.93. The broad index has not produced a single 20 percent episode in this era; producing one, from these valuations, on this earnings base, would say the disease has spread from the complex to the market. Three: two or more hyperscalers cut capital spending guidance in the same earnings round. Every era two drawdown so far has ended when the spending guides were reaffirmed or raised; a synchronized cut is the era one terminal mechanism, demand confessed to be borrowed, arriving in modern dress. Four: earnings breadth collapses, measured plainly: S&P 500 earnings growth turning negative year on year on FactSet's blended count while the leaders guide down together. Until then, the ledger's answer stands: this is the AI wave correcting, as it has corrected 17 times at the index level since 2023, and not the AI wave ending, which history says looks nothing like this.
Frequently asked questions
How many big drawdowns has each era produced?
Era one produced 32 index drawdowns of 10 percent or more across the four indexes we track, against 17 in era two. The average era one episode fell 22.9 percent and the worst fell 83.9 percent. Era two averages 17.8 percent, and its worst completed episode fell 39.7 percent.
Is the current drawdown the end of the AI wave?
On the computed evidence, no. The Nasdaq-100 is down 13.6 percent from its October peak, inside era two's normal correction range, and the S&P 500 is down only 5.7 percent. Era one's ending drawdowns took the Nasdaq indexes down 77.9 to 83.9 percent over two and a half years.
How long did the dot-com bust take to recover?
The Nasdaq Composite did not close above its March 2000 peak again until April 2015, fifteen years later. The Nasdaq-100 took until November 2015. The S&P 500 recovered fastest, in May 2007, and Cisco did not reclaim its 2000 peak close until December 2025.
Disclosures
Not financial advice. This article is published for educational purposes only. Nothing here is a recommendation to buy, sell, or hold any security, and nothing here is financial advice. Investing involves risk, including the possible loss of principal.
Positions. The author holds long positions in Palantir, Alphabet, Amazon, Meta, AMD, and Cisco, all discussed in this article. The author holds no position in NVIDIA, Broadcom, Microsoft, Oracle, Intel, Qualcomm, or Amgen. Nortel, Lucent, and Sun Microsystems no longer trade as independent companies.
Accuracy. All drawdown figures in this article are DalalBytes computations from Yahoo Finance daily closing prices downloaded on November 7, 2026, split adjusted and not dividend adjusted, using the episode method described in the methods note in the first section; the script and the computed tables are retained in our working files. Figures for Nortel, Lucent, Sun Microsystems, and Dell are documented rather than computed and are labeled as such where they appear: Nortel's peak price and date are CBC News reporting and its fall and bankruptcy are matters of public record; Lucent's peak and October 2002 prices are from published historical analyses of the telecom bubble; Sun Microsystems' peak close of $64.66 in September 2000 was reported contemporaneously and its $9.50 a share acquisition by Oracle in 2010 is from Oracle's own release; Dell's calendar 2000 figures are 1stock1's split adjusted yearly data and its 2013 take private price is a matter of public record. Valuation figures are FactSet (S&P 500 and Nasdaq-100 forward multiples, and Q3 2026 earnings growth), the Wall Street Journal (Nasdaq Composite trailing multiple estimate for March 2000), Robert Shiller's published data (CAPE), Yardeni Research (technology sector forward multiples), and a StockAnalysis consensus snapshot at the October 30, 2026 closes for NVIDIA's forward multiple; Cisco's peak forward multiple is the FactSet series, and other providers' series differ, as noted in the text. The unprofitable IPO share is Jay Ritter's count for 1999 and 2000 technology offerings. Telecom capital spending of about $121 billion in 2000 and Nortel's revenue figures are from published industry histories citing Light Reading and CBC News. Hyperscaler debt and issuance figures are from this site's research on the companies' Q3 2026 filings. Concentration figures are Ned Davis Research for March 2000 and index data as compiled by AI Bubble Monitor for June 2026. Errors can occur and facts change; verify independently before acting on anything you read.
No advisory relationship. Reading this site does not create an advisor-client relationship of any kind. See the full disclosures page.