

What did Dutch Bros actually report in Q3 2026?
Dutch Bros reported third quarter 2026 results after the close on Wednesday, November 4, 2026. The verdict first: the operating machine passed, and the guide broke. Revenue, earnings, comps against the company's own range, shop count, and cost discipline all cleared the bars we set before the print. The three fails sit on the lines the thesis actually rests on. Customer visits nearly stalled, shop-level margin fell through the hold condition in our October research, and management cut the full-year EBITDA guide, the outcome our pre-print scorecard named in advance as the first fundamental break in this story.
Basis of this piece. This article is built from the Dutch Bros written Q3 2026 earnings release and the scorecard we set before the print. We have not yet read the earnings call transcript, so no call commentary is included and nothing here asserts what management did or did not say on the call. The call grading lands in the Friday Weekly Close pass.
| Dutch Bros, Q3 2026 | Yardstick | Call | |
|---|---|---|---|
| Revenue | $549.8M, +29.8% YoY | About $549M consensus bar | Pass |
| Adjusted EPS | $0.25 | $0.24 consensus bar | Pass |
| System same-shop sales | +4.4% | Management guide of 4% to 5% | Pass |
| System customer visits | +0.4% | Positive and improving on Q2's 1.7% | Fail |
| New shops | 48, to 1,273 total | About 1,265 or more | Pass |
| Company-operated contribution margin | 28.1% | 30% hold condition | Fail |
| Adjusted EBITDA | $101.1M, +29.6% YoY | Growth with the guide intact | Guide cut |
| Full-year EBITDA guide | About $380M | $385M to $390M held or raised | Fail |
THE VERDICT
The print weakens the 74/100 Positive in our October 6 research report materially. The library proposes 64/100 Selective Positive at the formal research refresh, with the competition watch unchanged, and that number is labeled proposed here, not struck. The machine held. The demand quality and the guide did not.
How did the six pre-print gates score?
Before the print we set six pass or fail gates for this quarter, with the traffic line and the full-year guide named as the decisive two. Here they are, graded one by one against the release.
| Gate | The bar | The print | Grade |
|---|---|---|---|
| 1. Revenue and EPS | Revenue at or above about $549M and adjusted EPS at or above $0.24 | Revenue of $549.8M and adjusted EPS of $0.25, a fifth straight beat on the earnings line | Pass |
| 2. System comps | Inside management's own guided 4% to 5% range | System comps of 4.4% landed inside the guide, below the 4.7% street mark and down from 5.8% in the second quarter. Company-operated comps rose 5.4% | Pass |
| 3. Transactions, the traffic test | System visits positive and improving on the second quarter's 1.7% | Visits rose 0.4%, positive for a ninth straight quarter, with ticket supplying 4.0 of the 4.4 points. Company-operated visits rose 1.0% on a 4.4% ticket | Fail |
| 4. Shop count | About 1,265 shops or more, with the Phoenix reacquisition visible | 48 openings took the count to 1,273. The reacquisition shifted 30 franchised shops into company-operated | Pass |
| 5. Contribution margin and SG&A | Margin held at 30% or above, with adjusted SG&A near $73M to $74M | Margin fell to 28.1%. Adjusted SG&A of $69.6M came in under the guide. One sub-line passed and one failed | Fail |
| 6. The full-year guide | No cut to revenue, comps, or adjusted EBITDA | Adjusted EBITDA cut to about $380M from $385M to $390M. Revenue and comp ranges trimmed. Openings guidance held | Fail |
Three passes and three fails, and the fails are the thesis lines. The buildout, the beat habit, and the guided comp range are intact. Visits, margin, and guidance are not.
Why are visits the number that matters?
A drive-thru beverage chain growing on visits is adding customers. A chain growing on ticket is charging the same customers more. This quarter landed on the second mode. System customer visits, the release's transaction measure, rose 0.4%, against 1.7% in the second quarter. Average ticket supplied 4.0 of the 4.4 comp points. The second quarter's comp of 5.8% was ticket-heavy too, but visits contributed 1.7 points to it. Now they contribute almost nothing.
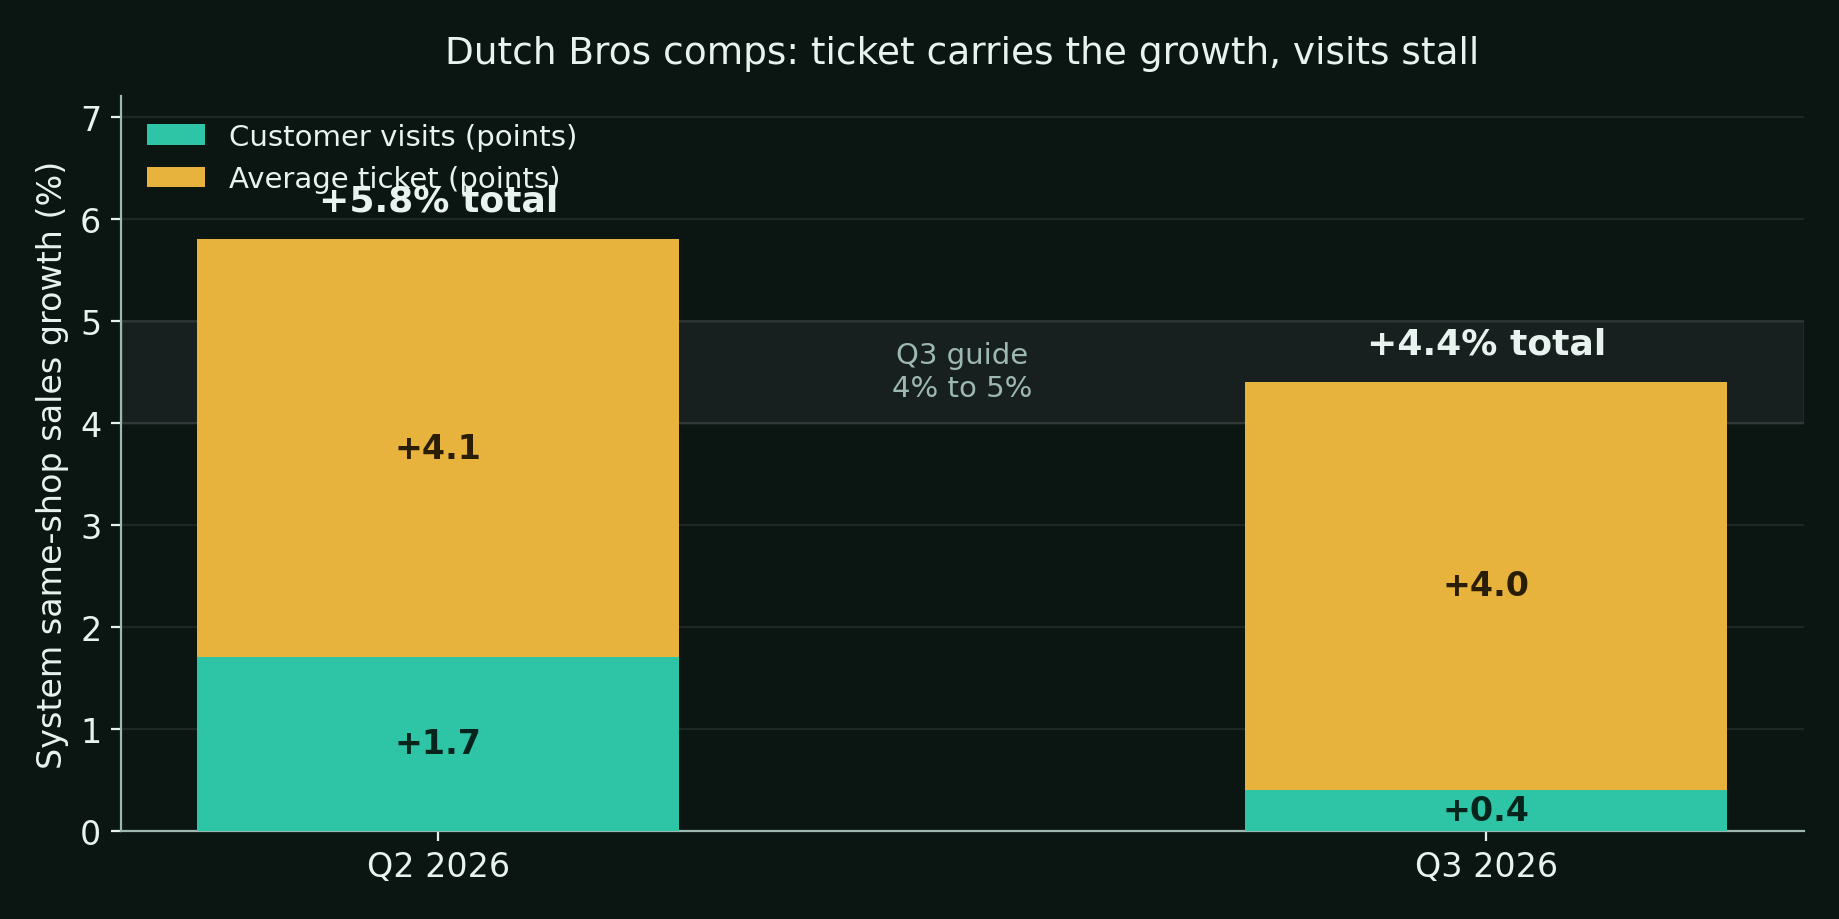
The fair counterweight sits in the same release. Visits stayed positive, the ninth straight quarter of positive system transactions, so no traffic rollover has occurred. Company-operated shops did better, with visits up 1.0%. But our gate asked for positive and improving, and the print delivers positive and decelerating. The upside trigger in our October research, comps above 3% with clear volume growth, moved further away rather than closer.
What pushed contribution margin to 28.1%?
Company-operated shop contribution was $144.5M, and the margin fell to 28.1% from 30.6% in the second quarter. That is through the 30% hold condition in our October research and under its 29% fail line. The year-over-year picture is softer than the sequential one: margin improved 30 basis points from 27.8% in the third quarter of 2025, so this is a step down from a strong second quarter rather than a collapse against last year.
The mover inside the release is occupancy, which reached 18.0% of company-operated revenues against 17.0% a year ago. Labor ran 26.7%, broadly steady. A newly converted shop base is part of the story the numbers tell: the July reacquisition of the Phoenix East Valley market moved 30 franchised shops into company operation, lifting the company-operated count by 72 in the quarter while franchised shops fell by 24. Converted shops carry full company cost lines from day one. Cost discipline held where management controls it directly: adjusted SG&A of $69.6M came in under the $73M to $74M guide.
Why is the guide cut the decisive line?
| Full-year 2026 guide line | Before the print | After the print | Read |
|---|---|---|---|
| Adjusted EBITDA | $385M to $390M | Approximately $380M | Cut |
| Total revenues | $2.10B to $2.13B | At least $2.1B | Top end trimmed |
| System same-shop sales | 5% to 6% | At least 5% | Range trimmed to a floor |
| System shop openings | At least 185 | At least 185 | Held |
| Capital expenditures | Below this range | $370M to $390M | Raised |
Our pre-print scorecard pre-registered this exact outcome: an adjusted EBITDA cut would be the first fundamental break in the Dutch Bros story, as distinct from the multiple compression that has done most of the damage to this stock so far. It happened. The cut is small, about $380M against a $387.5M midpoint, and it arrives with an offset that is not small: management guided 2027 system openings up to approximately 250 shops, against at least 185 this year. A management team cutting the profit guide while accelerating the buildout guide is choosing footprint over near-term margin. That is a strategy statement, and it raises the stakes on the visit line, because 250 more shops need customers, not just higher tickets.
What did the stock do?
Shares fell 18.2% in after-hours trading to $35.92, per StockStory's snapshot published at 4:46 PM ET. That price sits just above the $34 bear case value in our October 6 report, which graded Dutch Bros 74/100 Positive with a competition watch and fiscal 2029 scenario values of bear $34, base $68, and bull $95, at a $40.44 reference price. After hours, the market is pricing the name roughly at the bear case for 2029 earnings power, on a quarter in which revenue grew 29.8% and adjusted EBITDA grew 29.6% to $101.1M. The punishment is for the guide and the visit line, not for the current P&L.
The competition watch stays where it was. The freshest evidence on that front predates this print: in September, 7 Brew outbid Dutch Bros for Salad and Go at $143M against a $105M final bid, after Dutch Bros set the early pace in that auction. Nothing in this release changes that picture either way.
Does the 74/100 still stand?
Not at full strength. The two named downside triggers in the October research did not fire: system comps stayed positive, and no 2029 target was cut, with 2027 openings raised instead. The thesis is not broken. But three of the six gates failed, and they are the three the score was paying for: traffic-led growth, a 30% contribution margin, and a guide that only moves up. The library proposes 64/100 Selective Positive at the formal research refresh, with the competition watch unchanged, labeled here as proposed rather than final.
What would rebuild the score is visits reaccelerating with ticket still contributing, which is the volume-led comp the October research asked for. What would cut it further is a second straight guide reduction, or visits turning negative. The next checkpoint is the fourth quarter print, and the call transcript grading lands first, in the Friday Weekly Close pass.
Research and opinion, not investment advice. Do your own due diligence before investing.
Frequently asked questions
Did Dutch Bros beat expectations in Q3 2026?
On the headline lines, yes. Revenue of $549.8M rose 29.8% and cleared the roughly $549M bar, and adjusted EPS of $0.25 beat the $0.24 consensus for a fifth straight beat. System same-shop sales of 4.4% landed inside management's guided 4% to 5% range. The problems sat underneath, in visits, shop margin, and the guide.
Why did Dutch Bros cut its full-year EBITDA guidance?
The release pairs the cut with the quarter's cost and mix evidence. Company-operated contribution margin fell to 28.1% as occupancy reached 18.0% of company-operated revenue, and the comp was carried by ticket rather than visits. Management cut adjusted EBITDA guidance to about $380M from $385M to $390M and trimmed the revenue and comp ranges.
Does the DalalBytes score on Dutch Bros change after Q3 2026?
The library proposes a cut from 74/100 Positive to 64/100 Selective Positive at the formal research refresh, labeled here as proposed rather than final. The operating machine passed its gates, but visits decelerated, contribution margin broke the 30% hold condition, and the guide cut is the first fundamental break the research named in advance.
Disclosures
Not financial advice. This article is published for educational purposes only. Nothing here is a recommendation to buy, sell, or hold any security, and nothing here is financial advice. Investing involves risk, including the possible loss of principal.
Positions. The author is long Dutch Bros (BROS). Dutch Bros is an owned position and is researched in the DalalBytes library, most recently in the October 6, 2026 research report graded 74/100 Positive with a competition watch.
Accuracy. This analysis is built from public sources believed to be reliable, including the Dutch Bros Q3 2026 earnings release via Business Wire, the company's Q2 2026 release, the pre-print scorecard graded against that release, consensus figures as reported by Zacks, and after-hours price coverage by StockStory. The earnings call transcript had not been read when this article was published, and no call commentary is included. Errors can occur and facts change; verify independently before acting on anything you read.
No advisory relationship. Reading this site does not create an advisor-client relationship of any kind. See the full disclosures page.