
Frequently asked questions
Is Polycab India (POLYCAB) a buy at current prices?
DalalBytes rates Polycab Selective Positive at 73/100. India's largest wires and cables maker holds 30 to 31% of the organised market, grew FY26 revenue 29% to Rs 28,884 crore with PAT up 32% to Rs 2,708 crore, and carries net cash of Rs 4,520 crore. The deductions are a full multiple of about 36 times trailing earnings at Rs 7,662, growth flattered by copper prices while underlying volumes grow in single digits, and new competition from UltraTech and the Adani group.
What are Polycab's FY2029 price targets?
DalalBytes' FY2029 targets for Polycab are bear Rs 5,900, base Rs 11,300, and bull Rs 14,800, from a Rs 7,662 reference price (NSE close, October 26, 2026). Bear: 10% revenue CAGR, margin slips to about 12%, EPS about Rs 236 at 25 times. Base: 18% CAGR, margin holds at 13.5 to 14%, EPS about Rs 330 at 34 times. Bull: 24% CAGR, margin toward 15%, EPS about Rs 370 at 40 times.
What is the verdict on Polycab?
Business quality grades in the low 80s: the share leader by a factor of three over KEI, a public Project LEAP target of Rs 20,000 crore of FY26 revenue beaten by 44% (Rs 28,884 crore delivered), return on equity of 24 to 25%, a net cash balance sheet, and an FMEG segment that has crossed into real profitability (EBIT margins of 8.0% in Q1 FY27 and 10.1% in Q2 FY27). Three deductions bring it to 73: a full 36 times multiple, underlying volume growth in single digits while reported growth is substantially a copper price, and a home market that has just admitted UltraTech and the Adani group as competitors. The 24% fall from the Rs 10,126 high has removed the most extreme part of the price.
How did Polycab start?
The Jaisinghani family's Sind Electric Stores, an electrical goods shop in Lohar Chawl, Mumbai, dates to 1964. Inder T. Jaisinghani, who left school at 15 in 1968 after his father's sudden death, took over the shop, moved the family from trading wires to making them (Polycab Industries, Halol, 1983), and incorporated Polycab Wires Private Limited on January 10, 1996. The founding bet was backward integration: conductor, compounding and drawing in-house, plus a copper rod joint venture with Trafigura (Ryker Base) in Gujarat. IFC invested about Rs 400 crore in 2009. EPC followed in 2009 and FMEG in 2014. Polycab listed in April 2019, its IPO subscribed about 52 times, already the market leader. Organised share has since risen from 18 to 19% in FY19 to 30 to 31% in FY26.
What does Polycab sell, technically?
Specification cable, from single-core PVC building wire and green wires up through XLPE and rubber insulated power cables, shielded instrumentation cables, solar DC cables rated for 25 years outdoors, and extra high voltage cables where partial-discharge testing decides who qualifies. Three segments report: wires and cables at Rs 25,179 crore in FY26 (up 33%, about 87% of revenue, exports to 94 countries at 5.4% of group revenue); FMEG (fans, LED lighting, switches and switchgear, solar, conduits) at Rs 2,069 crore (up 25%), now profitable; and EPC at a 13% revenue decline in FY26 on project timing, at a 9.9% EBIT margin. Management estimates data centre construction at roughly Rs 3.5 crore of cable demand per megawatt. The footprint is 26 manufacturing facilities, 3,900 plus dealers and 1,90,000 plus retail outlets.
Has management delivered on its roadmap?
| Project Spring commitment | Target | Delivered by H1 FY27 | Grade |
|---|---|---|---|
| Capex | Rs 6,000 to 8,000 crore over five years | FY26 capex Rs 1,480 crore, the highest ever | Met, on pace |
| Market share | Grow at about 1.5 times the industry rate | Share 26 to 27% (FY25) to 30 to 31% (FY26) | Beaten in FY26 |
| International | Exports from about 5% to 10% of revenue by FY30 | 5.4% in FY26; Q1 FY27 international revenue down 13% | Pending, behind pace |
| FMEG | Profitable, premium-led, 1.5 to 2 times industry growth | Q1 FY27 revenue up 71% at 8.0% EBIT margin; Q2 more than doubled at 10.1% | Beaten so far, low base |
| Margins | W&C EBITDA margin 11 to 13% medium term; FMEG 8 to 10% by FY30 | Group EBITDA margin 13.9% in FY26, 14.1% in H1 FY27 | Met |
| Dividend payout | Above 30% by FY30 | 27.2% in FY26, up from 26.3% | On pace |
Project LEAP, the earlier programme, promised about Rs 20,000 crore of revenue by FY26 and delivered Rs 28,884 crore. After the record Q2 FY27 (revenue up 53%), management did not raise guidance and restated the medium-term margin frame. That is graded as a credibility positive and a momentum negative; both readings are true.
What do Polycab's financials show?
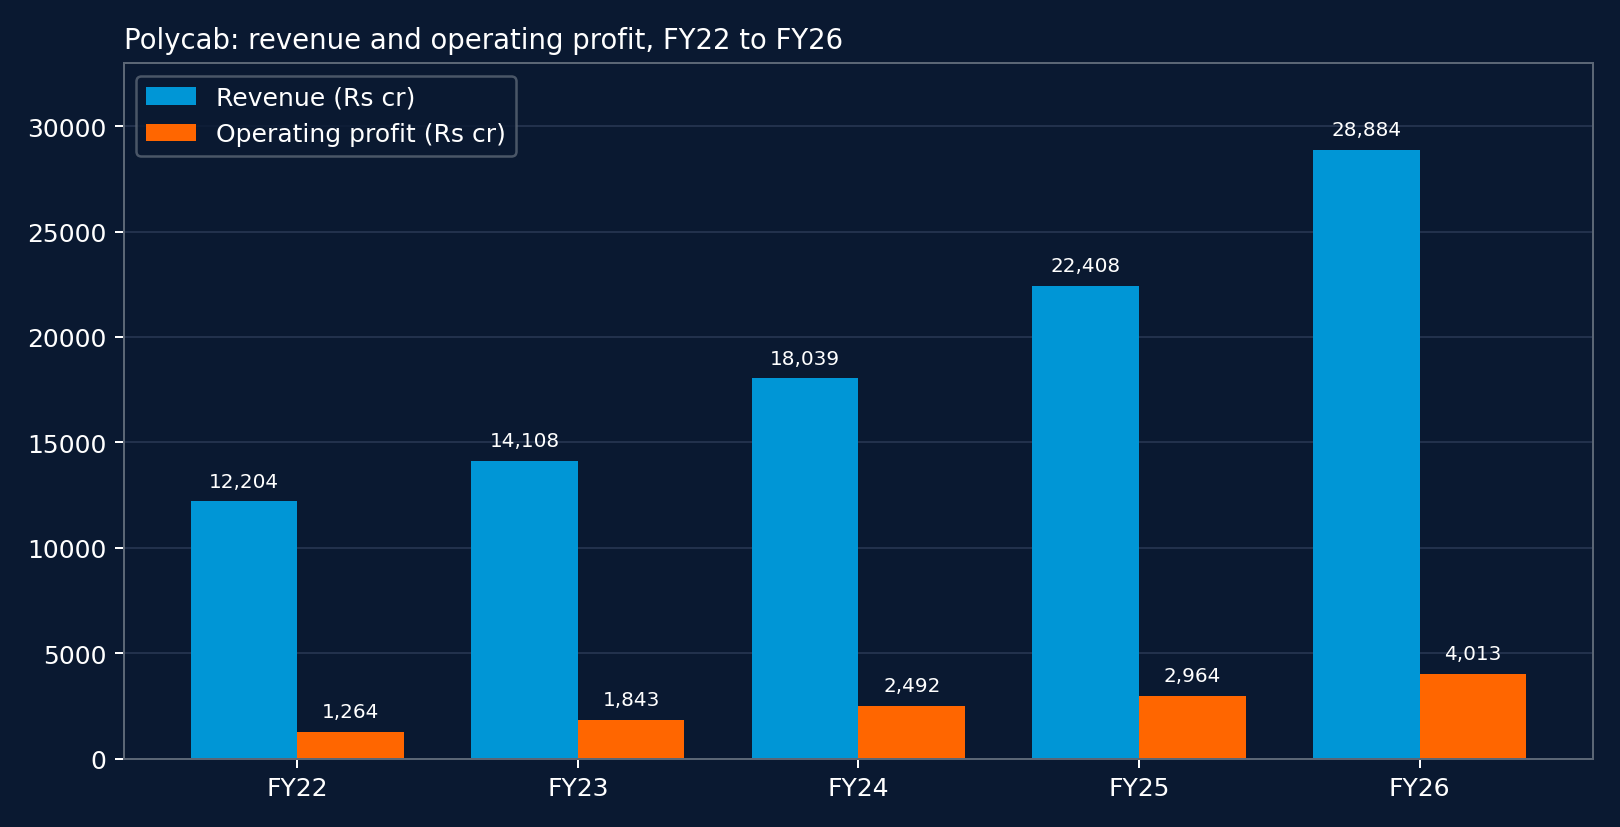
| Fiscal year | Revenue (Rs cr) | Operating profit (Rs cr) | Operating margin | PAT (Rs cr) | EPS (Rs) | Operating cash flow (Rs cr) |
|---|---|---|---|---|---|---|
| FY22 | 12,204 | 1,264 | 10% | 917 | 60.80 | 461 |
| FY23 | 14,108 | 1,843 | 13% | 1,282 | 84.80 | 1,452 |
| FY24 | 18,039 | 2,492 | 14% | 1,803 | 118.75 | 1,292 |
| FY25 | 22,408 | 2,964 | 13% | 2,046 | 134.28 | 1,803 |
| FY26 | 28,884 | 4,013 | 14% | 2,708 | 177.48 | 3,747 |
| H1 FY27 | 18,109 | 2,559 (EBITDA) | 14.1% | 1,787 | n.v. | n.v. |
Screener.in consolidated series via public mirrors, October 26, 2026; FY26 EBITDA per the company release is Rs 4,006 crore and reported PAT Rs 2,708 crore (some summaries print Rs 2,672 crore attributable). Q2 FY27: revenue Rs 9,899 crore (up 53%), EBITDA Rs 1,423 crore at 14.4% (versus 15.8% a year earlier), PAT Rs 990 crore (up 43%); segments: wires and cables Rs 8,301 crore at a 14.2% EBIT margin, FMEG Rs 993 crore at 10.1%, EPC Rs 617 crore at 7.2%.
How strong are the balance sheet and cash flow?
Fortress on leverage, appetite on working capital. Net cash was Rs 4,190 crore at March 2026 and Rs 4,520 crore at September 30, 2026, against borrowings of about Rs 272 crore (debt to equity of about 0.02) and net worth of about Rs 12,006 crore. The soft spot is conversion: operating cash flow was Rs 461 crore in FY22 against PAT of Rs 917 crore, and Rs 1,292 crore in FY24 against PAT of Rs 1,803 crore, because growth eats copper inventory and institutional receivables. FY26 was the best conversion year in the series (operating cash flow of Rs 3,747 crore against PAT of Rs 2,708 crore), leaving roughly Rs 2,270 crore of free cash flow after record capex of Rs 1,480 crore. Management guides working capital days back up to 45 to 50 days. The dividend was Rs 47 a share for FY26, a 27.2% payout on the guided path above 30% by FY30.
Who runs Polycab, and is governance clean?
Founder Inder T. Jaisinghani is Chairman and Managing Director, the second generation (Bharat and Nikhil Jaisinghani) holds executive roles, and Gandharv Tongia is CFO. Promoters held 61.44% in September 2026, institutions about 26% and the public about 12.6%, with no pledging reported. The said-versus-did record is strong on revenue, capex and payout, and behind on one leg: exports at 5.4% of revenue in FY26 against a 10% FY30 target, with international revenue down 13% in Q1 FY27 on Middle East disruption before growth resumed in Q2.
Who competes with Polycab?
| Company | FY26 position | FY26 revenue (Rs cr) | FY26 PAT (Rs cr) | Approx. P/E, Oct 2026 |
|---|---|---|---|---|
| Polycab | Organised leader, about 30 to 31% share | 28,884 | 2,708 | About 36x |
| KEI Industries | Number two in cables, about 11% share | 11,748 | 918 | About 34 to 37x |
| RR Kabel | About 8% share, retail wires strength | 9,722 | 492 | About 40 to 42x |
| Finolex Cables | About 6% share, plus optical fibre | 6,321 | 714 | About 21 to 22x |
| UltraTech (Ultravolt) | New entrant, production started September 2026 | Startup phase | n.a. | n.a. |
Polycab out-earns every listed rival on margin (group EBITDA margin of 13.9% in FY26 against KEI cables at about 11.6%, RR Kabel near 8.9% and Finolex near 9.6% in broker tables) and out-grows them (FY23 to FY26 revenue CAGR of 26% against KEI at 22% and RR Kabel at 21%). The marginal rival has changed, though: UltraTech began commercial production in September 2026 at an 11 lakh km Gujarat plant, with Rs 1,800 crore committed (Rs 888 crore spent by June 2026), Hindalco metal inside the same group and India's largest building materials dealer network. Broker estimates put UltraTech at 5 to 6% industry share by FY30 if it executes. The Adani group is entering through Praneetha Ecocables under Kutch Copper.
What is Polycab worth?
At Rs 7,662: about 36 times trailing earnings (P/E 36.09, India Infoline, October 26, 2026; TTM EPS about Rs 210 after H1 FY27), about 8.7 times book value, about 4.0 times FY26 sales, market cap about Rs 1,15,471 crore, 24% below the 52-week high of Rs 10,126 and down about 16.7% over three months. KEI trades at a similar multiple with lower returns and no FMEG engine; Finolex is the value outlier at about 21 times with a stuck margin. After Q4 FY26, Motilal Oswal's target was Rs 9,800 (40 times FY28 estimated earnings) and JM Financial's Rs 9,700 (42 times); a September 2026 broker summary flagged sector stocks at a premium to five-year average multiples, with Polycab named the most susceptible to tapering growth and peaking margins. FY2029 scenarios: bear Rs 5,900, base Rs 11,300, bull Rs 14,800.
What are the key risks for Polycab?
Volume first: Q1 FY27 domestic volume growth was low-to-mid single digits while revenue grew 43% domestically, so a copper fall reverses the optics even with healthy volumes. Competition second: UltraTech's network and group metal, plus Adani's entry, attack the wires and retail end of the moat, while cables and qualification lists (70 to 75% of Polycab's mix is cables, per Jefferies) are harder to copy. Margin third: material costs were 76.4% of sales in Q2 FY27 and contribution margin fell to 23.6% from 27.1%, leaving little room for a pricing war. Then working capital normalisation to 45 to 50 days, EPC government receivables, and the Asier Metals matter, reserved for order at the NCLAT after an October 15, 2026 hearing and treated here as an unquantified contingency. Q3 FY27 results in January 2027 are the next checkpoint.
© 2026 DalalBytes Research · For educational purposes only. Not investment advice.