
Frequently asked questions
Is Page Industries (PAGEIND) a buy at current prices?
DalalBytes rates Page Industries Selective Positive at 67/100. FY26 revenue rose 6.3% to Rs 5,247 crore with a 22.0% EBITDA margin, PAT of Rs 764 crore and return on equity of 52.5%, and borrowings excluding leases are about Rs 12 crore. The deductions are a 3-year sales CAGR of about 4%, Q1 FY27 PAT down 4.0% to Rs 193 crore on input costs, a Jockey licence documented to the end of 2030 with a reported 2040 extension not confirmed in filings reviewed, and a price of about 51.5 times FY26 reported earnings at Rs 35,280.
What are Page Industries' FY2029 price targets?
DalalBytes' FY2029 targets (year ending March 2029) are bear Rs 23,000, base Rs 39,200 and bull Rs 51,800, from a Rs 35,280 reference price (NSE close, November 3, 2026). Bear: 7% revenue CAGR, EPS about Rs 721 at 32 times. Base: 11% CAGR, EPS about Rs 933 at 42 times. Bull: 14% CAGR, EPS about Rs 1,080 at 48 times. No FY29 broker consensus exists, so these are DalalBytes scenarios.
When does the Jockey licence held by Page Industries expire?
The documented renewal from 2010 runs through the end of calendar 2030. Secondary sources report an extension to 2040, but no exchange filing or annual report extract confirming the 2040 date or its terms was retrieved for this report, and royalty of about 5% of sales is not formally disclosed at its current rate.
What is the verdict on Page Industries?
Page Industries runs the finest innerwear business in India and does not own the name on the label. As Jockey's exclusive licensee it earns a 22.0 percent EBITDA margin and a 52.5 percent return on equity in FY26, numbers no listed rival comes close to, on a distribution network of 116,600 multi-brand outlets and 1,615 exclusive brand stores that no rival matches either. The balance sheet cannot be forced: borrowings excluding leases are about Rs 12 crore against cash and bank balances of about Rs 432 crore. That is the quality case, and it is real.
The deduction is the growth and the rent. Revenue grew 6.3 percent in FY26 after falling 3.1 percent in FY24, the USD 1 billion by 2026 aspiration set in October 2021 was missed by about 40 percent, and Q1 FY27 printed volume growth of 5.7 percent against a full-year guide of double-digit volume and mid-teens value growth, with PAT down 4.0 percent on cotton and synthetic costs. The brand itself is rented: the documented licence term runs to the end of 2030, a reported extension to 2040 was not confirmed in any filing reviewed for this report, and royalty of about 5 percent of sales is not formally disclosed at its current rate. At Rs 35,280 the stock trades at about 51.5 times FY26 reported earnings for that growth record. The business grades in the 80s. The price and the trajectory grade in the 50s. The blend is selective.
What would change the score: two straight quarters of double-digit volume growth with the EBITDA margin inside the 19 to 21 percent band would lift the score toward 75, and a primary-source confirmation of the licence extension to 2040 on unchanged royalty terms would remove the largest single deduction. A second year of single-digit growth, or any disclosed royalty step-up, would cut it toward 58.
Reference price: Rs 35,280 (NSE close, November 3, 2026, a trading day). Market cap about Rs 39,351 crore. 52-week range Rs 29,800 to Rs 43,855. The stock is down about 13 to 14 percent over one year and trades below its 50-day average of about Rs 36,177 and its 200-day average of about Rs 37,447 on aggregator data.
FY2029 targets: Bear Rs 23,000 / Base Rs 39,200 / Bull Rs 51,800. See Section 16 for assumptions.
What is Page Industries at a glance?
| Item | Detail |
|---|---|
| Company | Page Industries Ltd, Bengaluru, India |
| Incorporated | 15 November 1994 (CIN L18101KA1994PLC016554); operations and first store in 1995 |
| Listed | NSE/BSE, March 2007; IPO price Rs 360 |
| Business | Exclusive licensee of Jockey (manufacture, distribution, marketing) and of Speedo in India |
| Brands | Jockey (about 99 percent of revenue on a FY24 secondary split); Speedo (about 1 percent) |
| Segment reporting | Single segment under Ind AS; no subsidiary, associate or joint venture at June 2026 |
| FY26 revenue | Rs 5,247 cr (+6.3 percent); Q1 FY27 Rs 1,420 cr (+7.9 percent) |
| FY26 PAT | Rs 764 cr (+4.8 percent); Q1 FY27 Rs 193 cr (-4.0 percent) |
| FY26 EBITDA margin | 22.0 percent; guided band 19 to 21 percent for FY27 |
| Balance sheet | Borrowings about Rs 12 cr excluding leases (Rs 277 cr including leases); cash and bank balances about Rs 432 cr |
| Promoters | 42.89 percent (September 2026), no pledging disclosed in sources reviewed |
| Latest result | Q1 FY27, declared August 13, 2026. Q2 FY27 is due November 12, 2026 and had not been declared at the report date |
How did Page Industries start?
The Genomal family's link to Jockey starts in 1959 in the Philippines, where the family manufactured Jockey apparel as sole licensee. When Jockey looked to re-enter India after liberalisation in 1993 and 1994, it chose the family it already knew. Sunder Genomal and his brothers Nari and Ramesh founded Page Industries, incorporated in Bengaluru in November 1994, with commercial operations and the first Jockey store in India in 1995.
The insight was simple and contrarian for its time. Innerwear in India in 1995 was a low-involvement purchase sold loose at the counter. Page built it as a premium branded category, with packaged product, consistent fit, advertising, and eventually its own stores. Jockey International named Page its Licensee of the Decade for 2000 to 2010, and Page is described in broker and company sources as Jockey's largest licensee in the world by revenue and royalty contribution.
The IPO came in March 2007 at Rs 360 per share. The three decades since incorporation hold one strategic constant: Page has never tried to become a house of brands. It runs one great licence at full intensity, added Speedo in 2011 as a small second licence, and stated in August 2026 that it may add only one new brand licence in a decade. That focus built the economics in Section 7. It also built the concentration in Section 15.
What does Page Industries sell, technically?
• The product is fit consistency at scale. Innerwear is a repeat-purchase category where a sizing or elastic failure ends the relationship. Page protects that promise with manufacturing control (Section 6) rather than with marketing alone.
• Categories. Innerwear, loungewear, sleepwear, athleisure and activewear, socks, thermals, towels, handkerchiefs and accessories, for men, women and kids, plus Speedo swimwear and swim equipment.
• No official mix exists. Page reports a single segment and publishes no revenue split by product, gender or channel. Any precise mix in circulation has no company source. This report uses management penetration figures instead, which are disclosed.
• Penetration is the sizing tool. Management put men's innerwear penetration at about 20 percent of the total addressable market in August 2026, gaining historically 0.25 to 0.5 percent of the market a year, and women's innerwear penetration at only 7 to 8 percent.
• Geography mix. About 40 percent of revenue is Metro and Tier 1 and about 60 percent is Tier 2 and Tier 3, per management in August 2026. Tier 2 and Tier 3 continue to outperform metros.
• Brand preference. Jockey's Most Preferred Brand score and top-of-mind awareness for men's innerwear were both about 55 percent in the September 2025 CEO interaction, the highest recorded in that series.
Sub-brands and collections
• JKY Groove (verified). A fashion-focused youth sub-brand centred on trend-driven athleisure and street fashion. Pilot launched in May 2025 with 14 SKUs, largely priced below Rs 1,000, in about 52 exclusive stores plus the Jockey website. By August 2026 management expected Groove to add incremental growth in FY27.
• Next Gen Inno-Wear (verified). A men's innerwear collection spotlighted in May 2026, framed around performance-led innerwear. A collection, not a separate brand.
• Price architecture. Core Jockey sits in premium and super-premium tiers. Groove sits deliberately below core athleisure pricing to buy relevance with younger buyers.
What are the terms of the Jockey licence?
The licence is the business. Its terms therefore get their own section, with the verification status stated plainly.
| Item | Status |
|---|---|
| Rights | Exclusive manufacture, distribution and marketing of Jockey; territory in the October 2025 company release covers India, Sri Lanka, Bangladesh, Nepal, Oman, Qatar, Maldives, Bhutan, Bahrain, Kuwait, Saudi Arabia and UAE |
| Documented renewal | Renewed in 2010 for 20 years through the end of calendar 2030; UAE rights were added at that renewal |
| Reported extension | Secondary sources (Groww, Trade Brains, Kotak Neo) report an extension to 2040. No exchange filing or annual report extract confirming the 2040 date or its terms was retrieved for this report |
| Royalty | About 5 percent of net sales per management and secondary sources over many years. The current rate is not formally disclosed and no audited absolute royalty figure was retrieved. At FY26 revenue, 5 percent would imply about Rs 262 crore (derived estimate, not a disclosure) |
| Escalation | No step-up schedule or escalation clause is public in sources reviewed. Absence of disclosure is the finding |
| Speedo | Exclusive India licence effective July 1, 2011; about 1 percent of revenue in FY24 on a secondary split |
Page does not call the licence perpetual and neither does this report. The documented pattern is long fixed terms with renewals. A royalty step-up of 1 percent of sales would cost about Rs 52 crore at FY26 revenue, about 7 percent of FY26 PAT (derived sensitivity). Renewal economics are a licensor-controlled event, and they sit behind every number in this report.
How wide is Page's distribution?
| Channel | Latest full statement |
|---|---|
| Exclusive brand stores | 1,615 at Q4 FY26 (call, May 21, 2026); 1,600-plus in August 2026 |
| Multi-brand outlets | 116,600-plus at Q4 FY26 |
| Large format stores | 893 at Q4 FY26 |
| Cities | About 2,715 (September 2025 interaction) |
| EBO plan | Add 120 to 150 stores a year for 3 to 5 years; 70 of the last 150 were in first-time towns |
| General trade plan | Add 8,000 to 10,000 net new outlets a year, plus a dedicated rural vertical |
• E-commerce. No audited channel share is disclosed. Management states Page leads across e-commerce platforms, that e-commerce grew strongly in Q4 FY26, and that quick commerce is the fastest-growing leg inside e-commerce, with dark-store stocking lifting metro sales. A precise online share is not printed here because no company source states one.
• Auto Replenishment System. The ARS has largely stabilised after about 2.5 to 3 years, normalising channel inventory and reducing quarter-end frontloading. That structurally moderates reported primary growth in individual quarters.
• Consumer data platform. A first-party data platform built from stores and the online portal was near completion in August 2026, with direct-to-consumer pilots to follow. Status at the report date: in rollout.
• GCC entry. Management plans a full-fledged Gulf entry in Q2 to Q3 FY27, including Saudi Arabia, Kuwait, Bahrain and Qatar, using the existing manufacturing backend. No launch release was found at the report date, and the geography carries live litigation (Section 15).
How does Page manufacture?
| Item | Detail |
|---|---|
| Units | 16 manufacturing units over 2.9 million sq ft across Karnataka, Tamil Nadu and Odisha (FY25 base) |
| In-house share | Over 70 percent per company presentation; brokers cite about 80 percent |
| Capacity | 280 million pieces a year (company presentation) |
| Workforce | About 22,000 on the presentation basis, about four-fifths women |
| New in FY26 | K.R. Pete (Karnataka) and Cuttack (Odisha) inaugurated and producing; Cuttack also started socks and elastic |
| Planned | K.R. Pete Phase 2 for elastic; a new innerwear facility at Khordha, Odisha, planned operational by FY2028-29 |
| Odisha economics | Capital incentives of about Rs 50 crore expected, mainly in FY27; management expects stable operations and cost benefits from January 2028, and calls Odisha a drag until then |
The eastward shift is a labour decision. Bengaluru-area wages keep rising, the model employs about 22,000 people, and the new labour codes already cost a Rs 35 crore exceptional charge in FY26. Odisha buys lower labour cost and incentives at the price of a two-year ramp. Management's own timeline says no benefit should be modelled before January 2028.
What do the financials show?
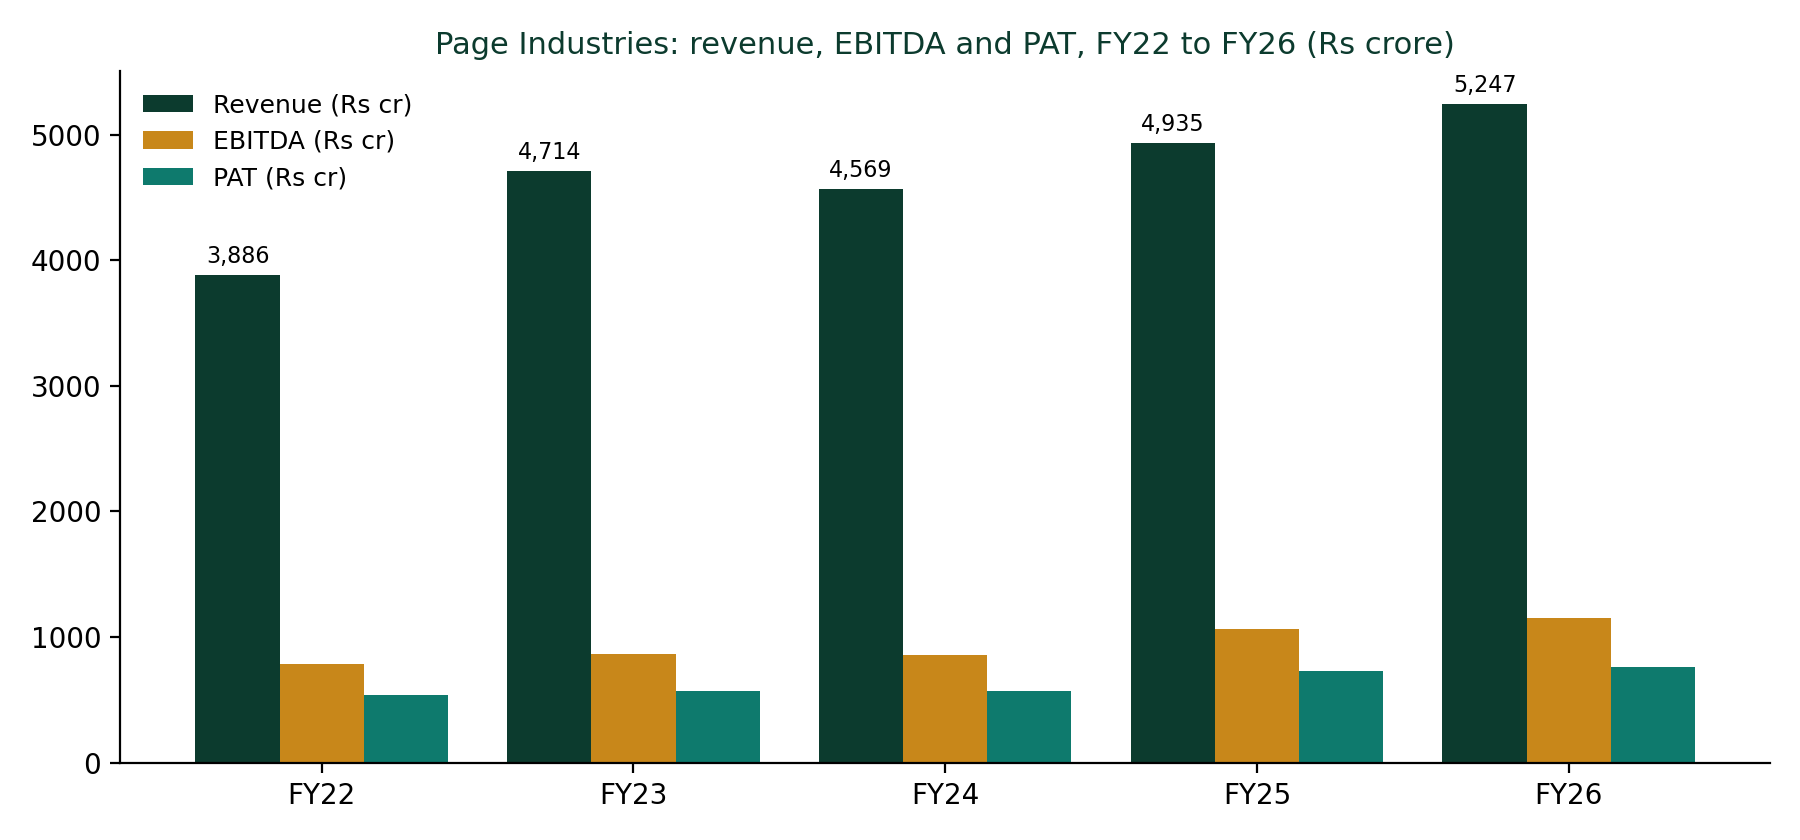
| Year | Revenue (Rs cr) | YoY | EBITDA (Rs cr) | EBITDA margin | PAT (Rs cr) | EPS (Rs) | DPS (Rs) |
|---|---|---|---|---|---|---|---|
| FY22 | 3,886 | n.a. | 787 | 20.3 percent | 537 | 481.02 | 370 |
| FY23 | 4,714 | +21.3 percent | 861 | 18.3 percent | 571 | 512.15 | 250 |
| FY24 | 4,569 | -3.1 percent | 860 | 18.8 percent | 569 | 510.30 | 370 |
| FY25 | 4,935 | +8.0 percent | 1,063 | 21.5 percent | 729 | 653.70 | 900 |
| FY26 | 5,247 | +6.3 percent | 1,153 | 22.0 percent | 764 | 684.80 | 550 |
• Read the arc in two halves. FY22 to FY23 was the last volume-led surge. FY24 was a demand year to forget, with revenue down 3.1 percent. FY25 and FY26 recovered the margin (18.8 to 22.0 percent) without recovering the growth (8.0 and 6.3 percent).
• FY26 PAT is after a charge. Reported PAT of Rs 764 crore includes a Rs 35 crore exceptional charge for the new labour codes. Adjusted PAT on the broker basis is about Rs 799 crore, EPS about Rs 716.2.
• The pricing trade explains the shape. Page held prices flat for four years to August 2026, cutting its relative price gap against economy brands from 30 to 35 percent to 20 to 25 percent, then took a calibrated hike of about 2.5 percent in January 2026 and 2.2 percent in May 2026. Volume was defended first. Realisation followed later.
• Return ratios stay elite. ROE was 52.5 percent in FY26 on one audited series. ROCE reads 73.6 percent, 64.4 percent or 48.0 percent depending on the provider definition, so this report quotes the source with the number and never blends them.
Latest quarters
| Quarter | Revenue (Rs cr) | YoY | EBITDA margin | PAT (Rs cr) | Volume |
|---|---|---|---|---|---|
| Q2 FY26 | 1,291 | +3.6 percent | 21.7 percent | 195 | 56.6 mn pieces, +2.5 percent |
| Q3 FY26 | 1,387 | +5.6 percent | n.a. | 190 | Not extracted |
| Q4 FY26 | 1,253 | +14.1 percent | 20.8 percent | 179 | 54.5 mn pieces, +10.8 percent |
| Q1 FY27 | 1,420 | +7.9 percent | 20.3 percent | 193 | 61.9 mn pieces, +5.7 percent |
• Q1 FY27 missed consensus. Revenue of Rs 1,420 crore was 5.6 percent below the MNCL consensus, EBITDA 11.0 percent below, and adjusted PAT 14.2 percent below.
• The Q1 FY27 margin hit was inputs. Raw material cost rose 12.9 percent year on year, gross margin fell 190 bps to 57.2 percent, and EBITDA margin fell about 200 bps to 20.3 percent. Management said about 3 days of billing went undelivered in a logistics transition and should partly land in Q2 FY27, with secondary sales stronger than primary.
• Guidance held anyway. After Q1 FY27, management maintained double-digit volume growth for FY27 and an EBITDA margin band of 19 to 21 percent, and guided marketing spend at 4 to 5 percent of sales.
How strong are the cash flow and the balance sheet?
| Metric (Rs cr) | FY22 | FY23 | FY24 | FY25 | FY26 |
|---|---|---|---|---|---|
| Operating cash flow | 327 | About nil | 1,080 | 1,204 | 794 |
| Capex (approx.) | 98 | 166 | 96 | 80 | 107 |
| Free cash flow | 229 | -167 | 984 | 1,124 | 687 |
• Conversion is strong on average and volatile year to year. Five-year free cash flow totals about Rs 2,857 crore against cumulative PAT of about Rs 3,170 crore, about 90 percent conversion. FY23 is the warning year: PAT of Rs 571 crore produced about nil operating cash flow because working capital absorbed about Rs 678 crore.
• FY26 cash fell back. Operating cash flow dropped from Rs 1,204 crore to Rs 794 crore on higher traded-goods purchases and an inventory build. Inventories rose from Rs 859 crore at March 2025 to Rs 1,056 crore at March 2026. Management said inventory days improved inside Q1 FY27, from 73 days at the start of the quarter to 66 days at the end on its definition.
• The payout is the capital allocation. Dividend payout was 77 percent in FY22, 49 percent in FY23, about 72 to 73 percent in FY24, 138 percent in FY25 and 80 percent in FY26. The FY25 distribution of Rs 900 per share exceeded the year's earnings and reserves fell from Rs 1,586 crore to Rs 1,396 crore. No buyback was identified in sources reviewed; returns are dividends only.
• The fortress is real but thin by design. Net worth is about Rs 1,503 crore. Page pays out so much that its equity base stays small, which is exactly why ROE prints above 50 percent. That is a policy choice, not an accident, and it leaves the licence and the cash flow, not a cash pile, as the protection.
Who does Page compete with?
India's innerwear market was estimated by IMARC at USD 10.9 billion in 2025, growing to USD 19.8 billion by 2034 at a 6.49 percent CAGR. Organised share was about 40 percent on a 2021 broker estimate, with the unorganised segment still the majority by volume. The category grows at high single digits. It does not grow at the rate Page's multiple implies.
| Company | FY26 revenue (Rs cr) | FY26 growth | Margin | FY26 PAT (Rs cr) | P/E at Nov 2 to 3, 2026 |
|---|---|---|---|---|---|
| Page Industries | 5,247 | +6.3 percent | EBITDA 22.0 percent | 764 | About 50 to 52x |
| Lux Industries | 2,929 | About +13 percent | Operating margin about 5.1 percent | 106 | About 33x |
| Dollar Industries | 1,881 | About +10 percent | Operating margin 8.6 percent | 107 | About 12.5x |
| Rupa and Company | 1,259 | +1.6 percent | EBITDA 9.2 percent | 73 | About 13x |
| VIP Clothing | 254 | +7.2 percent | n.a. | 10 | n.a. |
• Page is 1.8 times Lux, 2.8 times Dollar and 4.2 times Rupa by revenue, and earns a PAT margin of 14.6 percent against about 4 to 6 percent at the value peers. The value peers pay no 5 percent royalty and still earn far less. That gap is the premium licence economics, quantified.
• The value peers had a hard cycle too. Rupa's FY26 PAT of Rs 73 crore sits far below its FY22 level, and Lux margins compressed sharply from FY22 to FY25 on the series reviewed. FY24 to FY26 was a category downturn, not only a Page slowdown.
• The sharper contest is relevance, not price. Van Heusen innerwear, Zivame in women's (sub-Rs 200 crore scale on inconsistent aggregator data, flagged), D2C brands such as XYXX, and retailer private labels compete where Page is growing into: women's, athleisure and younger buyers. No verified revenue was retrieved for Dixcy, Hanes India or XYXX, so none is quoted.
• Management's own read. Competitive intensity in men's general trade has eased versus three years ago as smaller players exited, new entrants are largely private labels in organised retail, and on marketplaces the number two player rotates while Jockey holds leadership. That is management's characterisation, presented as such, and Page tracks shelf share rather than syndicated share data.
What are Page's strengths?
1. Elite unit economics: 22.0 percent EBITDA margin, 52.5 percent ROE and about 90 percent five-year cash conversion in a basic consumer category.
2. Distribution density no rival matches: 116,600-plus outlets, 1,615 exclusive stores and 893 large format stores, with stores doubling as brand media.
3. Manufacturing control: over 70 percent in-house across 16 units and 280 million pieces of capacity, with backward steps into elastic and socks.
4. Demonstrated pricing discipline: four years of price restraint narrowed the premium gap and defended volume, and margins still beat the guided band in FY25 and FY26.
5. Runway inside the same brand: women's penetration at 7 to 8 percent, athleisure, kids, socks and towels, and Tier 2 and Tier 3 at 60 percent of revenue growing faster than metros.
6. Cash return: payout at or above about 80 percent in FY26, with a first interim of Rs 200 per share already declared for FY27.
What are Page's weaknesses?
1. Single-brand, single-licence concentration: about 99 percent Jockey, one segment, and a stated intent to add at most one licence a decade. There is no second engine.
2. Growth has slowed structurally: 3-year sales CAGR of about 4 percent on the Screener series, against an 11 percent decade CAGR to FY26. The recovery so far is margin-led, not volume-led.
3. No disclosed segment or channel economics: investors cannot verify women's, athleisure, store or online profitability from filings.
4. Promoter holding has drifted down for a decade, from 49.01 percent in FY18 to 42.89 percent, with recurring small insider sales and no insider buys in the aggregator windows reviewed.
5. Labour intensity: about 22,000 workers, a Rs 35 crore labour-code charge in FY26, and an Odisha benefit that management dates to January 2028.
6. Working capital volatility: FY23 operating cash flow was about nil and FY26 inventories rebuilt to Rs 1,056 crore. Light-asset is not the same as light-working-capital.
How good is the management and governance?
Two orderly successions in four years is the headline. Vedji Ticku, CEO for over two decades, resigned effective May 31, 2021. V.S. Ganesh, who joined in June 2014 to run manufacturing and operations, became CEO in June 2021 and Managing Director in June 2022. Sunder Genomal stepped down as Managing Director in May 2022 and continues as Non-Executive Chairman, describing his role as mentor and sounding board. Karthik Yathindra, a sales and marketing insider of about nine years and previously at Titan, became CEO on April 1, 2025. Shamir Genomal is Deputy Managing Director. Deepanjan Bandyopadhyay is CFO.
The structure is professionalised operations under promoter oversight. No family member holds the MD or CEO operating job, and the family retains the chair, the deputy MD role and board seats. The board list includes independent directors, though this report does not claim an independence ratio without the FY26 governance section in hand. The FY26 Directors Report states there was no materially significant related-party transaction that may conflict with the company's interest, and that related-party transactions were at arm's length in the ordinary course with audit-committee approval. A statutory auditor change to Walker Chandiok for five years was recommended at the Q4 FY26 results.
Capital allocation grades well on discipline and poorly on ambition. Capex guided at about Rs 140 crore for FY26 against interim dividends of Rs 669 crore on the annual report line tells the story: the business is run to return cash, not to build a second leg. Shareholders who want diversification must do it themselves.
What did management promise, and what arrived?
| Plan | Set | Verdict |
|---|---|---|
| USD 1 billion company by 2026, growing 2.5 to 2.75 times from FY21 sales of Rs 2,833 cr | October 2021, CEO to PTI | Missed. FY26 revenue of Rs 5,247 cr is about USD 0.60 to 0.63 billion, about 60 percent of the target and 1.85 times FY21 |
| Double exclusive stores from 1,000 (2021) | October 2021 | Partial. 1,615 by Q4 FY26, up 61.5 percent; the current 120 to 150 a year plan reaches 2,000 around FY29 to FY30 |
| EBITDA margin band of 19 to 21 percent | Repeated guidance | Beaten. FY25 about 21.5 percent, FY26 about 22.0 percent, Q1 FY27 20.3 percent inside the band |
| Near double-digit growth for FY26 | Q2 FY26 call, November 2025 | Missed. FY26 grew 6.3 percent; H1 FY26 grew 3.3 percent before a strong Q4 |
| FY26 capex of about Rs 140 cr for Odisha and K.R. Pete | Q2 FY26 call | Delivered on assets. Both plants were inaugurated and producing in FY26; the final audited spend figure was not extracted |
| Double-digit volume and mid-teens value growth for FY27 | Q1 FY27 call, August 2026 | Pending and behind. Q1 printed volume +5.7 percent and revenue +7.9 percent, with about 4 points of volume attributed to a delivery delay |
| Full-fledged GCC entry in Q2 to Q3 FY27 | August 2026 interaction | Pending. No launch release found at the report date; the live Gulf fact is litigation (Section 15) |
| Odisha cost benefits from January 2028; Khordha plant by FY2028-29 | August 2026; FY26 Directors Report | Pending, long dated. Odisha is a stated drag until then |
The audit pattern matters more than any single line. Page delivers the things it controls at the plant and the margin line, and misses the things that depend on the consumer. The $1 billion miss was not a rounding error: the company promised 2.5 to 2.75 times growth and delivered 1.85 times. Against that record, the FY27 guide of double-digit volume and mid-teens value growth should be treated as an aspiration to be graded quarter by quarter, starting with the Q2 FY27 print on November 12, 2026, and not as a base case handed down by management.
How is Page valued against peers?
At Rs 35,280: P/E of 50.4 to 52.3 times on provider TTM cuts (51.5 times on FY26 reported EPS of Rs 684.80), forward P/E of about 44.8 times, EV/EBITDA of about 34 times TTM (derived), price to sales of 7.35 times TTM, price to book of 26.2 times, dividend yield of 1.56 percent on the Rs 550 FY26 dividend, and a FY26 free cash flow yield of 1.75 percent.
• Against its own history the stock has de-rated. One series puts the average P/E at about 88 times across FY21 to FY25. At about 51 times, the market has already removed a large part of the old premium.
• Against peers it has not. Page trades at roughly 4 times the P/E of Rupa and Dollar and about 1.5 times Lux, while growing slower than Lux and Dollar in FY26 from a much larger base. The premium is for margin, returns and distribution, and it is priced as if the growth repair is already done.
• Broker anchor. Monarch Networth (MNCL) rates the stock Buy with a target of Rs 42,150 at 48 times FY28E EPS of Rs 870.9, modelling revenue of Rs 5,824 crore in FY27E and Rs 6,542 crore in FY28E. An aggregator consensus in early October 2026 showed 25 analysts at Buy consensus with a mean target near Rs 41,896. No FY29 broker consensus exists; the FY29 figures in Section 16 are DalalBytes scenarios, not consensus.
• Context, not comparables. Trent traded at about 84 times earnings on November 3, 2026 and Aditya Birla Fashion was loss-making with no meaningful P/E. They frame the Indian apparel valuation spectrum only. They are not innerwear peers.
What are the risks?
The defining risk is that the crown is rented. One brand is about 99 percent of revenue, the documented licence term ends in 2030, the reported 2040 extension is not primary-verified in this report, and the royalty rate is not formally disclosed at its current level. None of this makes renewal unlikely: Page is Jockey's largest licensee and the relationship dates to 1959 in the Philippines. It does mean the single most important contract in the investment case cannot be fully verified from public sources, and its economics can change at a date the licensor controls.
Demand is the second risk, and FY24 already demonstrated it. Premium innerwear is semi-discretionary, the four-year price freeze was a defensive answer to a narrowing willingness to pay, and a consumption downturn reaches volume first. Input costs are the third: Q1 FY27 showed revenue up 7.9 percent and PAT down 4.0 percent in the same quarter because cotton and synthetics moved faster than a 2.2 percent price hike could follow. Page cannot reprice monthly without breaking the volume strategy, so input spikes land in margin first.
The Gulf file is live and quantified. Former UAE distributor Yellow Flower Trading claimed AED 113.55 million (about Rs 257 to 294 crore in source conversions) plus 9 percent interest, alleging unlawful termination. The Dubai Court dismissed the claim in its current state on September 21, 2026 because the claimant failed to pay a court-ordered expert deposit, and on October 26, 2026 Page disclosed that both parties had filed appeals, Page's centred on jurisdiction. The claim is dismissed procedurally and alive on appeal, in the same geography Page plans to enter directly. The amount claimed equals roughly 35 to 38 percent of FY26 PAT (derived). No provision was reported in sources reviewed.
Labour, fashion and valuation risks complete the set. A 22,000-person workforce carries wage and labour-code exposure that Odisha only mitigates from 2028. Groove and women's fashion add inventory that is less evergreen than core innerwear, in a business whose inventory already rebuilt in FY26. And at about 51 times earnings, the business risk and the multiple risk compound: a second year of single-digit growth would not be met by a forgiving price.
What are the FY2029 price targets?
Built off FY26 reported revenue of Rs 5,247 crore and 1.115 crore shares. Assumptions are explicit and are DalalBytes scenarios, not broker consensus.
Bear Rs 23,000: 7 percent revenue CAGR (the FY24 to FY26 pattern persists, volume repair fails), 19.5 percent EBITDA margin (input costs and Odisha drag bite), PAT margin of 12.5 percent, EPS of about Rs 721, exit at 32 times earnings. FY29 revenue about Rs 6,430 crore, PAT about Rs 804 crore.
Base Rs 39,200: 11 percent revenue CAGR (the MNCL FY27 to FY28 path extended, volume returns to high single digits with price and mix), 21.0 percent EBITDA margin (inside the top of the guided band), PAT margin of 14.5 percent, EPS of about Rs 933, exit at 42 times earnings. FY29 revenue about Rs 7,175 crore, PAT about Rs 1,040 crore.
Bull Rs 51,800: 14 percent revenue CAGR (double-digit volume delivered, women's and athleisure mix lifts realisation, GCC contributes), 22.5 percent EBITDA margin (FY26 margin held with Odisha benefits from 2028), PAT margin of 15.5 percent, EPS of about Rs 1,080, exit at 48 times earnings (the MNCL FY28 multiple). FY29 revenue about Rs 7,775 crore, PAT about Rs 1,205 crore.
Base-case value at Rs 39,200 is about 11 percent above the Rs 35,280 reference price, before dividends of about 1.56 percent a year at the FY26 payout level. That thin cushion for a three-year hold is the whole reason the rating is Selective Positive and not Positive: the buyer at this price needs the base case to arrive on time.
Why does Page Industries matter?
Page is the cleanest test in Indian consumer markets of what a licence can and cannot be. Run with manufacturing control, distribution density and pricing discipline, a rented brand produced returns on equity above 50 percent and margins twice the peer set for three decades. Run into a demand downturn, the same structure shows its limits: no owned brand to fall back on, no second licence of scale, and a growth promise that the consumer declined to fund.
The next three quarters grade the repair. Q2 FY27 on November 12, 2026 is the first clean test of the May price hike and the deferred Q1 billing. After that, the FY27 volume guide, the GCC entry and any primary confirmation of the licence term to 2040 are the three facts that move this score. At 67/100 Selective Positive, the verdict is: own the quality only at a price that admits the growth is unproven and the crown is rented, and Rs 35,280 just barely does.
Sources
• Company filings and results: FY26 audited results and Directors Report (May 21, 2026), Q1 FY27 results and filing coverage (August 13, 2026), Q2 FY26 and Q4 FY26 earnings calls, Q1 FY26 investor presentation, board meeting intimation for Q2 FY27 dated October 30, 2026, Regulation 30 litigation disclosures (September to October 2026)
• Broker and research: MNCL Q1 FY27 result update (August 14, 2026, Buy, target Rs 42,150); Motilal Oswal CEO interactions (September 30, 2025 and August 28, 2026); Phillip Capital innerwear sector report (October 2021)
• Market and financial data: Screener (price, financials, shareholding, ratios, November 3, 2026), 5paisa, Dhan, IIFL, Smart-Investing, TipRanks, StockAnalysis, Value Research, MoneyWorks4Me, Finnhub (peer prices and multiples, November 2 to 3, 2026)
• Company history and licence: Hindu BusinessLine (2012 profile; 2021 management changes), Indian Textile Magazine (2012 licence and Speedo record; FY25 summary), Groww Digest, Trade Brains and Kotak Neo (licence histories, 2040 extension reported, not primary-verified), Devdiscourse PTI (October 2021, USD 1 billion aspiration)
• Market sizing: IMARC India innerwear market (updated October 27, 2026); peer results via ScanX, Ventura Securities and company reports for Lux, Dollar, Rupa and VIP Clothing
© 2026 DalalBytes Research · For educational purposes only. Not investment advice.