

What is the verdict on NVIDIA?
72/100. Positive. The strongest franchise in the compute stack is printing a 75% gross margin at the top of a pricing cycle, guiding its own margin down before the market makes it do so, and spending its balance sheet to make sure the cycle's capacity gets built around its racks.
What would change the score. The score rises if Vera Rubin holds the fiscal 2028 growth guide near 70% with gross margin settling at or above 72% and receivables growth back in line with revenue, and it falls if gross margin breaks below 70%, if a top hyperscaler shifts a training generation to its own silicon at scale, or if a guaranteed customer campus fails to reach service.
| 72/100 | DalalBytes score |
| $204.64 | Reference price. October 30 2026 close |
| $4.95T | Market cap at 24190M shares |
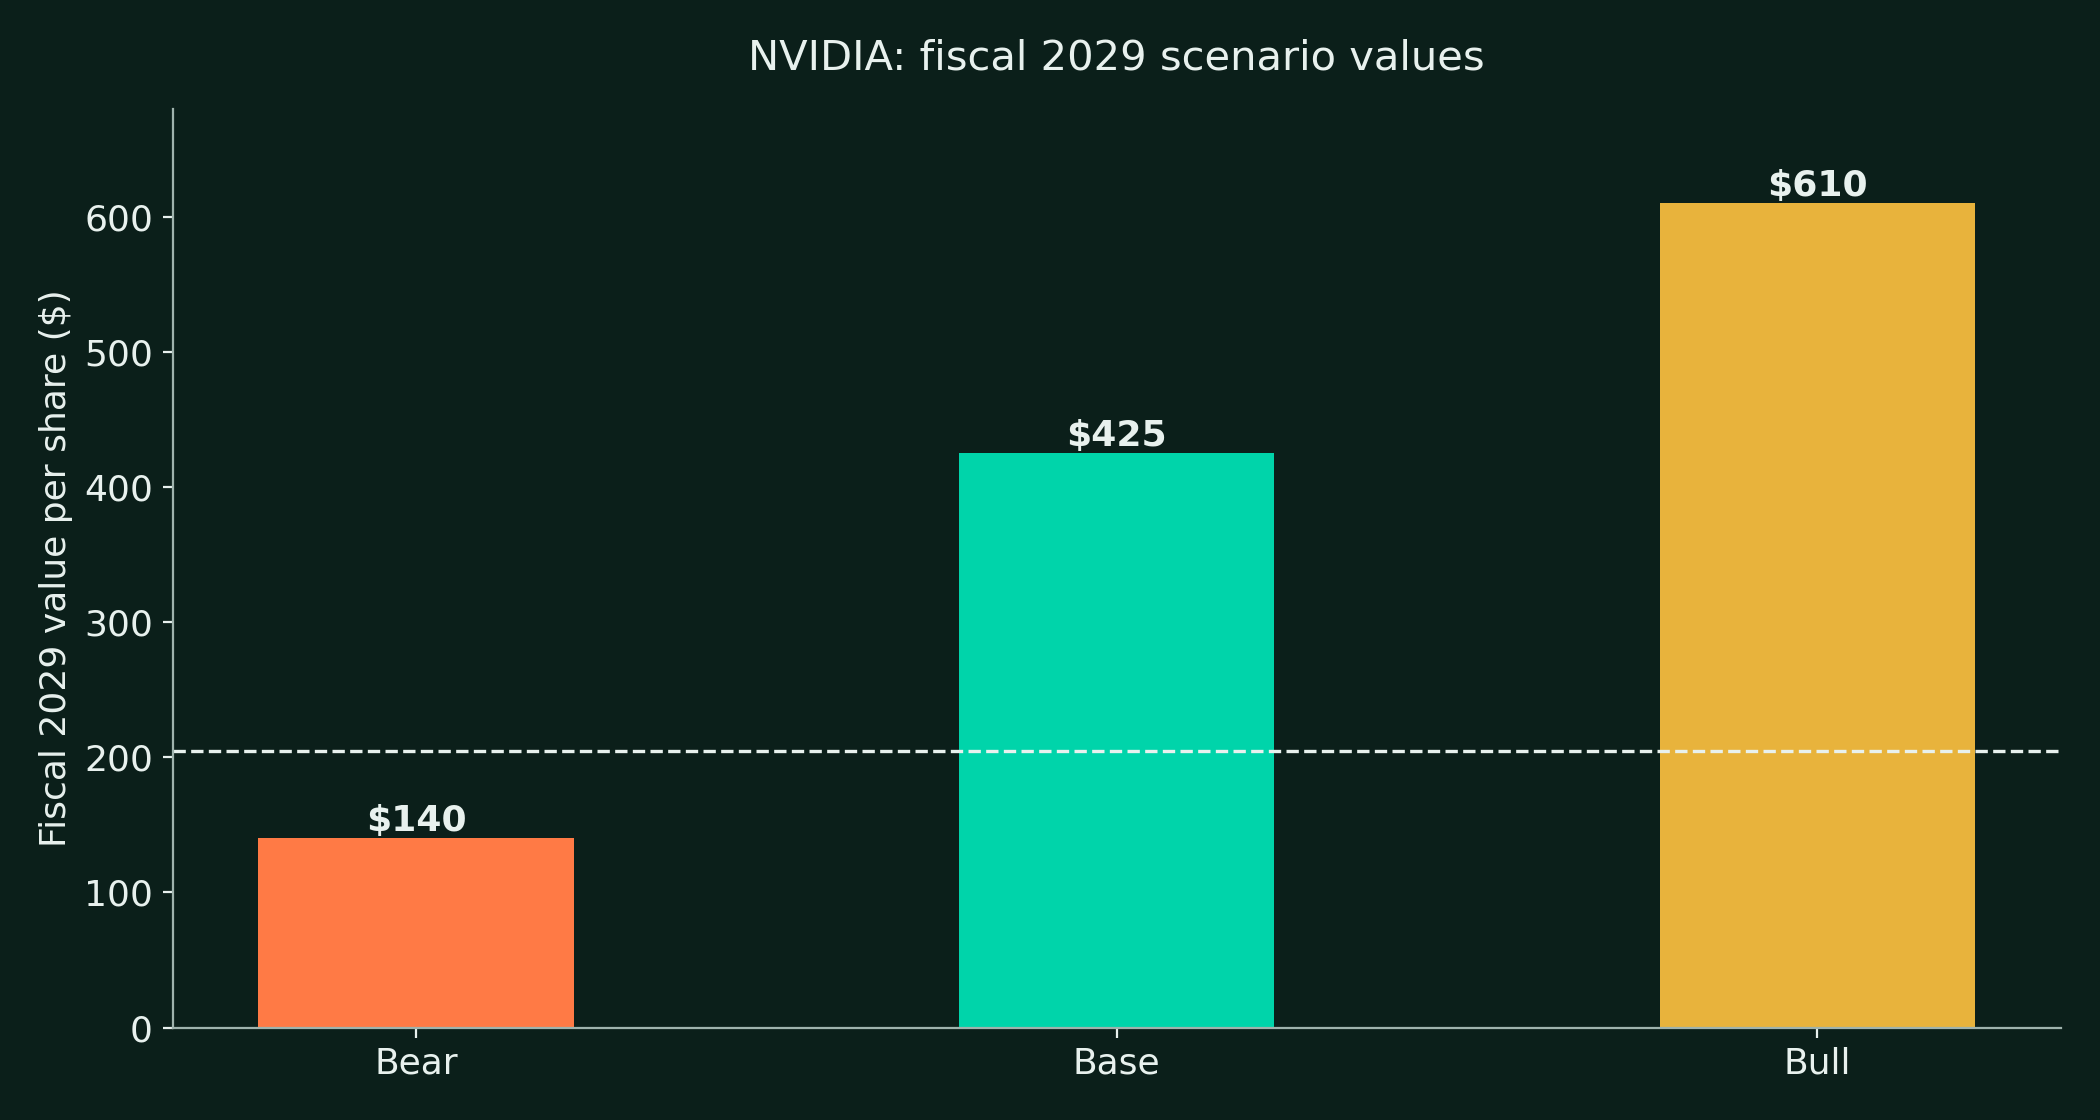
| $140 / $425 / $610 | Fiscal 2029 bear / base / bull |
This report is struck before the print. NVIDIA reports fiscal Q3 2027 results on November 17, 2026, and the latest reported quarter is Q2 fiscal 2027, published on August 26, 2026, with the fiscal Q3 guide standing in for the current quarter. A post-earnings refresh of this package is already scheduled for November 18, 2026, and will re-strike the score on the print. Everything below is built on filed numbers through July 26, 2026, and readers should treat the valuation as a pre-print strike, not a settled one.
The business itself is not the argument. Revenue of $96.2B in one quarter, up 106% year over year, a Data Center line at $89.0B, and a guide of $108.0B for the quarter now ending make NVIDIA the toll booth of the AI buildout in a way no prior chip cycle produced. The argument is about the quality of the peak. Gross margin is guided down from 75.0% toward a 71% to 72% bottom in Q4 as memory costs land. Receivables rose 64% in six months because investment-grade customers were given longer to pay. And the balance sheet now stands behind the customers as well as in front of them, with $279B of supply commitments, $36B of AI cloud agreements, and guarantees capped at $108.5B.
Our base case pays management most of its own roadmap. Fiscal 2028 growth lands below the guided 70% on supply, fiscal 2029 grows 28% more, gross margin settles inside the guided 72% to 73% band, and the stock is worth $425 by fiscal 2029. The bear case is not a demand collapse. It is the rent-sharing sequence the DalalBytes Compute Price Reset article laid out, spot prices first, contract prices second, reported margins last, arriving while the guarantees phase in. That case is worth $140, about a third below the reference price, and it is the honest shape of the downside at $204.64.
The price basis of this report
This report uses the Friday October 30, 2026 Nasdaq close of $204.64 throughout. NVIDIA reports fiscal Q3 2027 results on November 17, 2026. This package is struck pre-print on fiscal Q2 2027 data and is scheduled for a post-earnings refresh on November 18, 2026.
What is NVIDIA in one page?
NVIDIA is based in Santa Clara, California, and trades on Nasdaq as NVDA. Jensen Huang founded the company in 1993 and has led it since, the longest founder tenure at any company of this scale in the library. The fiscal year ends in late January, so fiscal 2027 began on January 26, 2026, and the latest reported quarter is Q2 fiscal 2027, ended July 26, 2026.
The company sells accelerated computing platforms, not chips in isolation. A modern NVIDIA sale is a rack, or a row of racks, containing its GPUs, its CPUs, its networking silicon, its interconnect fabric and the CUDA software layer that ties them together, increasingly financed, supplied and even sited with NVIDIA's own balance sheet behind the project. The revenue per gigawatt framing management now uses tells the story in one line. A gigawatt of Hopper capacity carried about $18B of NVIDIA revenue opportunity. Blackwell carries about $25B. Vera Rubin carries about $40B.
Fiscal 2027 also brought a reporting change that matters for anyone reading the history. NVIDIA now reports two reportable segments, Compute & Networking and Graphics, and two market platforms, Data Center and Edge Computing. The older platform lines of Gaming, Professional Visualization and Automotive are no longer broken out and now sit inside Edge Computing. The history in this report shows both bases where the filings allow, labeled as such.
| Metric | FY2025 | FY2026 | Q2 FY2027 |
|---|---|---|---|
| Total revenue ($M) | 130,497 | 215,938 | 96,221 |
| Data Center revenue ($M) | 115,185 | 193,700 | 89,023 |
| Gross margin, GAAP | 75.0% | 71.1% | 75.0% |
| Net income, GAAP ($M) | 72,880 | 120,067 | 59,688 |
| Diluted EPS, GAAP | $2.94 | $4.90 | $2.46 |
| Free cash flow ($M) | 60,853 | 96,676 | 21,341 |
- Fiscal 2026 revenue grew 65% to $215.9B.
- Q2 fiscal 2027 revenue grew 106% year over year and 18% sequentially.
- Data Center is 92.5% of Q2 fiscal 2027 revenue.
- Hyperscale customers produced $48.7B of Q2 revenue, about half the company.
- GAAP net income in Q2 includes $7.8B of gains on equity securities. Non-GAAP net income was $54.0B.
- Weighted diluted shares were 24,285M in Q2 fiscal 2027, down from 24,532M a year earlier.
How does NVIDIA make money?
NVIDIA reports two segments. Compute & Networking carries the data center platforms, networking, and the compute content of the edge lines. Graphics carries the graphics content across gaming, workstations and PCs. The market platform view below it is the one management steers by.
| Reportable segment ($M) | FY2024 | FY2025 | FY2026 | Q2 FY2027 |
|---|---|---|---|---|
| Compute & Networking revenue | 47,405 | 116,193 | 193,479 | 88,299 |
| Graphics revenue | 13,517 | 14,304 | 22,459 | 7,922 |
| Total revenue | 60,922 | 130,497 | 215,938 | 96,221 |
The market platforms
| Market platform ($M) | FY2025 | FY2026 | Q1 FY2027 | Q2 FY2027 |
|---|---|---|---|---|
| Data Center | 115,185 | 193,700 | 75,246 | 89,023 |
| Hyperscale | not split | not split | 43,050 | 48,710 |
| AI Clouds, Industrial & Enterprise | not split | not split | 32,196 | 40,313 |
| Edge Computing | 15,312 | 22,238 | 6,369 | 7,198 |
| Total revenue | 130,497 | 215,938 | 81,615 | 96,221 |
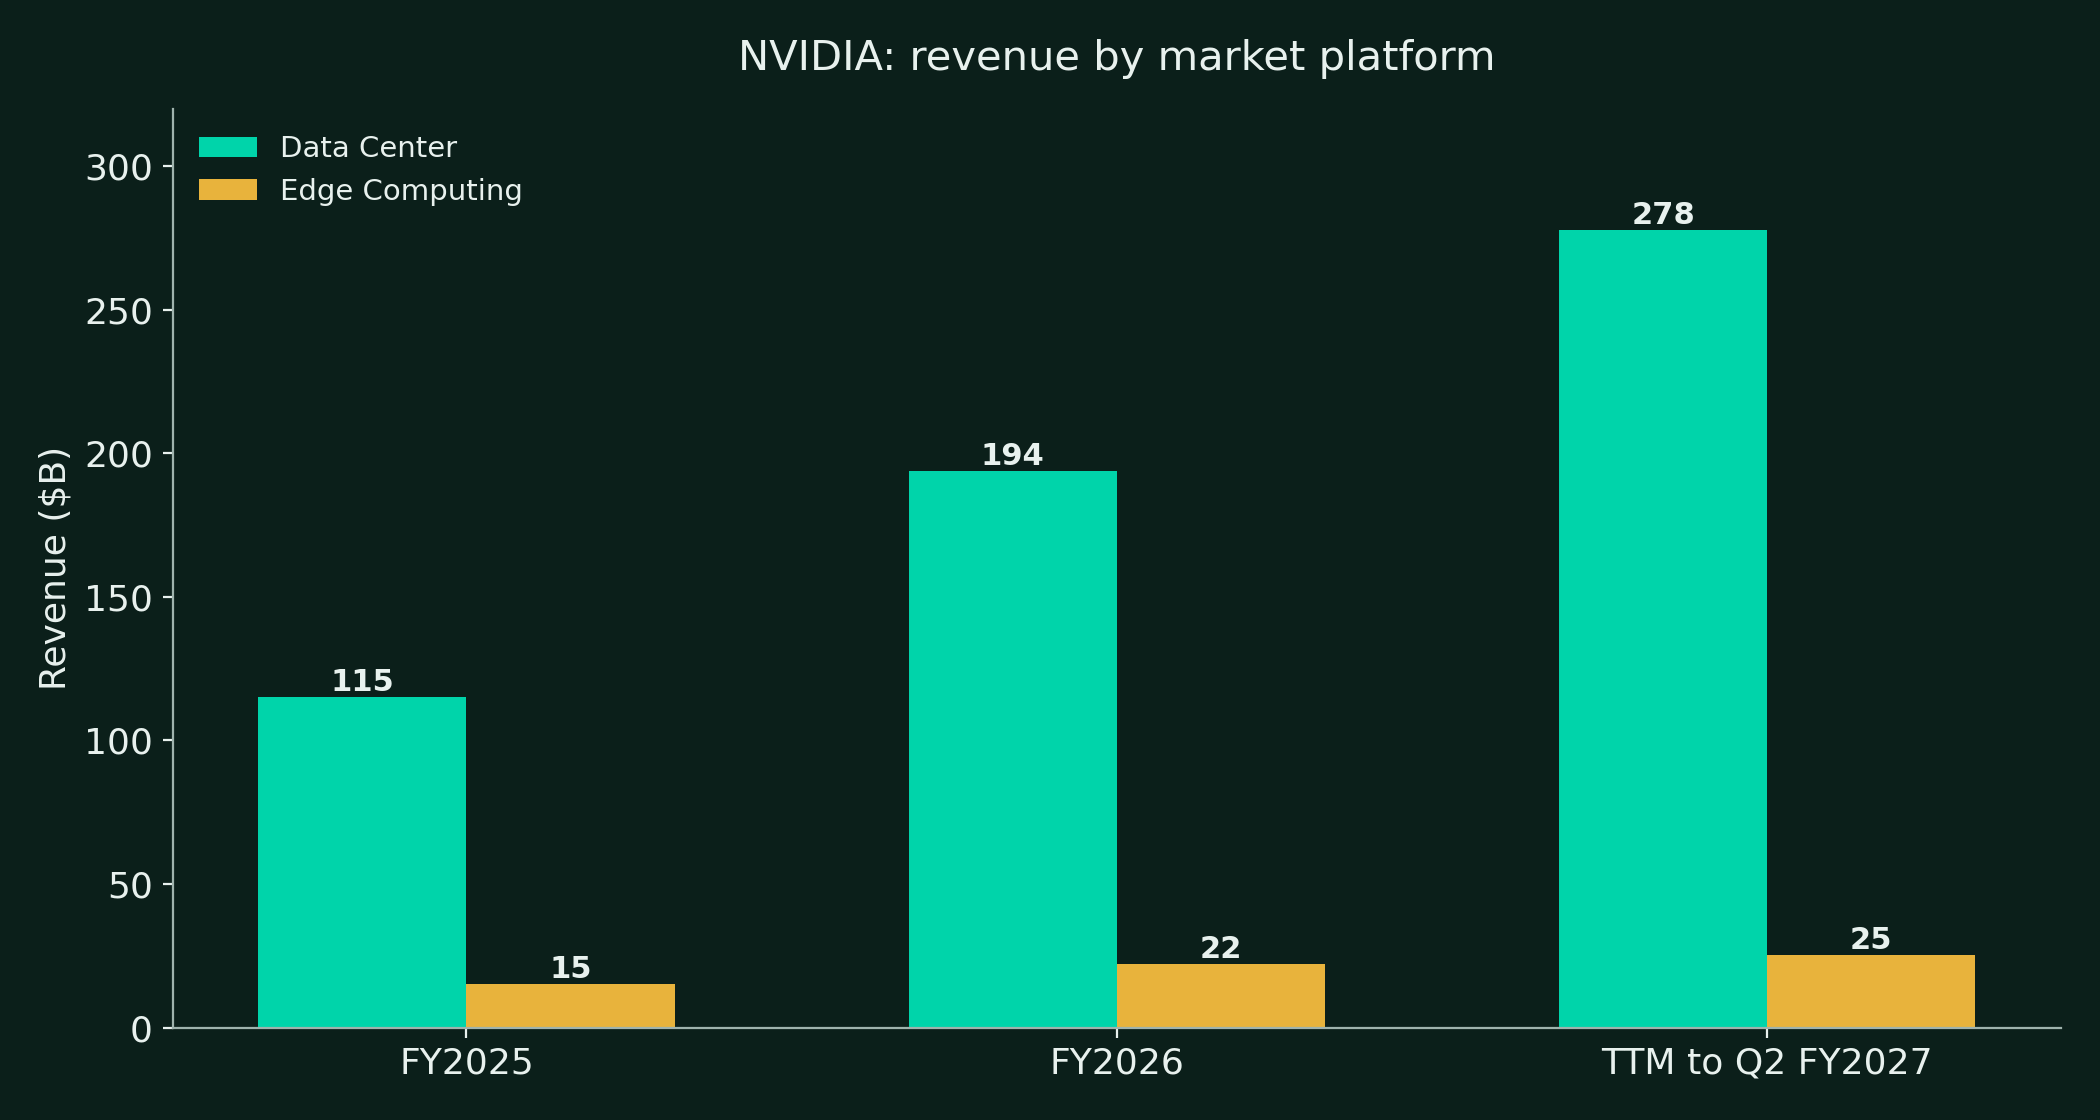
- Data Center revenue grew 117% year over year in Q2 fiscal 2027.
- The AI Clouds, Industrial & Enterprise class grew 138%, faster than Hyperscale at 102%, as neoclouds, sovereign programs and enterprises took a larger share of the ramp.
- One customer was reclassified from the AI Clouds class to Hyperscale in Q2 on a change in its business model, with prior periods recast.
- Edge Computing grew 27% year over year in Q2, driven by Blackwell workstations and partly offset by consumer PC sales tempered by elevated memory and system prices.
Inside Data Center, compute against networking
| Data Center split ($B) | FY2025 | FY2026 | Q4 FY2026 | Q1 FY2027 |
|---|---|---|---|---|
| Compute revenue | 102.2 | 162.3 | 51.3 | 60.4 |
| Networking revenue | 13.0 | 31.4 | 11.0 | 14.8 |
| Networking share of Data Center | 11.3% | 16.2% | 17.7% | 19.7% |
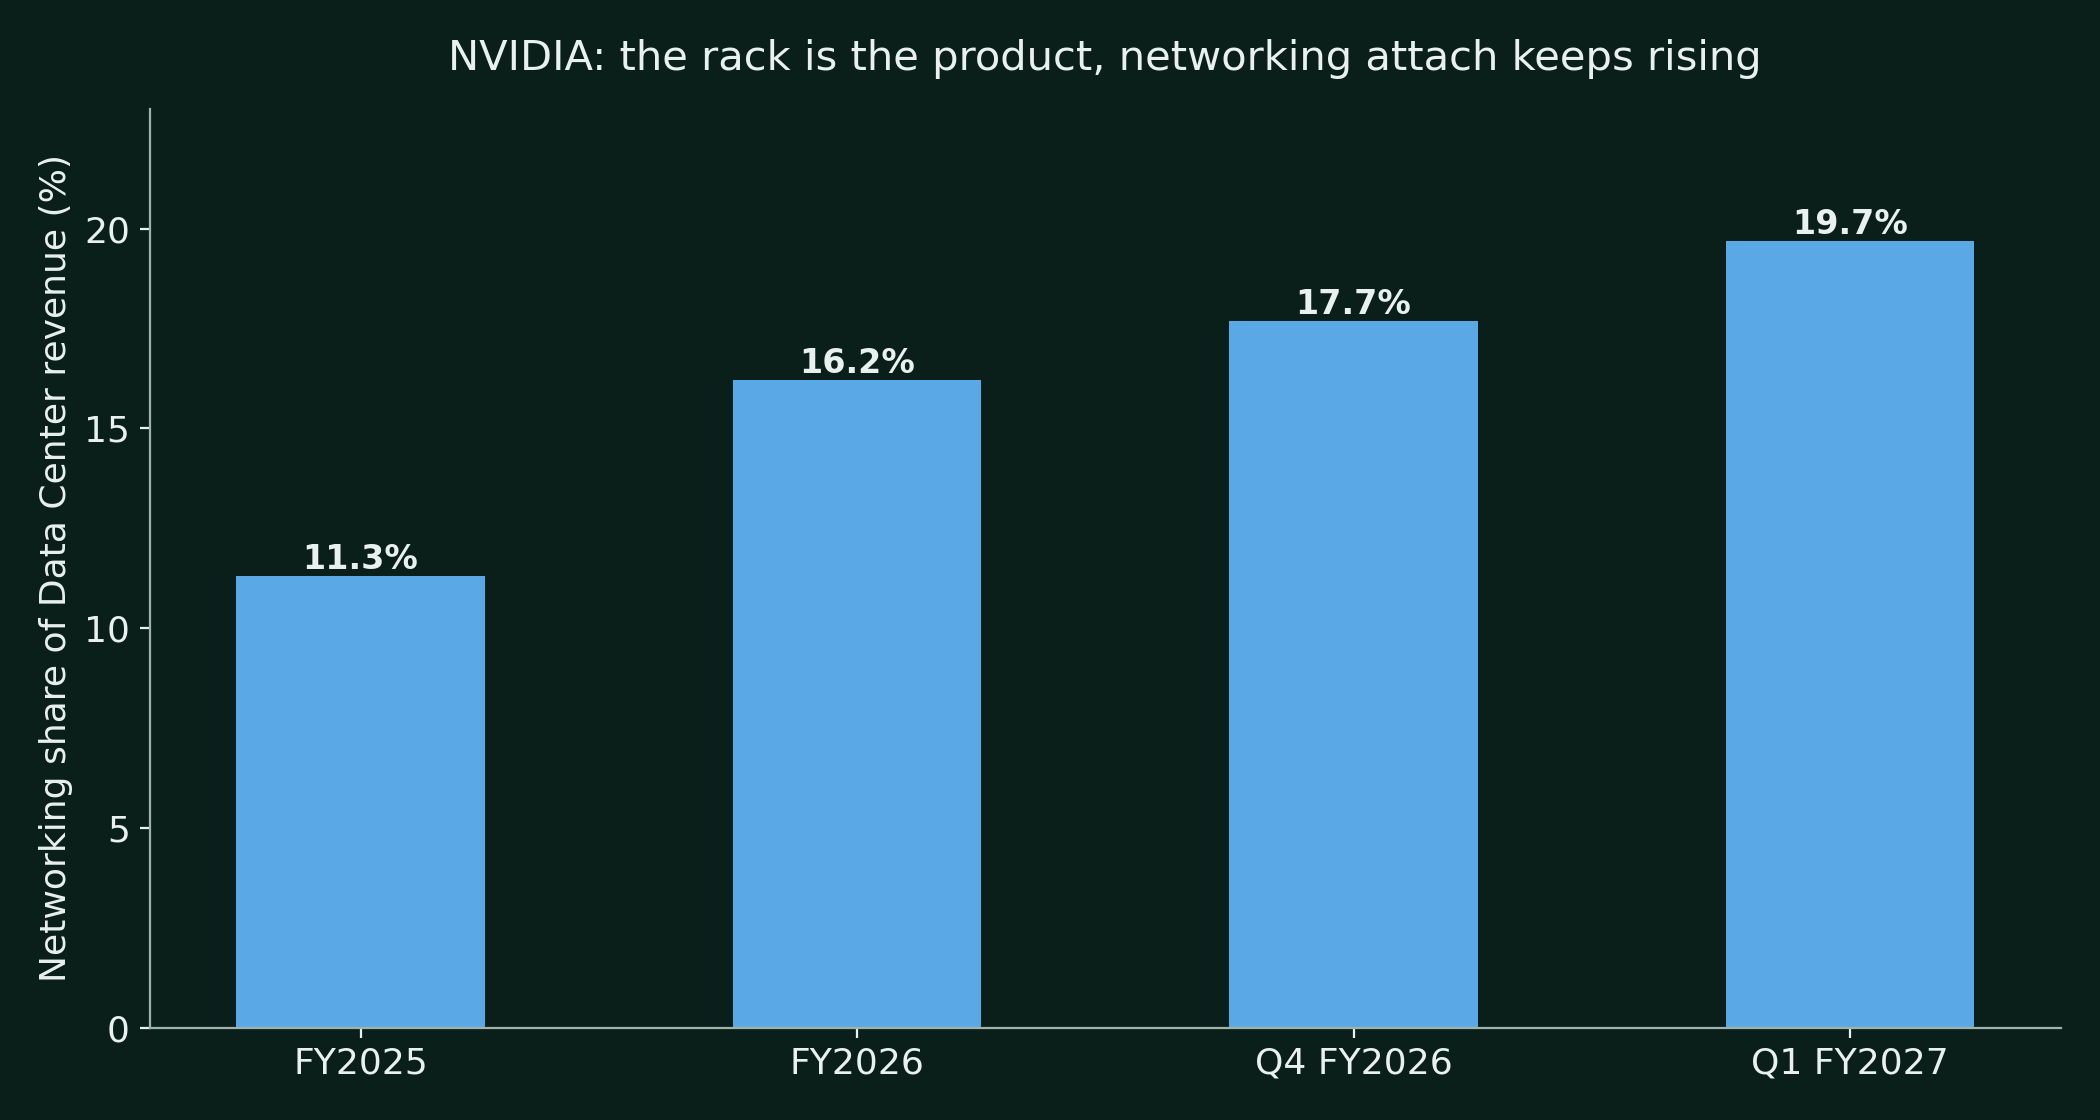
- Networking revenue grew 142% in fiscal 2026 to $31.4B, on NVLink compute fabric shipping inside GB200 and GB300 racks and on Spectrum-X Ethernet and InfiniBand growth.
- The Q2 fiscal 2027 commentary did not update the compute and networking split. The last disclosed split is Q1 fiscal 2027, and this report does not estimate the missing quarter.
- The mix point matters for margin and moat alike. A rack sale carries more third-party content than a chip sale, and it also locks the customer into NVIDIA's fabric for the life of the installation.
The edge lines on their last disclosed basis
Gaming, Professional Visualization and Automotive were reported as separate platforms through fiscal 2026. From fiscal 2027 they sit inside Edge Computing and are not broken out. The last full-year disclosure is the honest endpoint of those series.
| Discontinued platform detail ($M) | FY2025 | FY2026 | FY2026 growth |
|---|---|---|---|
| Gaming | 11,349 | 16,000 | +41% |
| Professional Visualization | 1,878 | 3,200 | +70% |
| Automotive | 1,694 | 2,300 | +39% |
| OEM and other | 391 | 700 | n/a |
- Gaming set a record in fiscal 2026 on Blackwell demand, and management warned that memory and system prices would temper consumer PC sales, a warning the Q2 Edge commentary repeated.
- Professional Visualization crossed $1B in a quarter for the first time in Q4 fiscal 2026 on RTX PRO Blackwell workstations.
- Automotive grows slowest of the three and is strategically larger than its revenue, through the DRIVE Hyperion ecosystem, the Alpamayo open model family and robotaxi partnerships with Uber, Foxconn and VinFast.
- The edge lines together are now 7.5% of revenue. They are optionality, not ballast.
What is inside the Data Center engine?
The Data Center engine runs on an annual platform cadence that has now held for three generations. Hopper established the market. Blackwell and Blackwell Ultra industrialized it. Vera Rubin, announced with the fiscal 2026 results in February 2026 as a six-chip platform promising up to a 10x reduction in inference token cost against Blackwell, entered full production in the second quarter of fiscal 2027, with racks running at CoreWeave, Google Cloud, Microsoft Azure, Oracle Cloud Infrastructure and Nebius.
- Q2 fiscal 2027 Data Center growth was driven by the Blackwell Ultra ramp, per the CFO commentary.
- Management expects Vera Rubin to contribute roughly a fifth of Data Center revenue in Q3 fiscal 2027 and describes it as the fastest product ramp in the company's history, per earnings call reporting.
- The Vera CPU, unveiled in Q2, is NVIDIA's first CPU built for AI agents, with adoption planned across leading technology providers and a deployment at SpaceXAI.
- The Groq 3 LPX inference accelerator, built on the non-exclusive Groq license signed in fiscal 2026, is in full production, extending NVIDIA's inference line below the GPU tier.
- The DSX platform packages the whole build as a playbook for AI factory builders, with sovereign programs in Korea and Japan building on it.
- Revenue opportunity per gigawatt rises from about $18B on Hopper to about $25B on Blackwell to about $40B on Vera Rubin, per management on the Q2 call. Rising content per gigawatt is the quiet growth engine inside unit demand.
The engine's constraint is no longer demand or even wafers. Management attributes the gap between customer forecasts, which point to roughly 100% fiscal 2028 growth, and its own guide of about 70% to memory and broader supply chain capacity. The $279B supply commitment figure in section 11 is that constraint expressed as a purchase order.
Where does the 75% gross margin go from here?
Gross margin is where this report earns its keep, because the 75.0% print in Q2 fiscal 2027 is both real and, on management's own guide, temporary. The path is already published. Q3 fiscal 2027 is guided at 74.0%. Management expects the margin to bottom between 71% and 72% in Q4, and to settle at 72% to 73% in fiscal 2028 as price increases of more than 15% on systems shipping early next year take effect. The question for the score is not whether margin compresses. It is whether the guided three-to-four point step down is the whole story, or the first leg of the longer rent-sharing grind.
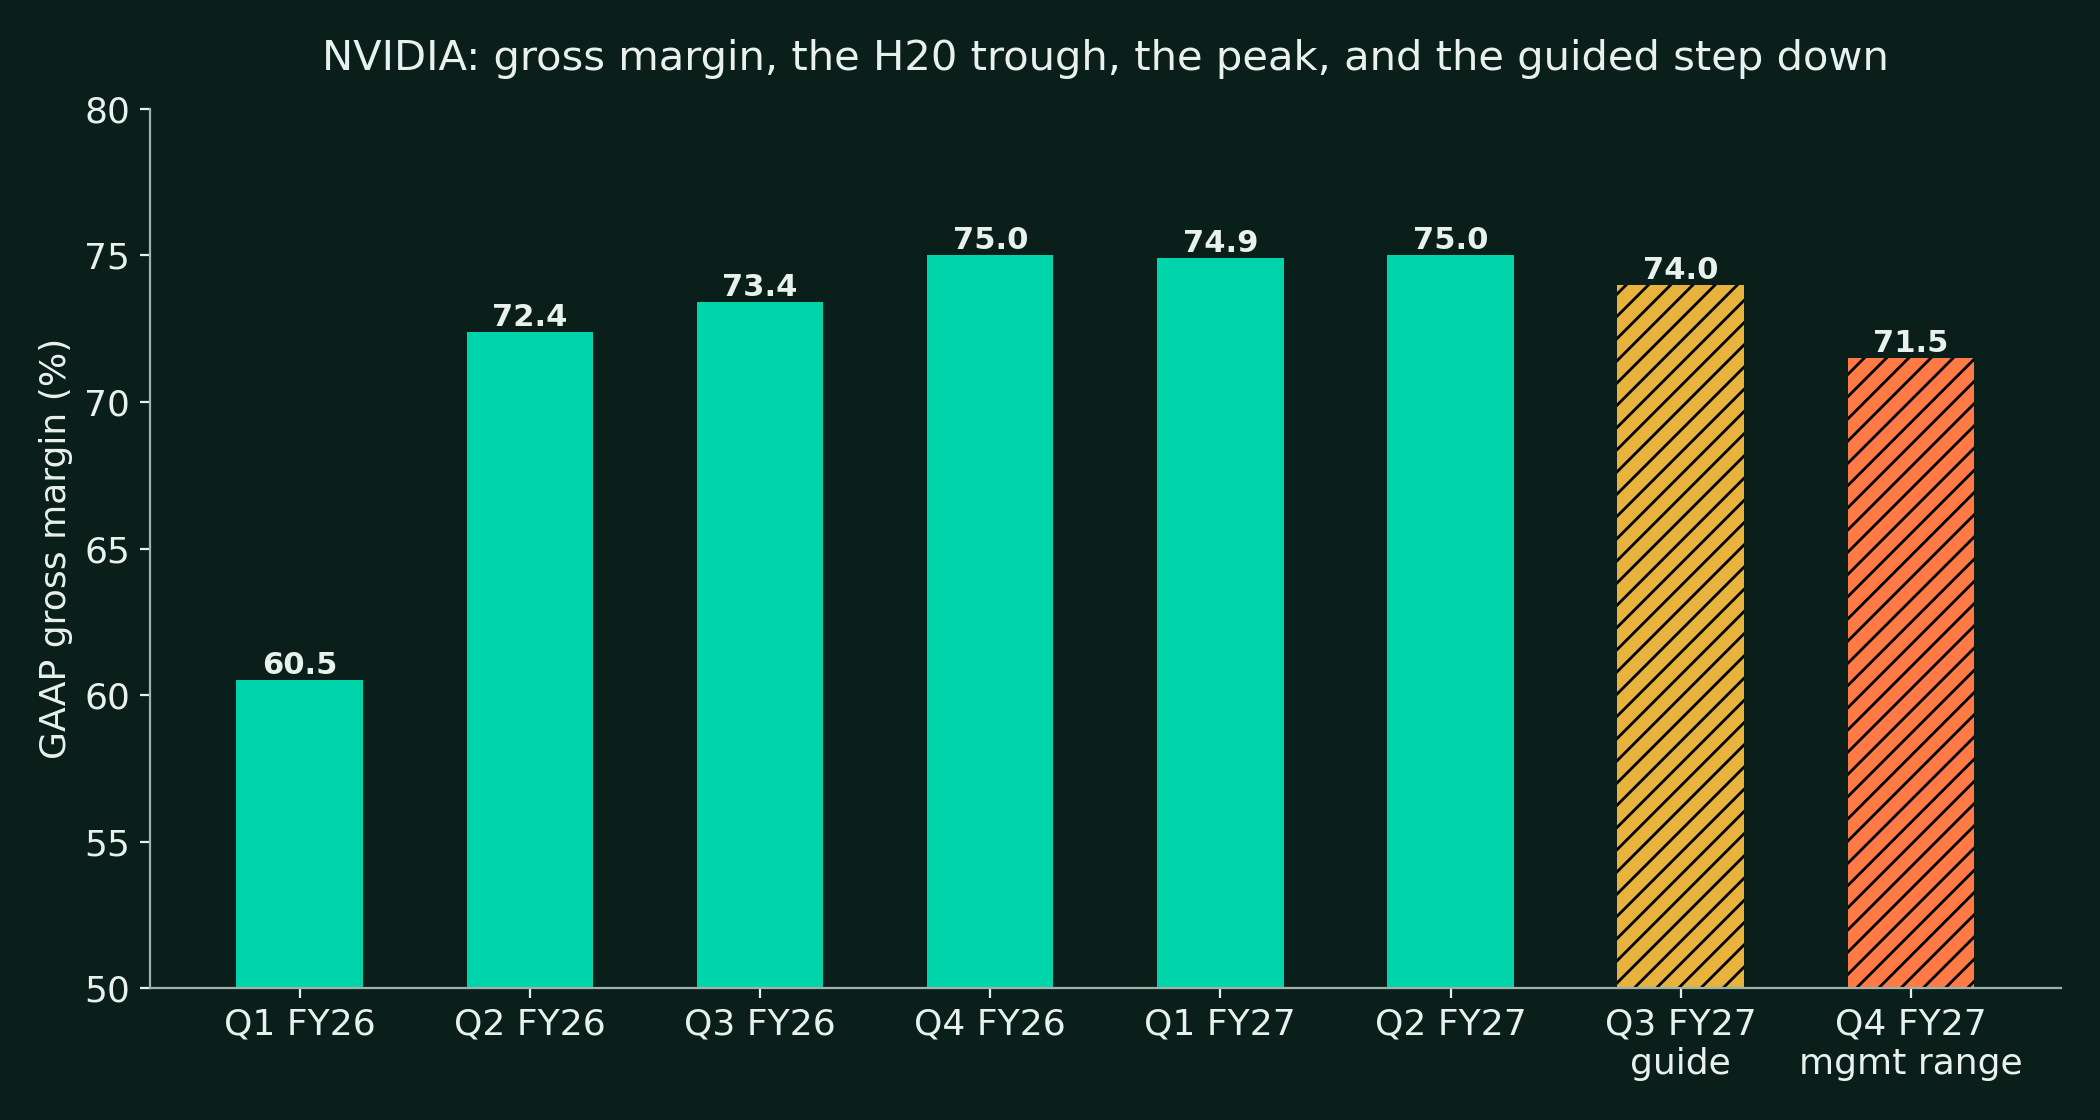
The case that compression stays contained rests on evidence, not faith. NVIDIA has already absorbed one margin shock in this cycle, the $4.5B H20 charge that took Q1 fiscal 2026 GAAP gross margin to 60.5%, and recovered to 75.0% within three quarters. The Blackwell Ultra mix lifted margin year over year in Q2 even as system content rose. The company is passing memory costs through with system price increases above 15%, announced to customers before the costs fully land, which is what a seller with pricing power does. And the mix is shifting toward the full rack, where NVIDIA's content per gigawatt rises from $25B to $40B across the Rubin transition, so gross profit dollars per installation grow even if the percentage eases.
The case for a longer grind is the rent-sharing sequence, and it also rests on evidence. Memory has become the binding input, and the memory makers are collecting first. Supply commitments jumped from $119B to $279B in a single quarter, primarily for memory procurement, which means NVIDIA is prepaying scarcity prices to secure allocation. The buyers are collecting second. Every hyperscaler on the customer list now runs a credible custom silicon program, and those programs are negotiation weapons at every contract renewal whether they ship at scale or not. Mix collects third. Rack-scale systems carry large amounts of other vendors' content through the income statement, diluting the percentage even while the dollars compound. Management's own settle range, 72% to 73%, is an admission written into guidance that the 75% print was a peak, and the history of this industry offers no example of a guided step down that stopped exactly where the first guide said it would.
Our reading sits between the two cases and is the reason the score is 72 and not higher. The guide is credible for fiscal 2028 because it is specific, near, and tied to named price increases. It is not yet evidence about fiscal 2029, when the fiscal 2027 vintage of multi-quarter contracts reprices and the custom silicon share of dollars reaches toward a fifth of the market. Margin is the score's live variable, and the November 17 print, which will test the 74.0% guide, is the first checkpoint.
How strong is the moat?
The moat is a stack, and its layers reinforce each other in a specific order. CUDA is the base layer, two decades of libraries, tools and trained engineers that make NVIDIA the default target for new model architectures. The platform cadence sits on it, an annual rhythm of chips, racks and software that lets customers plan capacity years out. NVLink and the networking fabric are the newest and most measurable layer. Networking rose from 11.3% of Data Center revenue in fiscal 2025 to 19.7% in Q1 fiscal 2027, because a customer who buys the fabric has bought the architecture, and a customer who has bought the architecture does not re-litigate the chip choice every generation.
The honest limit of the moat is that it protects the apex of the workload pyramid better than the base. Frontier training, where time-to-model is the product, remains NVIDIA's by merit, and the Vera Rubin ramp at every major cloud is the current evidence. Inference, fine-tuning and ordinary training are fungible across TPU, Trainium and AMD at an adaptation cost, and the abstraction layers that carry models between chips improve every quarter. The moat does not need to hold the whole pyramid to be worth a pass. It needs to hold the apex and tax the base, and at November 2026 it does both. The grade in the companion scorecard is PASS, with the networking attach rate as the number that would prove the moat is widening rather than merely holding.
How does the competition stack up in numbers?
Competition reaches NVIDIA through three channels, and the house research library has already measured each of them. The numbers below are drawn from The Compute Share Wars and The Compute Price Reset, DalalBytes, November 2026, so the competitive frame in this report is the same frame the library uses everywhere.
| Competitive measure | Reading | Source basis |
|---|---|---|
| NVIDIA share of AI accelerator revenue | About 75% in 2026 estimates | Silicon Analysts compilation |
| NVIDIA share of the NVDA, AMD, Intel data center set | About 86% by Q4 2025 | Bloomberg via Visual Capitalist |
| Custom silicon share of accelerator dollars | 8% in 2024, 12% in 2025, 16% in 2026, about 20% in 2027 | Broker estimates |
| Custom silicon share forecast, 2028 | 35% to 40% of hyperscaler AI compute spend | Broker forecasts |
| AMD share of AI accelerator revenue | About 7% in 2026 estimates | Silicon Analysts compilation |
| NVIDIA share of discrete GPU units | 93% in 2025 | Jon Peddie Research |
- Bernstein's framing is the consensus one. Custom silicon does not cap NVIDIA's market so much as slide its share of the hyperscaler wallet from roughly 75% to 80% today toward about 60%, with Broadcom and AMD dividing most of what is ceded.
- Broadcom is the design layer of the challenge, at about 60% or more of custom ASIC design share, and its Google program is already diversifying to MediaTek on the TPU 8i.
- Google is the most complete challenger. The TPU ladder runs from $1.20 to $12.00 per chip hour, Ironwood inference total cost runs about $0.18 per million tokens against about $0.31 for comparable B200 configurations on SemiAnalysis estimates, and Anthropic has committed to up to one million TPU chips.
- Amazon is the second challenger, with Trainium2 at about $2.24 per chip hour on Capacity Blocks and Project Rainier's roughly 500,000 Trainium2 chips in service for Anthropic.
- AMD contests the merchant layer directly, with the OpenAI design win and Meta's roughly 6 gigawatt commitment signed alongside its MTIA extension in April 2026, a three-vendor structure in which merchant GPUs take the flexible layer.
- Meta's structure is the template. Own silicon carries the base load, merchant GPUs supply the frontier and the flex, and no single vendor holds the whole wallet again. NVIDIA's revenue can keep growing inside that structure while its share of the wallet falls. Both halves of that sentence are in our base case.
What is left of the China business?
China was a fifth to a quarter of NVIDIA's data center opportunity before export controls, and it is now a rounding error carried at zero in the guide. The sequence is fully documented in the filings. NVIDIA sold $4.6B of H20 into China in Q1 fiscal 2026 before the licensing requirement landed, took a $4.5B charge on H20 excess inventory and purchase obligations in the same quarter, and printed a 60.5% GAAP gross margin as a result.
- In Q2 fiscal 2027, shipments of Hopper products to China-based customers were less than 1% of Data Center revenue, made under US government licenses.
- Those licensed shipments reduced corporate gross margin in the quarter, per the earnings call reporting.
- The Q3 fiscal 2027 outlook assumes no Data Center compute revenue from China, the same assumption carried in every guide since fiscal 2026.
- Inside the walled market, NVIDIA's share of China accelerator units fell from roughly 95% before restrictions to about 55% in 2025 and about 34% in the first half of 2026 on IDC figures, with Huawei the largest domestic beneficiary at about 28%.
- The strategic cost is not the lost quarter. It is that the sealed market funds a domestic stack, Huawei above all, whose constraint is supply, HBM and advanced packaging, rather than demand or design.
China contributes nothing to our scenarios. Any licensed reopening is upside the price does not need, and any further tightening costs the company almost nothing it has not already lost. That asymmetry is one of the cleaner facts in the report.
What do the financial statements show?
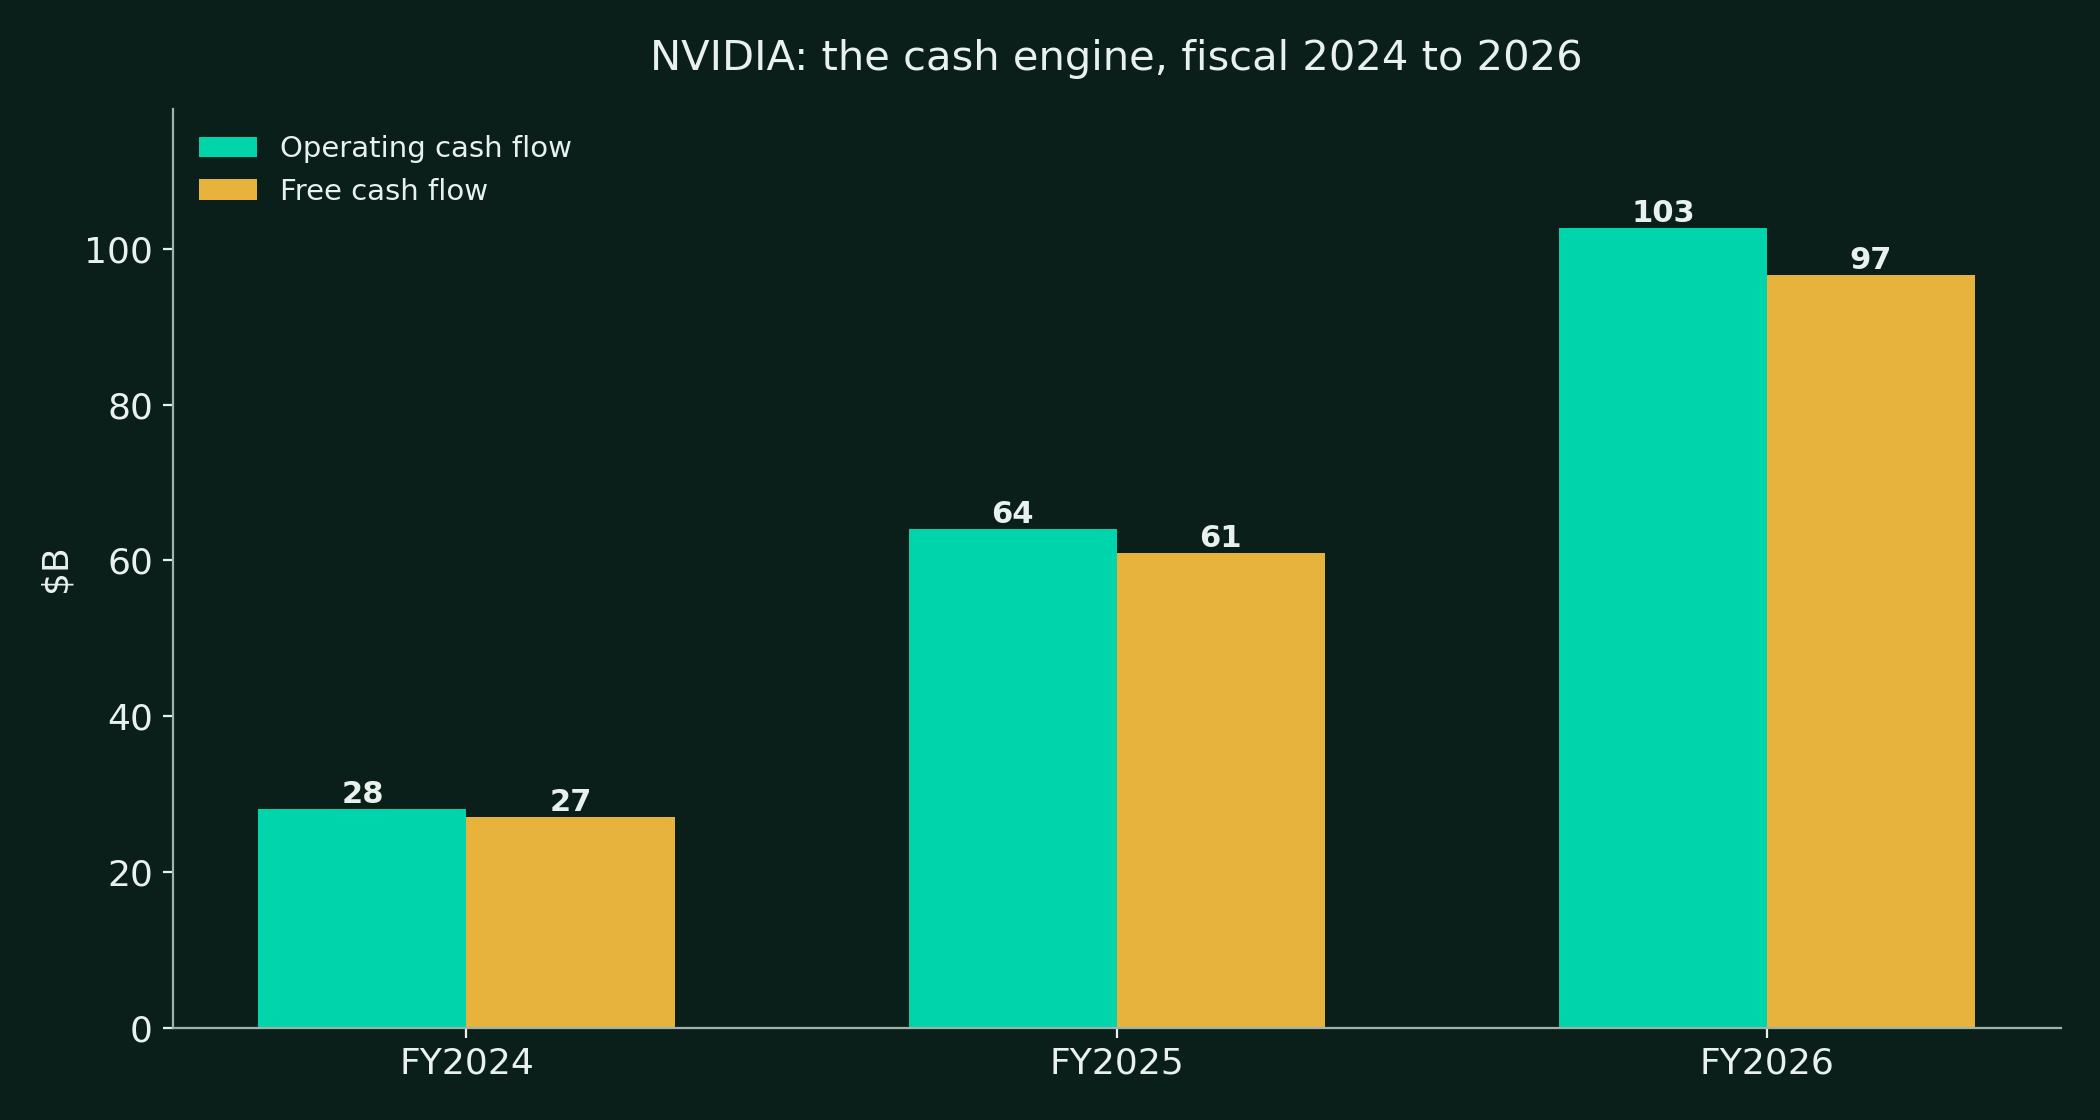
| Fiscal year ($M) | FY2024 | FY2025 | FY2026 |
|---|---|---|---|
| Revenue | 60,922 | 130,497 | 215,938 |
| Gross profit | 44,301 | 97,858 | 153,463 |
| Gross margin | 72.7% | 75.0% | 71.1% |
| Operating income | 32,972 | 81,453 | 130,387 |
| Operating margin | 54.1% | 62.4% | 60.4% |
| Net income, GAAP | 29,760 | 72,880 | 120,067 |
| Diluted EPS, GAAP | $1.19 | $2.94 | $4.90 |
| Operating cash flow | 28,090 | 64,089 | 102,718 |
| Capital expenditure | 1,069 | 3,236 | 6,042 |
| Free cash flow | 27,021 | 60,853 | 96,676 |
| Diluted shares (M) | 25,010 | 24,790 | 24,510 |
- Fiscal 2026 GAAP gross margin of 71.1% carries the $4.5B H20 charge in its first quarter. The quarterly path runs 60.5%, 72.4%, 73.4% and 75.0%, an exit rate well above the full-year figure.
- Research and development was $7.1B in Q2 fiscal 2027 alone, up 64% year over year, and operating expenses are guided to about $9.2B GAAP in Q3.
- Stock-based compensation of $3,954M in the first half of fiscal 2027 is now inside non-GAAP results as well as GAAP, a presentation change NVIDIA made in Q1 fiscal 2027 that we record as an accountability upgrade.
- First half fiscal 2027 operating cash flow was $74.4B and free cash flow $69.9B, but the quarters split sharply. Q1 produced $50.3B of operating cash flow and Q2 produced $24.1B.
- The Q2 split is working capital, not demand. Accounts receivable rose $22.3B in the quarter to $63.1B, with days sales outstanding up from 45 to 60 days on extended payment terms for large multi-quarter agreements with investment-grade customers.
- Inventory rose to $31.6B at July 26, 2026 from $21.4B at fiscal year end, as the company builds ahead of the Vera Rubin introduction in Q3.
- GAAP net income is no longer a clean operating line. Gains on equity securities were $23.7B of the $141.4B of first half pretax income. Non-GAAP net income of $99.5B for the half is the better trend measure, and even it now includes stock compensation.
Has management delivered what it promised?
The demand side of this audit is the cleanest in the library. NVIDIA guided Q1 fiscal 2027 revenue at $78.0B and delivered $81.6B, guided gross margin at 74.9% GAAP and delivered 74.9%, and then guided Q2 at roughly $91B on the Q1 call narrative and delivered $96.2B against a guide the company had set a quarter earlier. When this management team guides a quarter, the quarter arrives above the guide. The Vera Rubin line is tracking the same pattern, unveiled in February 2026, in full production by August 2026, with racks live at five named clouds and a revenue contribution expected in the first quarter of its ramp.
The audit's deductions sit in two places. The first is guidance shape. The beat sizes are narrowing, from the very large beats of fiscal 2024 and 2025 to low single digits above consensus by fiscal 2027 on the measures the financial press tracks, which is what maturity looks like from inside a still-vertical growth curve. The second is that the roadmap now includes commitments the company does not fully control. The fiscal 2028 growth guide of about 70% is explicitly supply-constrained on memory, the margin path depends on customers accepting price increases above 15%, and the guarantee book phases in on campuses other companies must finish and fill. The roadmap is being delivered. It is also, for the first time, partly a roadmap of other people's execution.
| Commitment | Set when | Status at November 2, 2026 |
|---|---|---|
| Q1 FY2027 revenue of $78.0B, plus or minus 2% | February 2026 | Delivered $81.6B. Beaten |
| Q1 FY2027 GAAP gross margin of 74.9% | February 2026 | Delivered 74.9%. Met |
| Q2 FY2027 revenue near $91B guide | May 2026 | Delivered $96.2B. Beaten |
| Blackwell sold out through mid-2026 | Fiscal 2026 calls | Delivered. Blackwell Ultra drove Q2 growth |
| Vera Rubin in full production | Unveiled February 2026 | Ramping August 2026. Delivered on schedule |
| Vera Rubin at about 20% of Data Center revenue in Q3 FY2027 | August 2026 call | Pending. First test is the November 17 print |
| Q3 FY2027 revenue of $108.0B, plus or minus 2% | August 2026 | Pending. Guide assumes zero China compute |
| Q3 FY2027 gross margin of 74.0% | August 2026 | Pending. First step of the guided path down |
| Gross margin bottom of 71% to 72% in Q4 FY2027 | August 2026 call | Pending |
| Gross margin settling at 72% to 73% in fiscal 2028 | August 2026 call | Pending. Rests on price increases above 15% |
| Fiscal 2028 revenue growth of about 70% | August 2026 call | Pending. Stated as supply-constrained |
| Rubin Ultra generation in 2027 | Platform roadmap | Pending. No in-year revenue assumed in our base |
- The annual cadence claim has held at platform level since Blackwell. Hopper to Blackwell took two years, and every step since has landed inside twelve months.
- Networking is the audit's quiet over-delivery. A business that was $3.0B in Q4 fiscal 2025 printed $14.8B in Q1 fiscal 2027.
- The audit grades the roadmap as delivered, with the margin path and the fiscal 2028 guide as the two live promises the November print starts grading.
What does the balance sheet now guarantee?
The balance sheet at July 26, 2026 is two documents in one. The first is a fortress. Cash and marketable debt securities were $56.6B, total debt was $33.4B after a $25.0B senior unsecured note issue in Q2, and shareholders' equity was $229.0B. The second document is the ecosystem ledger, and it is the one that changed this year.
| Item | Value | As of |
|---|---|---|
| Cash and cash equivalents | $22.4B | July 26, 2026 |
| Marketable debt securities | $34.1B | July 26, 2026 |
| Cash and marketable debt securities | $56.6B | July 26, 2026 |
| Total debt, short and long term | $33.4B | July 26, 2026 |
| Marketable equity securities | $42.8B | July 26, 2026 |
| Non-marketable securities | $51.2B | July 26, 2026 |
| Total equity securities | $94.0B | July 26, 2026 |
| Total future commitments | $366B | July 26, 2026 |
| Maximum guarantee exposure | $108.5B | August 2026 agreements |
| Share repurchase authorization remaining | $99.0B | July 26, 2026 |
- Supply and capacity commitments of $279B dominate the commitment table, phased $92B in the remainder of fiscal 2027, $87B in fiscal 2028 and $88B in fiscal 2029, primarily memory procurement.
- Cloud service agreements of $29B and uncommenced data center leases of $25B fund NVIDIA's own research infrastructure, on lease terms up to twenty years.
- Equity investment commitments of $25B remain, focused on AI model makers and infrastructure financiers, subject to contingencies.
- The third-party support ledger sits below the commitment table. AI cloud agreements of $36B and $20B of data center leases signed for reassignment to third parties, against which NVIDIA earns upfront infrastructure revenue and, if criteria are met, a share of the cloud's third-party revenue.
- Guarantees for AI cloud partners' land, power and shell obligations carry a maximum gross exposure of $3.5B.
- The SB Energy arrangement signed in August 2026 is the largest single item. Guarantees capped at $105B support about 4.25 gigawatts at the PORTS-Pike campus in Ohio, hosting NVIDIA infrastructure under 20-year leases to OpenAI, phasing in as data centers reach service from fiscal 2029, with exposure declining as lease payments are made. Each infrastructure generation at the site represents roughly 1.5 million GPUs and $150B to $200B of NVIDIA revenue.
- The financing platform partnerships announced in Q2, with Apollo, BlackRock, Blackstone, Brookfield, Goldman Sachs and KKR, target more than $500B of third-party capital mobilized for AI infrastructure over time, subject to definitive agreements. The design keeps the debt off NVIDIA's balance sheet while keeping the demand on NVIDIA's roadmap.
- The equity book is the circularity question in balance sheet form. Purchases of equity securities were $42.4B in the first half of fiscal 2027, against $1.2B in the prior year half, and the book now stands at $94.0B, including a position of roughly $21B in SpaceX and stakes in CoreWeave, Nebius, Intel, Nokia, Coherent and Synopsys. Gains on this book were $23.7B in the half.
- Shareholder returns run alongside, not instead. First half buybacks were $39.0B and dividends $6.3B, with the quarterly dividend raised from $0.01 to $0.25 per share during fiscal 2027. Q2 alone returned about $26.0B.
- The fortress test we apply is survival, and survival is not in question. A company with $56.6B of liquid securities, $33.4B of debt and $69.9B of half-year free cash flow does not fail on its own ledger. The grade turns on direction. Every quarter, more of the fortress is pledged to the ecosystem that buys from it, and the pledges are long. That is why Iron Fortress grades PARTIAL in the companion scorecard despite the strongest liquid position in the industry.
What is NVIDIA worth by fiscal 2029?
The reference price of $204.64 pays 25.9 times trailing GAAP earnings, a trailing line flattered by $23.7B of first half equity gains, and 16.9 times forward earnings on the consensus snapshot used in the DalalBytes Compute Price Reset valuation table, with forward revenue growth of about 78% and a latest gross margin of 75.0%. The forward multiple is the lowest in that table, and it means the least, because the earnings underneath it are printed at peak margin at the top of a pricing cycle. The scenarios below are built from the segment path, on a fiscal 2027 estimate of about $406B of revenue, with Data Center at about $375B and Edge Computing at about $30B.
| Fiscal 2029 | Bear | Base | Bull |
|---|---|---|---|
| Data Center revenue ($B) | 478 | 744 | 905 |
| Edge Computing revenue ($B) | 36 | 40 | 44 |
| Total revenue ($B) | 514 | 784 | 949 |
| Gross margin | 65% | 72.5% | 74% |
| Operating margin | 54% | 66% | 68% |
| Net income ($B) | 234 | 435 | 546 |
| Diluted shares (B) | 23.8 | 23.5 | 23.3 |
| EPS | $9.85 | $18.50 | $23.45 |
| Exit multiple | 14x | 23x | 26x |
| Scenario value | $140 | $425 | $610 |
The bear case, $140
- Data Center growth steps down to 25% in fiscal 2028 as hyperscaler capex growth rolls over, then to 2% in fiscal 2029 in a digestion year.
- Gross margin falls through the guided floor to 65%, as memory costs stay high, the price increases are negotiated away against custom silicon alternatives, and rack mix dilutes the percentage.
- Guarantees phase in on schedule while one or more supported campuses ramp slowly, and the equity book marks down with the cycle.
- The exit multiple compresses to 14 times, the multiple of a cyclical at peak earnings rather than a platform at a premium.
- The bear case values the stock about a third below the reference price without requiring demand to collapse in any single quarter.
The base case, $425
- Data Center grows 55% in fiscal 2028, below the guided 70% on the memory constraint management itself names, then 28% in fiscal 2029 as Vera Rubin and its successor carry the ramp.
- Gross margin settles inside the guided band at 72.5%, with the announced price increases recovering most of the memory cost.
- Edge Computing compounds at 15% a year on workstations, AI PCs and the automotive ramp.
- Buybacks continue at roughly the fiscal 2027 pace and the diluted count falls to about 23.5B shares.
- The skeptic case stands beside this base. It says the fiscal 2028 guide of about 70% growth is a supply statement dressed as a demand forecast, that the demand underneath it is concentrated in a handful of buyers whose own capex guides decelerate in 2027, and that the receivables and guarantee ledgers are what a seller builds when it is financing its own growth rate.
- Our answer is the checkpoint structure. The fiscal 2028 guide starts grading on November 17, the margin path grades every quarter against published numbers, and the receivables line either normalizes or it does not. If the base case is wrong, the filings show it within two quarters.
The bull case, $610
- Fiscal 2028 growth delivers the guided 70% in full as memory supply loosens into the Rubin ramp, and fiscal 2029 grows 42% more on Rubin Ultra, sovereign programs and the Ohio campus generations.
- Gross margin recovers to 74% as price increases land and the Rubin mix matures.
- The financing platforms mobilize third-party capital at scale, so the buildout's second half is funded by other balance sheets while NVIDIA collects the infrastructure revenue.
- The market keeps a 26 times multiple on $23.45 of earnings, paying for duration rather than for a peak.
What could break the story?
The central risk is that the peak is real and the price knows less than the guide does. NVIDIA's own published path has gross margin stepping down three to four points into fiscal 2028, and every element of the rent-sharing sequence is visible in the current filing, memory commitments repriced upward, buyers armed with custom silicon, mix shifting to racks. If the sequence runs past the guided floor, the earnings denominator falls faster than the multiple can cushion, which is the precise shape of the bear case. The stock is cheap on peak earnings. Peak is the operative word.
The second risk is the ecosystem ledger. NVIDIA now stands behind its demand in four ways at once, as an equity holder in its customers, as a guarantor of their campuses, as a lessee signing for reassignment, and as a partner in financing platforms designed to fund their buildouts. Each arrangement is individually defensible and most are collateralized, phased or capped. Together they mean that a demand air pocket would arrive at NVIDIA's balance sheet from several directions in the same quarter, through marks, through guarantees phasing in on empty capacity, and through the receivables line that has already stretched to 60 days. The arrangements convert customer credit risk into NVIDIA risk at exactly the scale where customer credit becomes the cycle's weak layer.
The third risk is concentration wearing a growth costume. Hyperscale buyers produced about half of Q2 revenue, and the industry's demand aggregates a handful of American balance sheets, a sealed Chinese market, and sovereign programs that arrive in anchor shape. A single top buyer shifting one training generation to its own silicon, as each of them is now equipped to do, removes a measurable slice of the growth rate and reprices the negotiation for everyone else.
- Gross margin is guided down, and guided step downs in this industry have a history of extending. The fiscal 2028 settle range of 72% to 73% is a promise, not a print.
- Receivables grew 64% in six months against revenue growth of 18% in the second quarter. Extended terms to investment-grade customers are a choice, and the choice is financing demand.
- The equity book at $94.0B marks both ways. The $23.7B of first half gains that flattered GAAP earnings reverse just as mechanically in a down cycle.
- Supply commitments of $279B are largely fixed. If fiscal 2029 demand disappoints, the memory is already bought.
- China is excluded from every guide and still managed to cost $4.5B once. Export policy remains a live variable in both directions.
- The score is struck pre-print. The November 17 results will test the $108.0B guide, the 74.0% margin guide and the Rubin mix claim at once, and this package refreshes on November 18.
Where does the stock sit today?
- Reference price is the Friday October 30, 2026 close of $204.64.
- Shares outstanding were about 24,190M basic at the Q2 print, giving a market value of about $4.95T at the reference price.
- The price pays 25.9 times trailing GAAP earnings and 16.9 times forward earnings on the consensus snapshot in the DalalBytes Compute Price Reset valuation table.
- The same snapshot lists forward revenue growth of about 78% and a latest reported gross margin of 75.0%, the widest margin on the table.
- The stock sits in the tracked-not-owned group of the library's universe, and this package is its first full scoring.
- Fiscal Q3 2027 results on November 17, 2026 are the next hard checkpoint, and this report refreshes the day after.
Frequently asked questions
Is NVIDIA's 75% gross margin about to compress?
Management has already answered the direction. Gross margin printed 75.0% in Q2 fiscal 2027, is guided at 74.0% for Q3, and is expected to bottom between 71% and 72% in Q4 as memory costs land, before settling at 72% to 73% in fiscal 2028 as price increases take effect.
How exposed is NVIDIA to its own customers' financing?
The exposure is real and now quantified in the filings. NVIDIA held about $94B of equity securities at July 2026, carries $36B of AI cloud agreements, and guarantees up to $108.5B of land, power and shell obligations, capped and phased, with the largest package tied to OpenAI's Ohio campus.
What does China contribute now?
Very little by design of the guide. NVIDIA shipped less than 1% of Data Center revenue to China based customers in Q2 fiscal 2027 under licenses, and its Q3 outlook assumes no Data Center compute revenue from China at all. The $4.5B H20 charge in Q1 fiscal 2026 marks what the market was worth.
Sources and disclosures
- NVIDIA press release, Financial Results for Second Quarter Fiscal 2027, August 26, 2026, for the quarter's statements, balance sheet, cash flows and outlook.
- NVIDIA CFO Commentary on Second Quarter Fiscal 2027 Results, Form 8-K exhibit, August 26, 2026, for the segment and platform tables, the commitments and guarantees detail, and the receivables and inventory commentary.
- NVIDIA press release, Financial Results for Fourth Quarter and Fiscal 2026, February 25, 2026, for fiscal 2026 and fiscal 2025 statements, the platform history and the Vera Rubin unveiling.
- NVIDIA Form 10-K for fiscal 2025 and fiscal 2026 segment reporting, for the reportable segment history and the discontinued platform detail.
- NVIDIA Q2 fiscal 2027 earnings call reporting of August 26, 2026, for the fiscal 2028 growth guide of about 70%, the margin path to a 71% to 72% bottom and a 72% to 73% settle, the price increases above 15%, and revenue opportunity per gigawatt of $18B, $25B and $40B across Hopper, Blackwell and Vera Rubin.
- The Compute Share Wars and The Compute Price Reset, DalalBytes, November 2026, for the accelerator share series, custom silicon dollar shares, the TPU and Trainium price ladders, and the forward valuation snapshot, at https://dalalbytes.com/blog/compute-share-wars.html and https://dalalbytes.com/blog/compute-price-reset.html.
- Disclosures. DalalBytes holds no position in NVIDIA (NVDA) at publication. This report is research and opinion for educational purposes only and is not investment advice, a recommendation, or a solicitation. This package is struck before NVIDIA's fiscal Q3 2027 results on November 17, 2026 and will be refreshed after that print. Prices and estimates are as of November 2, 2026, and will age. Verify figures against company filings before acting on them.