
Download the paired report (PDF) Nebius investment report Akamai five-pillar analysis
Frequently asked questions
Which company had the stronger Q3 2026?
Akamai, on evidence quality. Its growth is slower, but the CIS guide for 2027 sits in the written release and rests on signed contracts with secured power. Nebius grew 571% and still left the quarter with a delivery slip, a guide trimmed to the low end, and a funding gap to close.
What is the single biggest risk in each story?
For Nebius, the risk is the 2027 funding window. Capex of $40B to $45B meets a residual gap of $6B to $11.25B and a $3.5B bridge that matures inside the window. For Akamai, the risk is return dilution. A $14B book at about 13% IRR can grow revenue while barely moving per-share value.
Why does Akamai outscore Nebius by eleven points?
The pillars reward proof over promise. Akamai passes Sunrise and Management and Moat. Its demand is contracted, its footprint is built, and its cash flow is real today. Nebius passes only Sunrise. Its management grade fell on the Vineland slip, and its free cash flow pillar fails outright this quarter.
Why pair these two companies?
They are opposite ends of one value chain rather than direct rivals. Nebius runs the centralized end. Hyperscalers train models there, post-train them, and generate inference at scale. Akamai runs the distributed end, serving CPU inference close to users from a global edge. The two meet mainly at hosted inference.
Nebius and Akamai are not rivals for the same dollar. They are the two ends of one inference value chain. Nebius runs the centralized end, where models are trained and post-trained and inference is generated in giant GPU sites. Akamai runs the distributed end, where CPU inference is served close to users from a finished global edge. Both printed Q3 2026 within a week of each other, and the prints landed on opposite market reactions.
One question runs through both ends. Who pays for the build, and what does the build earn? Nebius answers with other people's money and an open ceiling. Akamai answers with its own cash flow and a contracted return.
Every checkpoint in this report uses one standard for both names. Each company gets the same scoreboard and the same funding test. Each gets the same backlog test and the same five pillars.
What did the Q3 scoreboard show?
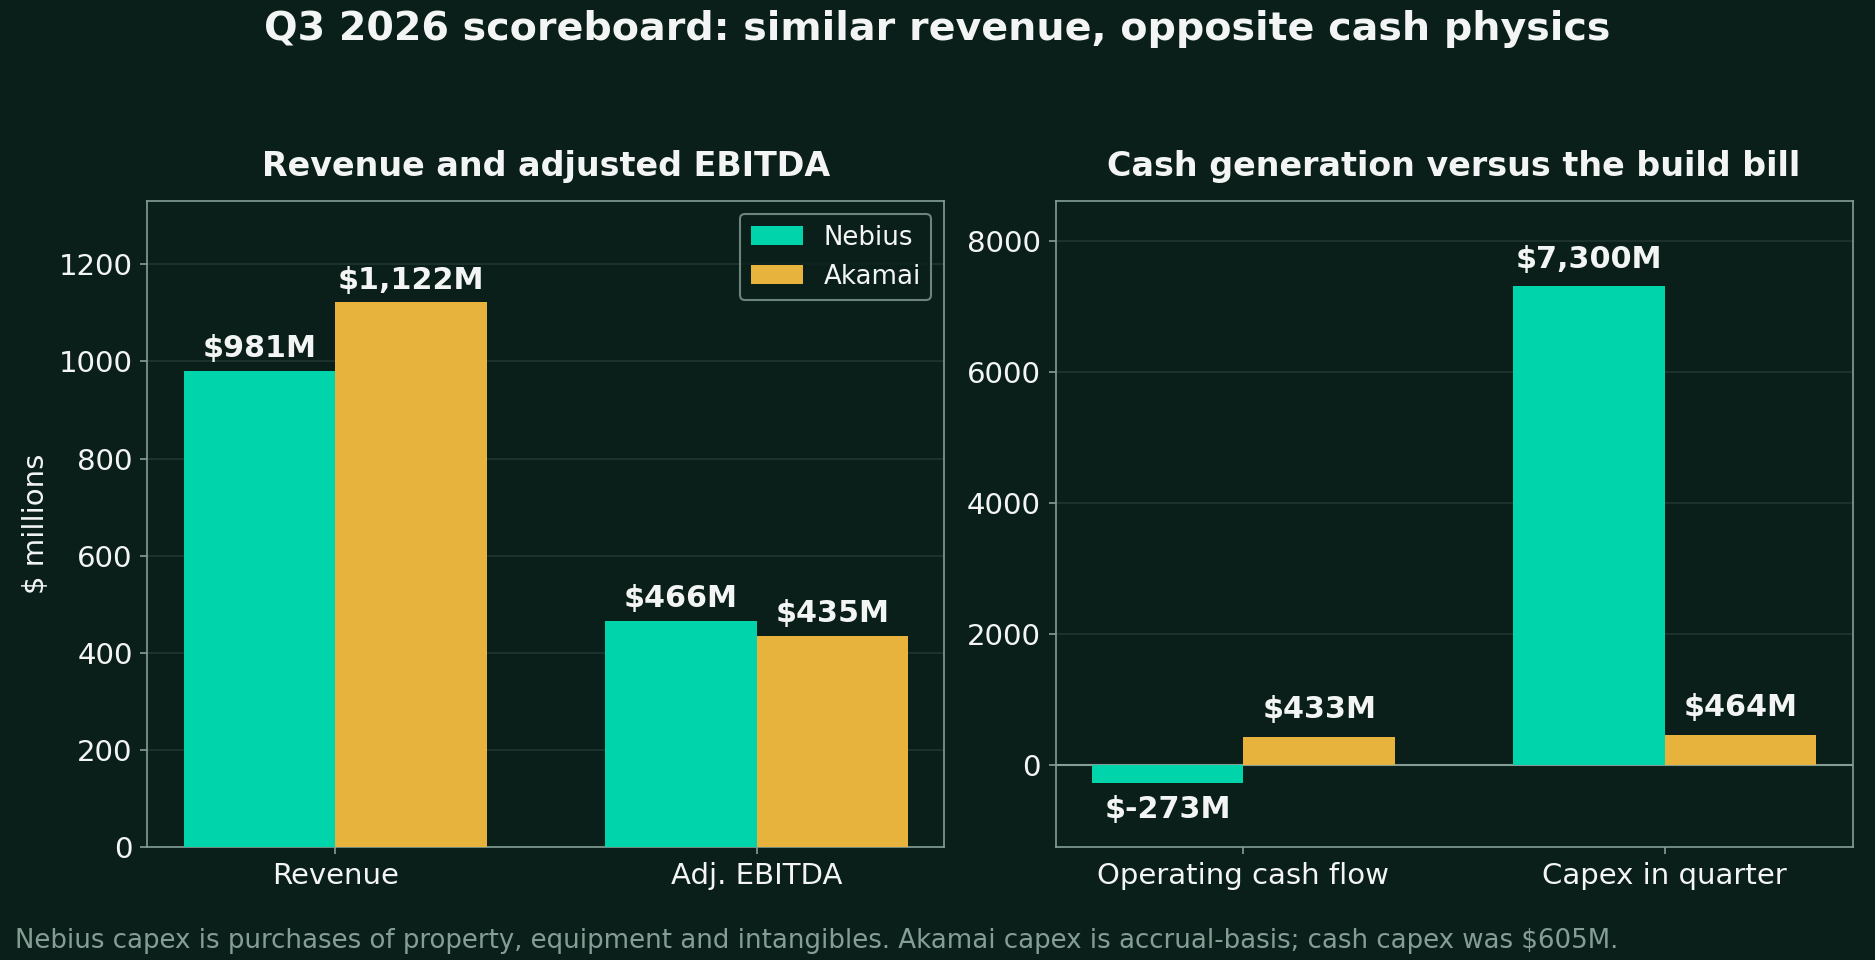
The two companies now print similar quarterly revenue. Everything below that line runs in opposite directions.
| Q3 2026 checkpoint | Nebius (NBIS) | Akamai (AKAM) |
|---|---|---|
| Revenue | $980.8M | $1,122.0M |
| Revenue growth year over year | +571% | +6% |
| Growth engine | AI cloud $973.8M (+643%) | Cloud Infrastructure Services $108.8M (+34%) |
| Rest of the mix | Non-core units about $7M combined | Security $621.9M (+9%) and Delivery $391.3M (-3%) |
| Adjusted EBITDA | $465.8M (47.5% margin) | $435.3M (39% margin) |
| GAAP net result | Loss of $37.5M from continuing operations | Income of $117.1M (EPS $0.77) |
| Operating cash flow | -$273.0M | +$433.0M |
| Capex in the quarter | $7,300.4M | $464.1M accrual and $605.2M cash |
| Cash and liquid assets | $7,425.6M cash plus $1,215.5M restricted | $4,239M |
| Total debt | $14,190.8M | $7,640M of convertible principal |
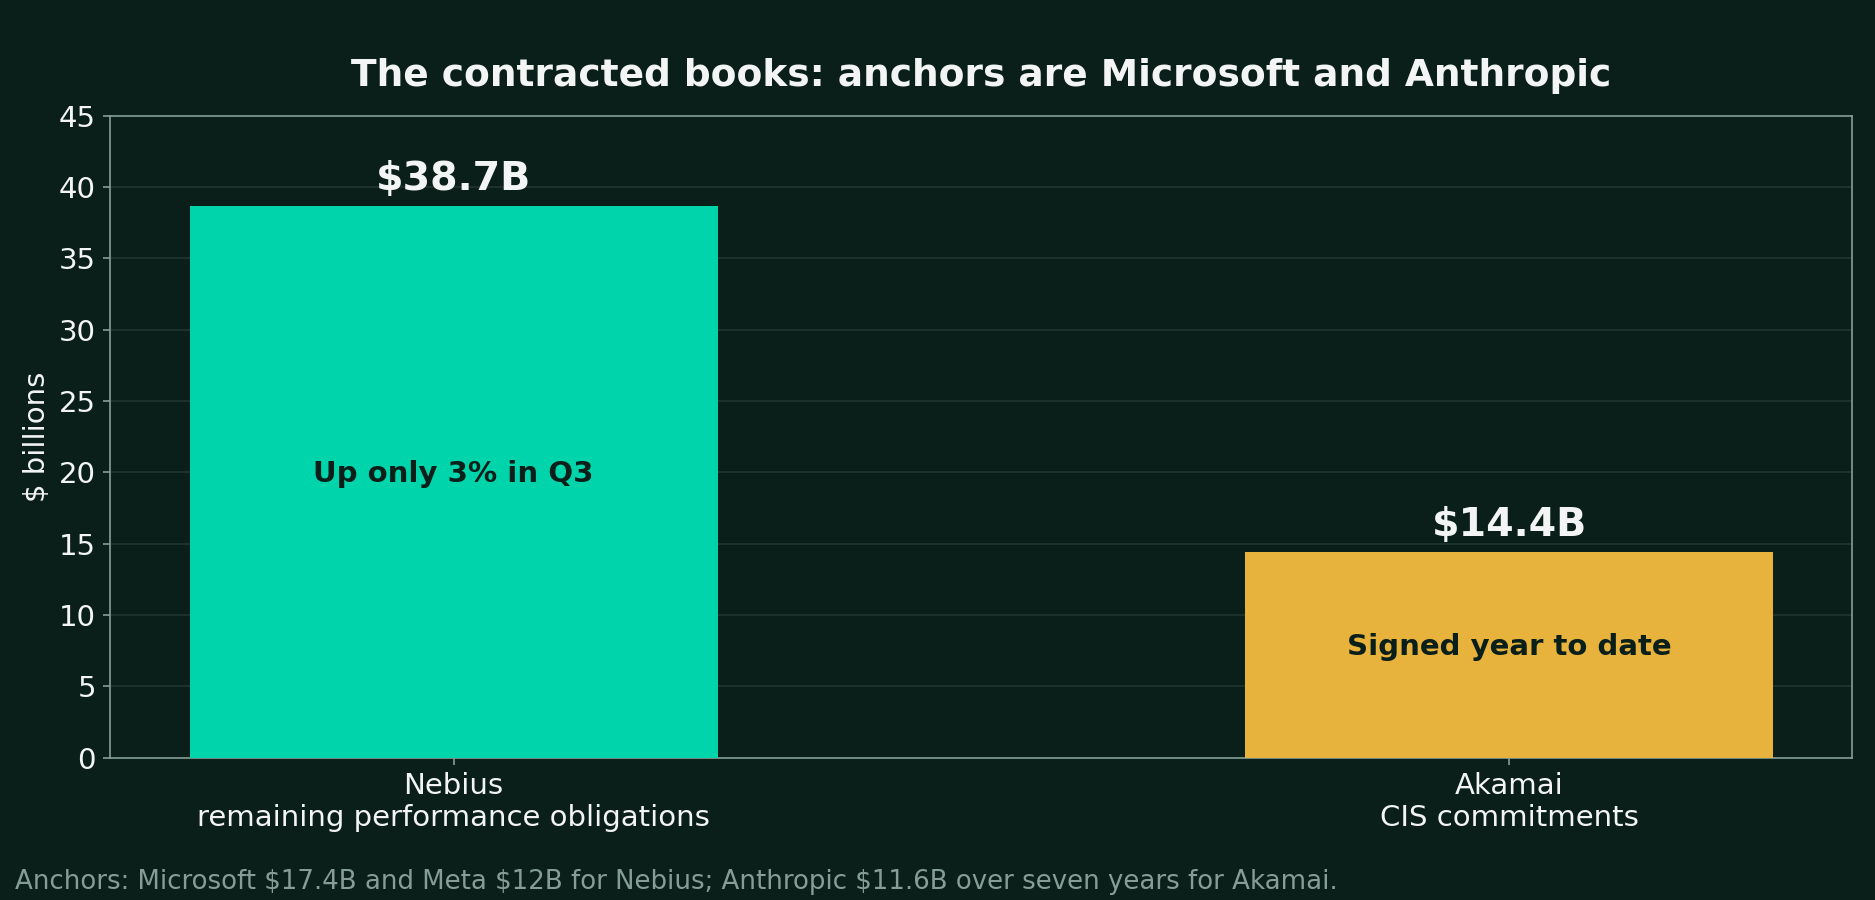
| Contracted book | RPO of $38.7B | CIS commitments above $14B |
| Share count | 292.9M legal and about 314M on the EPS basis | 144.1M |
| Market value at the November 11 close | About $45.3B at $154.69 | About $12.50B at $86.68 |
What sits under the Nebius headline?
- About $325M of the revenue was non-recurring enablement work for the asset-light partner model.
- The recurring revenue base was about $656M for the quarter.
- Adjusted net income was positive at $90.9M while the GAAP result stayed a small loss.
- CoreWeave printed $3.66B of Q3 revenue with a $132.5B backlog on November 10, and Nebius shares rose 15.44% in sympathy the next day.
- The shares then fell hard on the print itself, trading near $127 intraday on November 12.
What sits under the Akamai headline?
- Security carried the quarter at $621.9M and grew 9%.
- Delivery shrank 3% to $391.3M and remains the melting third of the mix.
- GAAP operating margin compressed to about 10% as the build phase absorbed spend.
- Non-GAAP EPS of $1.77 fell 5% year over year.
- Full-year 2026 guidance stands at $4,440M to $4,465M of revenue.
How does each company fund the build?
Nebius funds the build with a stack of other people's money. Each layer is real, and each layer has its own condition attached.
| Nebius funding layer | Scale | Terms that matter |
|---|---|---|
| Customer prepayments | Deferred revenue of $9,409.2M at September 30 | Prepayments covered more than 100% of capex on Q3 deals |
| Convertible notes | About $13.43B of original principal remains from $14.25B issued | Eight series run to 2034 and conversion prices run from about $51 to above $300 |
| Asset-backed facility | $775M drawn in July 2026 | Priced at 1M SOFR + 2.50% and secured by deployed GPUs plus contracted cash flows |
| Citi bridge | $3.5B signed October 17, 2026 | A 364-day term that matures October 16, 2027 |
| ATM equity | About 7.67M shares remain | Worth about $1.0B at recent prices |
| NVIDIA pre-funded warrants | $2.0B paid in March 2026 | Covers 21,065,936 shares at $94.94 with a nominal strike and no expiry |
Does the Nebius 2027 funding math close?
| 2027 funding line | Figure |
|---|---|
| Capex guidance | $40B to $45B |
| Coverage claimed from prepayments and asset-backed financing | 75% to 85% |
| Residual gap on disclosed figures | About $6.0B to $11.25B |
| Cash at September 30, 2026 | $7,425.6M |
| Bridge maturing inside the window | $3.5B on October 16, 2027 |
- Management has never quantified asset-backed capacity in dollars.
- The bridge matures inside the very window it helps fund.
- Weighted share count rose about 24% year over year, and the dilution ceiling reaches about 395M shares if every convert converts.
- Receivables jumped to $4,039.9M in the quarter, and the filing does not name the debtor.
How does Akamai fund its build?
- Liquid assets of $4,239M stand against $7,640M of convertible principal.
- Five convertible series mature from September 2027 to May 2033.
- Q4 2026 capex is guided at $2,445M to $2,645M in a single quarter.
- The company plans to buy $1.7B of memory and critical components in Q4.
- Full-year 2026 capex guidance is $3,462M to $3,662M. Revenue guidance for the same year is $4,440M to $4,465M.
- Management aims to fund the build and the 2027 maturity from cash and operating cash flow with measured incremental financing.
- Akamai bought back no shares in Q3 after spending $615.7M in the first nine months at a $123.19 average price.
- Authorization of $564.8M remains on the current buyback program through June 2027.
The contrast is structural. Nebius must keep four funding taps open at once through 2027. Akamai must keep its own cash engine running and refinance one maturity on time.
How firm is the contracted backlog?
What does the Nebius book actually promise?
- RPO reached $38.7B at September 30 and grew only 3% in the quarter.
- More than $12B of new contract value was signed across the same quarter.
- Microsoft's $17.4B agreement is subject to deployment and availability with per-tranche termination rights.
- Meta committed $12B of dedicated capacity from early 2027 on the Vera Rubin platform.
- A further $15B from Meta is a backstop on unsold capacity rather than firm volume.
- Deferred revenue of $9,409.2M shows how much of the book customers have already paid for.
- Databricks and Datadog and Snowflake signed first multi-year agreements in the quarter. Palantir named Nebius a preferred sovereign AI infrastructure partner in September.
What does the Akamai book actually promise?
- CIS commitments signed year to date exceed $14B.
- Anthropic accounts for $11.6B over seven years, and the workloads are CPU based.
- A further $9B Anthropic option sits outside the 2028 revenue projection.
- The first three large deals total $2.8B, and two already recognize revenue.
- The third deal starts recognizing revenue in Q4 after final testing.
- Payments on the book are gated by service levels and delivery milestones.
Both books lean on one anchor tenant. Microsoft anchors the Nebius book and Anthropic anchors the Akamai book, and each company carries the same concentration question at a different scale.
What does one unit of capacity earn?
| Unit economics checkpoint | Nebius | Akamai |
|---|---|---|
| Contract value per MW | Above $25M of annual contract value on Q3 deals | About $22M of annual revenue per MW on this year's large deals |
| Pricing direction | Q3 deals priced more than 20% higher per GPU-hour than Q2 deals | Recent deals priced above the anchor book, and the anchor deal sets the floor |
| Payback or return | Payback of 1 year 7 months excluding prepayments | About 13% after-tax IRR at full ramp on the $14B book |
| Margin at scale | AI cloud adjusted EBITDA margin of 53.2% in Q3 | About 75% adjusted EBITDA margin at full ramp on the book |
| Second engine | Token Factory runs at a multi-hundred-million-dollar rate with contract value up 17x in the quarter | Akamai Inference and Agent Sandbox launched October 27 and both sit in beta |
Nebius unit economics are scarcity priced and still rising. Akamai unit economics are contract priced and deliberately capped. The first model can surprise in both directions within a single year.
The anchor book math is the whole Akamai debate in one line. A book above $14B yields about $2.2B of annual revenue at full ramp, and that revenue earns utility-like returns on hyperscaler-like build risk.
Who executed better this quarter?
Nebius missed on the item it controls least and chose most. The Vineland site serves Microsoft, and its builder DataOne retired temporary diesel generation ahead of permanent power. The reset schedule now delivers more than half of the contracted capacity by the end of 2026, and the remaining tranches land in Q2 2027.
The guidance tells the same story in numbers. Full-year 2026 revenue guidance held at $3.0B to $3.4B and moved to the low end, and the December ARR target of $7B to $9B moved to above $7B by February 2027. The ARR metric itself retires in 2027 as guidance shifts to revenue and capacity.
The owned sites tell a better story. The Independence site in Missouri runs ahead of schedule at 1.1 GW of planned capacity, and contracted power targets 5 GW by the end of 2026. Other colocation delivery dates still slipped into the first half of 2027.
Akamai's slip was smaller and priced in the open. Supply-chain and third-party data-center delays moved about $30M of revenue out of Q4 and into 2027, and management stated there are no penalties and no change to total contract revenue. The issues were described as resolved on the call.
The credibility question came from the analysts directly. Piper Sandler noted that Akamai has missed or merely met compute expectations in nearly every quarter, and the answer rested on signed contracts with secured power rather than pipeline hope. The guide itself is the execution test: CIS revenue must reach $1.1B to $1.3B in 2027 on a back-loaded ramp with about 70% to 75% landing in the second half.
Where does the moat sit in each model?
The Nebius moat is a full stack that ships like software. The Aether platform versions like a product, and the asset-light partner model installs that stack on other people's capacity. NVIDIA Reference Platform status puts Nebius in a club of about six providers globally for validated AI factories.
The evidence for pricing power is the strongest in the file. Q3 deals priced more than 20% higher per GPU-hour than Q2 deals, and prepayments covered more than the full capex on those deals. The limit is equally clear: Nebius rents its two scarcest inputs, since NVIDIA controls GPU allocation and power developers control energized sites.
The Akamai moat is a footprint that cannot be rebuilt on a venture timeline. More than 4000 points of presence reach 130 countries after 25 years of build-out, and management notes that well over 90% of cloud servers run on CPUs rather than GPUs. Anthropic's choice is the revealed preference: a frontier lab paid $11.6B for CPU capacity on this network rather than building its own edge.
Security and egress economics deepen the same moat. Workloads that move data constantly pay less to leave Akamai than to leave a hyperscaler, and the security business gives enterprise buyers one contract for capacity and protection. That combination is why the anchor tenant signed for seven years.
How do the five pillars grade?
Nebius: 65 of 100, Selective Positive
| Pillar | Grade | Evidence |
|---|---|---|
| Sunrise | PASS | Revenue grew 571% and the first 2027 guide opens at $12B to $13B |
| Management | PARTIAL | Vineland slipped on a partner the company chose and the ARR target moved in the miss quarter |
| Moat | PARTIAL | Pricing power is proven and the supply of GPUs and power is still rented |
| Iron Fortress | PARTIAL | Debt of $14.19B stands against cash of $7.43B with a $3.5B bridge due in 2027 |
| Free Cash Flow | FAIL | Operating cash flow was negative $273.0M in Q3 and 2027 capex is guided at $40B to $45B |
Akamai: 76 of 100, Positive
| Sunrise | PASS | CIS grew 34% and the 2027 segment guide is $1.1B to $1.3B inside a 17% to 22% company growth guide |
| Management | PASS | The 2027 guide sits in the written release and rests on signed contracts |
| Moat | PASS | The edge footprint and the Anthropic commitment validate the distributed inference lane |
| Iron Fortress | PARTIAL | Convertible principal of $7.64B includes a 2027 maturity inside the build window |
| Free Cash Flow | PARTIAL | Operating cash flow hit $433.0M in Q3 and the build consumes it through 2027 |
What are the scenarios worth?
- Nebius trades at about 4x its guided 2027 revenue at the November 11 close.
- The November 12 intraday fall toward $127 cut that multiple to roughly 3x.
- Akamai trades at about 2.8x guided 2026 revenue and about 1.8x guided 2028 revenue.
- The horizons differ by design, since the Nebius targets are FY2029 model values and the Akamai scenarios are 2028 values as published.
Nebius FY2029 scenarios (DalalBytes estimates)
| Case | FY2029 revenue | EV/Sales | Diluted shares | Target vs $154.69 |
|---|---|---|---|---|
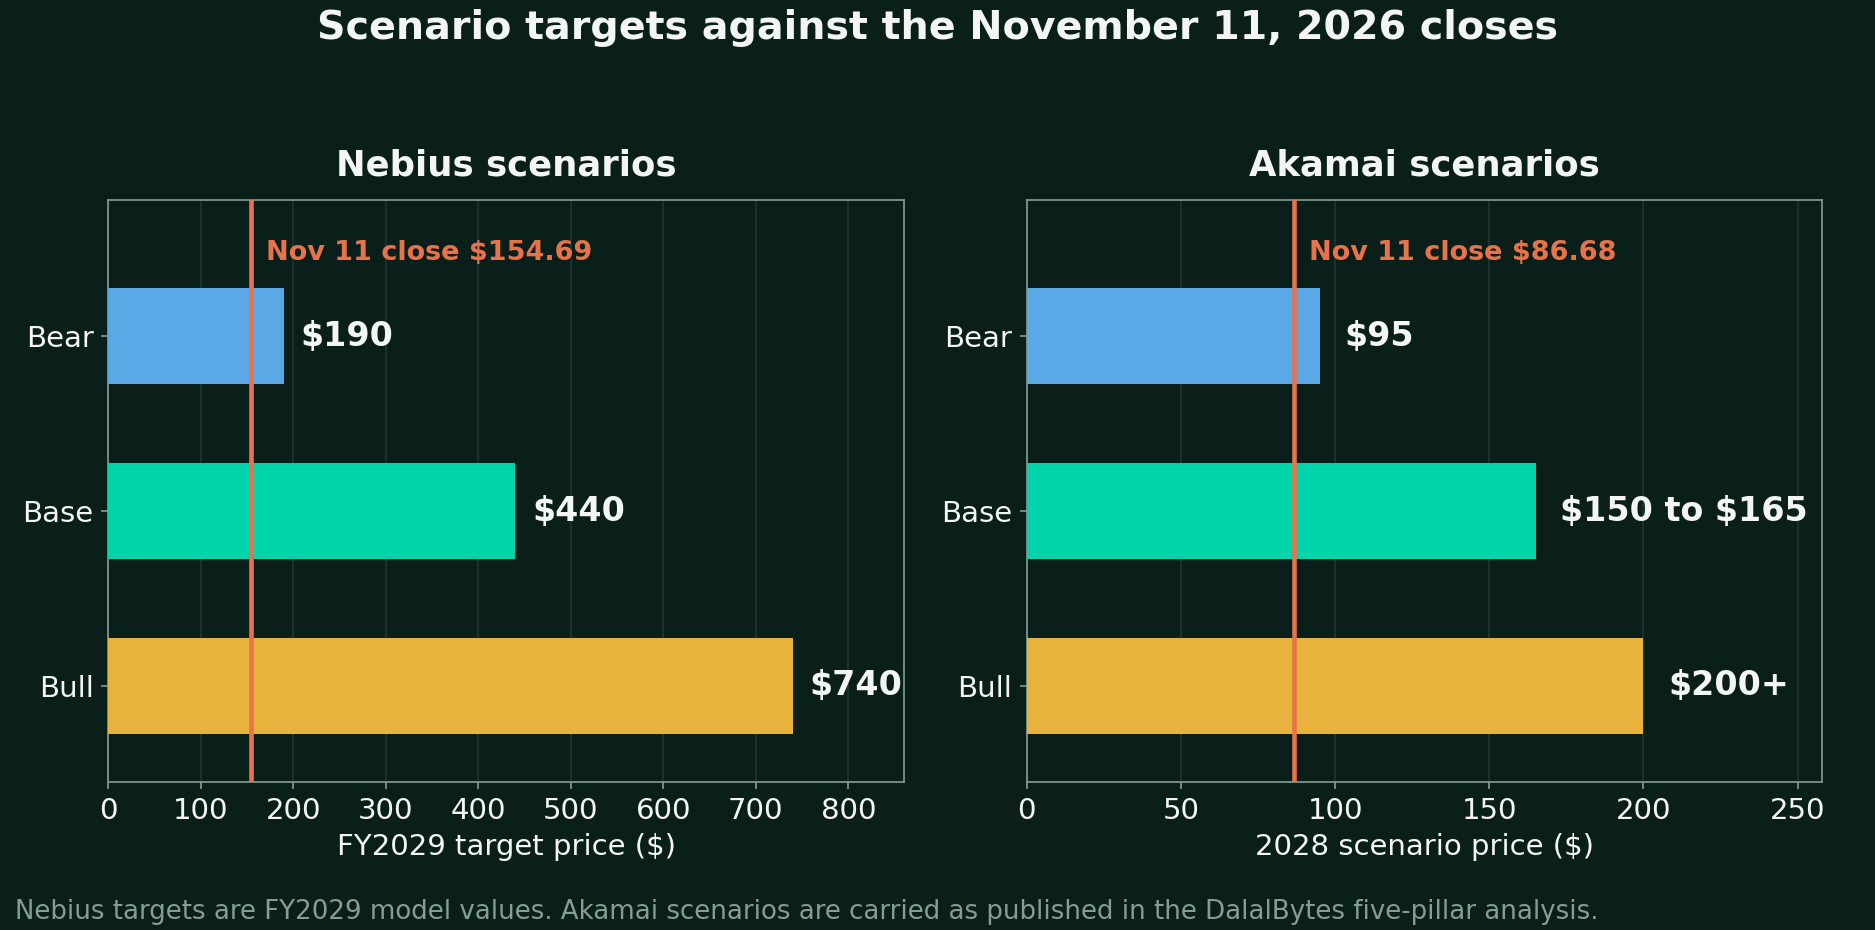
| Bear | About $19B | 4x | 406M | $190 (+23%) |
| Base | About $26B | 7x | 411M | $440 (+184%) |
| Bull | About $30B | 10x | 403M | $740 (+378%) |
- The bear case is mediocrity rather than collapse, with the 2027 guide missed and the funding gap filled with equity at weak prices.
- The base case lands the 2027 guide at its midpoint and compounds from contracted capacity.
- The bull case holds the scarcity multiple while Token Factory and the platform layer lift the mix.
- Each $1B of 2027 revenue is worth about $36 per share in the base case, and one turn of the exit multiple is worth about $63 per share.
Akamai 2028 scenarios (as published)
| Case | Basis | Target vs $86.68 |
|---|---|---|
| Bear | Execution stumbles and the multiple compresses | About $95 (+10%) |
| Base | The Anthropic book delivers on schedule and 2027 growth lands | About $150 to $165 (+73% to +90%) |
| Bull | The $9B option vests and more frontier customers sign | About $200+ (+131% or more) |
Akamai scenarios are carried as published in the DalalBytes five-pillar analysis of the company. The score above is the current one, and the scenario set is the published one.
What could go wrong?
The Nebius risk stack starts with the funding window. Four taps must stay open together while a $3.5B bridge matures in October 2027, and a single closed tap forces equity issuance at whatever price the market offers that month. Concentration compounds the funding risk, since Microsoft and Meta dominate the contracted book and a retrenchment by either hits revenue and borrowing capacity together.
Execution is the third Nebius rail. Another delivery slip converts conditional backlog into terminated tranches, and the server fleet now depreciates over five years rather than four. That accounting choice flatters the margin path and the Q4 2027 pre-tax breakeven target at the same time.
The Akamai risk stack starts with return math. A book that earns about 13% after tax can deliver every contract on schedule and still disappoint per-share compounding, and the market already prices the stock at 1.8x the guided 2028 revenue. Concentration mirrors the Nebius problem at a smaller scale, since Anthropic is the anchor tenant and payments are gated by service levels.
The build itself is the third Akamai risk. A capex quarter near $2.5B and $1.7B of component pre-buys leave no slack for a memory price spike or a colocation delay, and Delivery keeps shrinking underneath the transition. The February print is where each of these risks gets its first mark.
What would change each score?
- Nebius up. Q4 revenue at or above the implied $1.04B with Vineland tranches landing on the reset schedule moves the score back toward 70.
- Nebius down. Another delivery slip or a distressed equity raise takes the score under 60.
- Akamai up. The 2027 maturity termed out early plus a Q4 print with the CIS ramp starting on schedule restores 78 and opens the path higher.
- Akamai down. A February cut to the 2027 CIS range takes the score below 70.
- Watch markers. Nebius Q4 revenue against the $1.04B mark and Vineland deliveries against the reset schedule. Akamai CIS phasing in the February print and any early move on the 2027 Akamai maturity.
Sources
Nebius Group Q3 2026 earnings release and shareholder letter (Form 6-K, November 12, 2026). Nebius Q2 2026 interim financial statements (Form 6-K, August 12, 2026). Microsoft commercial agreement 6-K (September 8, 2025). Meta Infrastructure Service Agreement 6-K (March 16, 2026). NVIDIA Schedule 13G (July 2026). Akamai Technologies Q3 2026 earnings release and Form 10-Q (November 5, 2026). Akamai's earnings call was reviewed in transcript. Nebius's Q3 call color rests on its shareholder letter and earnings release, as no full transcript was publicly available. Market data as of November 11-12, 2026. All targets and scores are DalalBytes research estimates.
Disclosure
This report is for educational purposes only and is not investment advice, a recommendation, or an offer to buy or sell any security. All targets and scores are DalalBytes research estimates based on public information available as of November 12, 2026. Investing involves risk, including loss of principal. The author may hold positions in securities mentioned. Readers should conduct their own due diligence and consult a qualified financial advisor before making investment decisions.
Research and opinion, not investment advice. Do your own due diligence before investing.
© 2026 DalalBytes Research · For educational purposes only. Not investment advice.