

What is the verdict on Microsoft?
74/100. Positive. The strongest distribution machine in software is funding the largest build in its history out of its own cash flow, and the stock at $521.91 pays for the build's cost before it has to pay for the build's return.
What would change the score. The score rises if Azure growth holds at or above 45% through fiscal 2027 with Microsoft Cloud gross margin steady near 65% and free cash flow back to growth by fiscal 2028, and it falls if Azure growth drops below 35%, if Maia is still internal only at the end of 2027, or if a top AI workload moves from Azure to a rival cloud at scale.
| 74/100 | DalalBytes score |
| $521.91 | Reference price. October 30 2026 close |
| $3.88T | Market cap at 7427M shares |
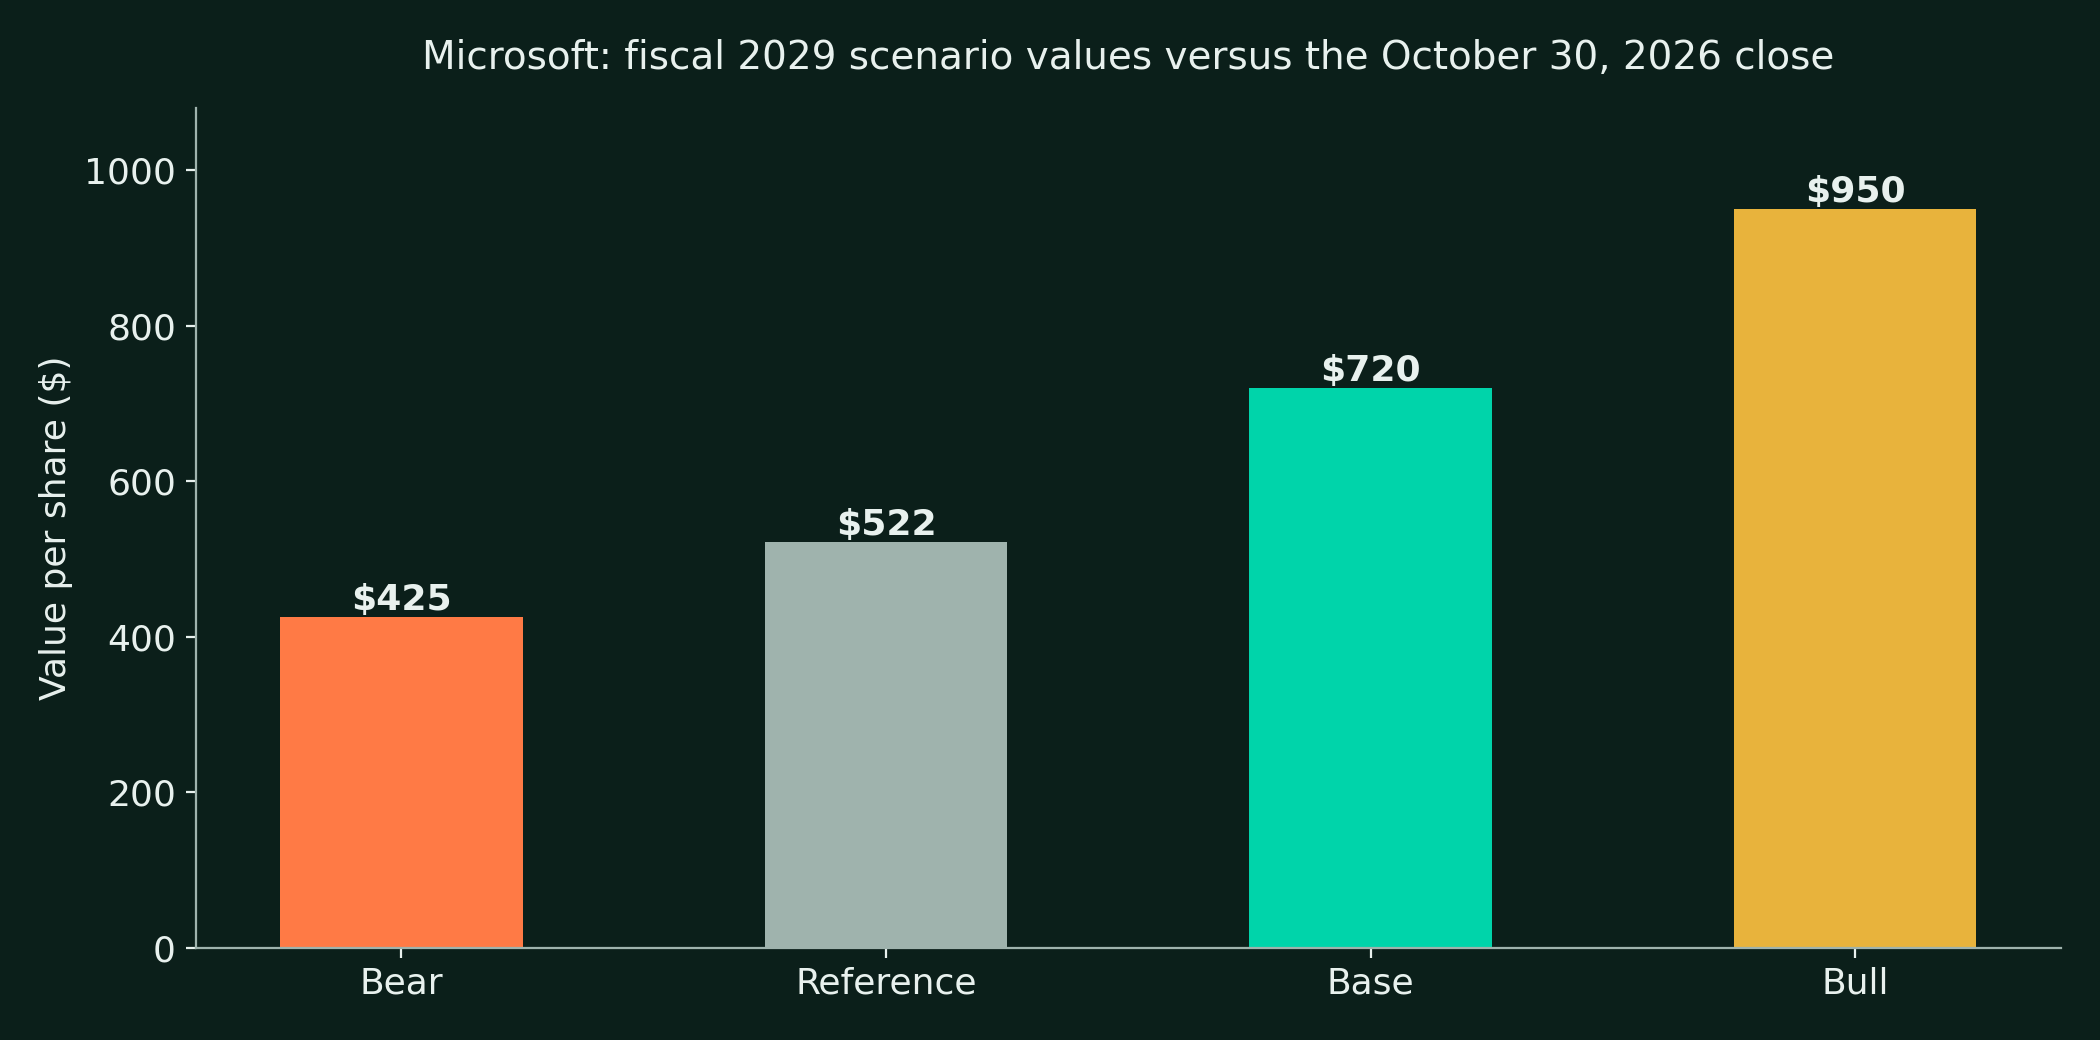
| $425 / $720 / $950 | Fiscal 2029 bear / base / bull |
Microsoft today is two facts at once. The first is a cloud business compounding at a rate no company of this scale has printed before. Azure produced $33.2B in a single quarter and grew 48%, commercial remaining performance obligations stand at $677B, and the company added 24 data centers in one quarter while still reporting that demand exceeds supply. The second fact is the bill. Capital expenditure runs near $170B in calendar 2026, free cash flow has fallen three years in a row, and the balance sheet now carries $364.6B of data center leases that have not yet commenced.
The argument is not whether the demand is real. A $677B contracted backlog and a 48% growth print settle that. The argument is what the build does to the cash line while it runs, and whether Microsoft's own silicon and its restructured OpenAI position leave it owning enough of the stack it is paying to construct. On silicon, Microsoft is the laggard of the four hyperscalers. Its Maia chips serve its own products only, three years after the first unveiling, while Google rents out its seventh TPU generation and Amazon fills a 500,000-chip cluster with Trainium. On OpenAI, Microsoft traded exclusivity for duration and equity, a defensible trade that still ends the era when the leading model company could only be reached through Azure.
Our base case has Azure decelerating in an orderly way, the legacy segments shrinking gently, and fiscal 2029 value at $720. The bear case is not a collapse case. It says the build overshoots, free cash flow stays depressed into fiscal 2029, and the multiple compresses to 21 times. That is the shape of the risk at $521.91. You are paid if the fortress compounds through the build, and the fortress is genuinely strong. You are not paid for a fast re-rating, because the price already assumes the build works.
The price basis of this report
This report uses the Friday October 30, 2026 Nasdaq close of $521.91 throughout. Microsoft has not yet announced the date of its fiscal Q2 2027 results as of November 2, 2026. Treat any calendar date for that print as an estimate until the company issues its announcement release.
What is Microsoft in one page?
Microsoft is based in Redmond, Washington, and trades on Nasdaq as MSFT. The modern company was rebuilt under Satya Nadella after 2014 around a simple reordering. Cloud first, subscriptions over licenses, and the enterprise relationship as the asset everything else rents. The fiscal year ends June 30, so fiscal 2027 began on July 1, 2026, and the latest reported quarter is Q1 fiscal 2027, ended September 30, 2026.
That reordering produced the largest contracted backlog in the industry. Enterprises sign multi-year agreements for Azure, Microsoft 365, security and support in a single negotiation, and the remaining performance obligation line now reads $677B. The customer rarely leaves, because the identity layer, the productivity suite, the developer platform and the cloud contract are the same relationship wearing four hats.
Two reporting changes in September 2026 mark where the company thinks it is going. Microsoft replaced its three segments with two, Agents and Infra and Devices and Consumer, and it began disclosing Azure revenue in dollars for the first time. The new segment names are a strategy statement. Agents and infrastructure are one business now, and the consumer devices business is reported as what it has become, a shrinking tail attached to a very large dog.
| Metric | FY2025 | FY2026 | Q1 FY2027 |
|---|---|---|---|
| Total revenue ($M) | 281,724 | 331,839 | 92,279 |
| Operating income ($M) | 128,528 | 155,237 | 45,915 |
| Net income, GAAP ($M) | 101,832 | 133,749 | 36,629 |
| Diluted EPS, GAAP | $13.64 | $17.95 | $4.92 |
| Operating cash flow ($M) | 136,162 | 182,935 | 58,000 |
| Free cash flow ($M) | 71,611 | 66,987 | 18,633 |
- Fiscal 2026 revenue grew 18% to $331.8B.
- Microsoft Cloud revenue reached $214.4B in fiscal 2026, up 27%.
- Q1 fiscal 2027 revenue grew 19% to $92.3B.
- The United States produced $170.8B of fiscal 2026 revenue, about 51% of the total.
- Shares outstanding were 7,427M at September 30, 2026, almost flat for three years.
How does Microsoft make money?
Microsoft reported three segments through fiscal 2026 and reports two from fiscal 2027. Both bases are shown here, because the old basis carries the three-year history and the new basis carries the future.
| Segment ($M) | FY2024 | FY2025 | FY2026 |
|---|---|---|---|
| Productivity and Business Processes revenue | 106,820 | 120,810 | 139,996 |
| Productivity and Business Processes operating income | 59,661 | 69,773 | 83,879 |
| Productivity and Business Processes operating margin | 55.9% | 57.8% | 59.9% |
| Intelligent Cloud revenue | 87,464 | 106,265 | 137,791 |
| Intelligent Cloud operating income | 37,813 | 44,589 | 56,972 |
| Intelligent Cloud operating margin | 43.2% | 42.0% | 41.3% |
| More Personal Computing revenue | 50,838 | 54,649 | 54,052 |
| More Personal Computing operating income | 11,959 | 14,166 | 14,386 |
| More Personal Computing operating margin | 23.5% | 25.9% | 26.6% |
| Total revenue | 245,122 | 281,724 | 331,839 |
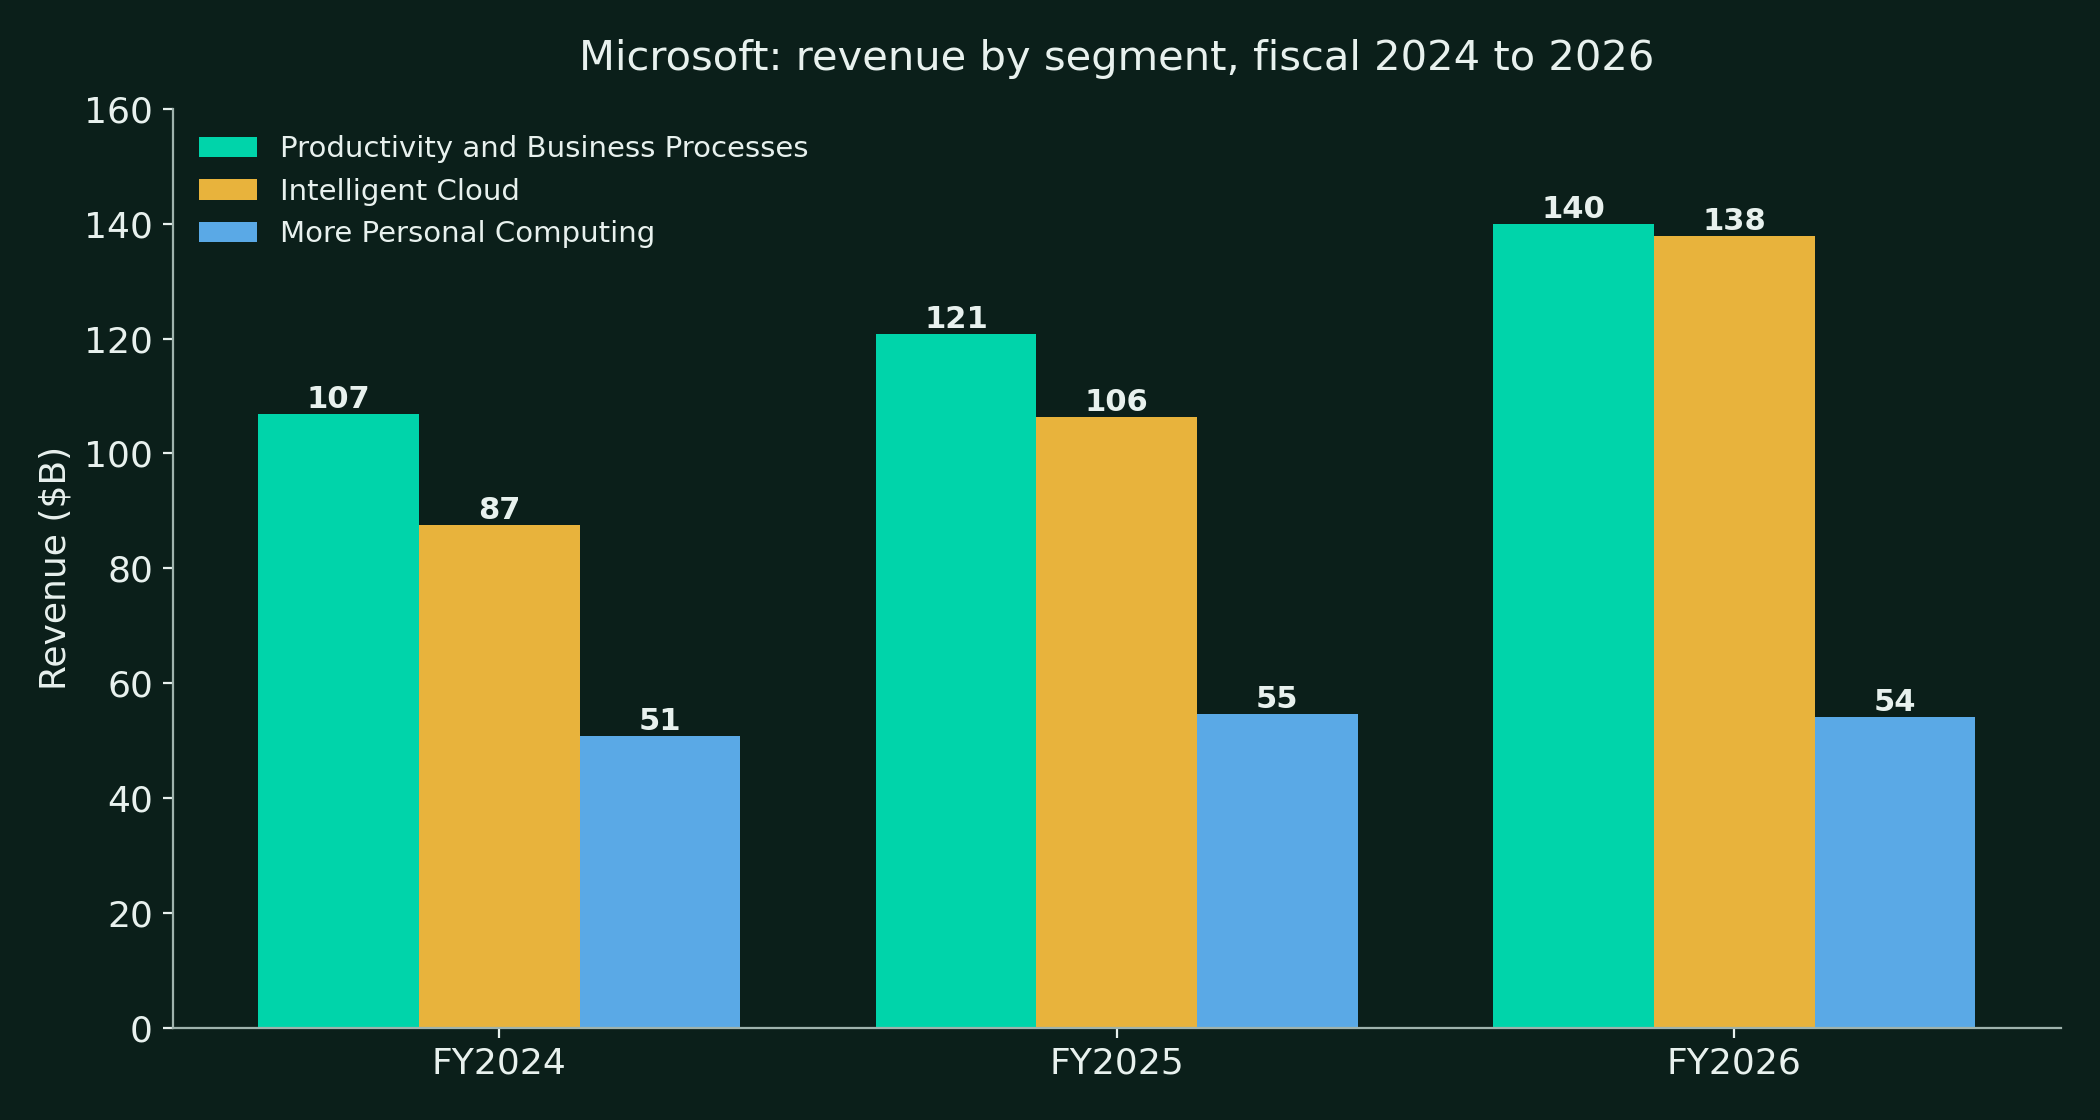
- Intelligent Cloud cost of revenue rose 44% in fiscal 2026 on AI infrastructure build-out.
- Intelligent Cloud gross margin compressed from 66.1% in fiscal 2024 to 58.0% in fiscal 2026.
- Productivity and Business Processes gross margin held near 82% through the same period.
- The mix shift toward Azure is therefore a stated margin trade, not a surprise.
The product lines inside the old basis
| Product line ($M) | FY2024 | FY2025 | FY2026 | FY2026 growth |
|---|---|---|---|---|
| Server products and cloud services | 79,828 | 98,435 | 129,425 | +31% |
| Microsoft 365 Commercial | 76,969 | 87,767 | 101,997 | +16% |
| XBOX | 21,503 | 23,455 | 21,790 | -7% |
| 16,372 | 17,812 | 19,817 | +11% | |
| Windows and Devices | 17,026 | 17,314 | 17,084 | -1% |
| Search advertising | 12,306 | 13,878 | 15,176 | +9% |
| Microsoft 365 Consumer | 6,648 | 7,404 | 9,175 | +24% |
| Dynamics | 6,831 | 7,827 | 9,006 | +15% |
| Enterprise and partner services | 7,594 | 7,760 | 8,260 | +6% |
The new basis, from fiscal 2027
- The Agents and Infra segment combines Microsoft Cloud, productivity and server licensing, and consulting and support services.
- The Devices and Consumer segment combines Windows, XBOX, and search and advertising.
- Azure was redefined in the same change. GitHub cloud, other developer cloud services and Security Copilot moved from Azure into Microsoft 365 commercial cloud.
- Healthcare and Life Sciences cloud moved into a new Industry solutions cloud metric.
- Prior periods were recast, with the recast filed on Form 8-K on October 28, 2026.
- On the recast basis, fiscal 2026 reads as about $277.8B of Agents and Infra revenue and $54.1B of Devices and Consumer revenue.
| Segment, new basis ($M) | Q1 FY2026 recast | Q1 FY2027 | Change |
|---|---|---|---|
| Agents and Infra revenue | 61,672 | 76,795 | +25% |
| Agents and Infra operating income | 32,718 | 40,558 | +24% |
| Agents and Infra operating margin | 53.1% | 52.8% | -0.3 ppt |
| Devices and Consumer revenue | 16,001 | 15,484 | -3% |
| Devices and Consumer operating income | 5,243 | 5,357 | +2% |
| Devices and Consumer operating margin | 32.8% | 34.6% | +1.8 ppt |
The product lines on the new basis
| Product line ($M) | Q1 FY2026 | Q1 FY2027 | Change |
|---|---|---|---|
| Azure | 22,384 | 33,165 | +48% |
| Microsoft 365 cloud | 23,694 | 27,778 | +17% |
| Productivity and server licensing | 8,678 | 8,407 | -3% |
| Search and advertising | 5,942 | 6,554 | +10% |
| XBOX | 5,508 | 5,379 | -2% |
| Industry solutions | 4,894 | 5,337 | +9% |
| Windows OEM and devices | 4,551 | 3,551 | -22% |
| Frontier and support services | 2,022 | 2,108 | +4% |
How big is Azure and how fast is it growing?
Azure is now a disclosed dollar line, and the first print is the strongest evidence in the report. Azure revenue of $33.2B in Q1 fiscal 2027 grew 48% year over year, ahead of the roughly 45% constant currency growth management guided for the quarter. Management guided Q2 fiscal 2027 Azure growth of 49 to 50% in constant currency, which is an acceleration guide given in the same breath as a warning that capacity deliveries slipped inside Q1.
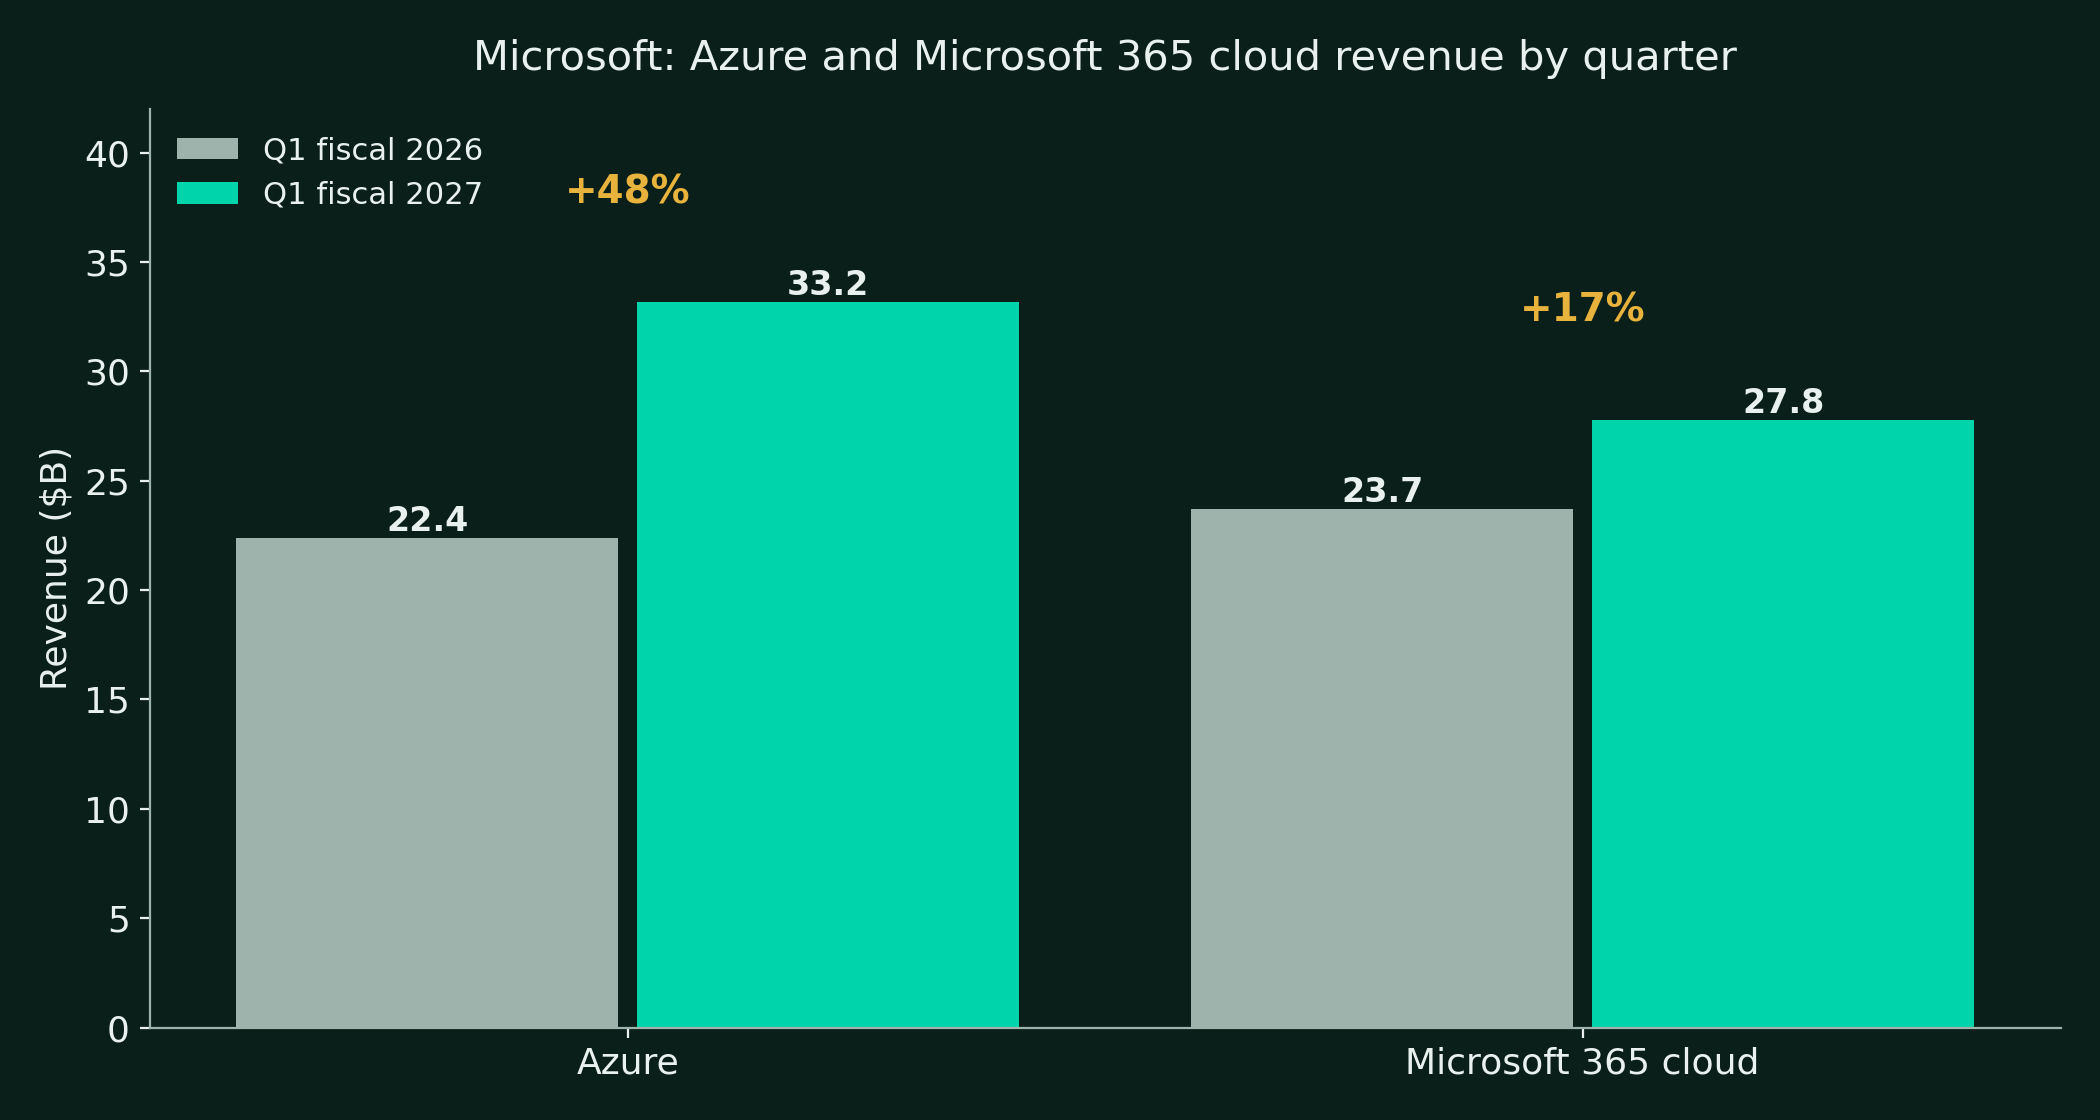
- Azure crossed $100B of revenue in fiscal 2026, up from about $75B in fiscal 2025 on the old presentation.
- Microsoft does not disclose an AI versus core split of Azure revenue in dollars.
- The growth evidence is workload-wide. Management describes continued growth across all workloads, with AI services the incremental driver.
- Microsoft Cloud revenue was $63.9B in Q1 fiscal 2027, up 30%.
- Microsoft Cloud gross margin was 65% in Q4 fiscal 2026 and is guided near 65% for Q2 fiscal 2027.
- Consolidated gross margin was 67.8% in Q1 fiscal 2027, from $62.6B of gross profit on $92.3B of revenue.
- Commercial bookings fell 12% in Q1 fiscal 2027 against very large Azure commitments in the prior-year quarter.
- The backlog line matters more than the bookings line at this scale. Commercial RPO of $677B carries a weighted average duration of 2.3 years, with about 30% recognized in the next 12 months.
Copilot and the agent layer
- Microsoft 365 Copilot passed 30 million paid seats in Q4 fiscal 2026, up from more than 20 million in April 2026.
- No updated paid seat total was given on the Q1 fiscal 2027 call, and Microsoft discloses no Copilot revenue line.
- Copilot daily users rose nearly 50% quarter over quarter and more than five times year over year.
- Automated tasks performed by agents nearly doubled between July 2026 and the Q1 call.
- Customers with more than 50,000 Copilot seats rose more than eight times year over year.
- Named large deployments include Capgemini, HCLTech, Hitachi Group, Truist and UK Revenue and Customs.
- Volkswagen is deploying Copilot to more than 330,000 employees.
- The E7 suite, which bundles Copilot with E5 security, Entra and Agent 365, was purchased by thousands of customers in the quarter, with adoption described in millions of seats.
- Copilot customers on usage-based credit billing rose more than 75% in the quarter.
- Microsoft 365 commercial cloud revenue was $27.8B, up 17%, or 18% adjusted for a prior-year recognition benefit.
- Microsoft 365 commercial seats grew 5%, so the cloud growth is mostly revenue per user, driven by Copilot, E5 and E7 upsell.
The platform around the models
- Microsoft Foundry customers reached 120,000, up 300% on the company's reporting.
- Fabric paid customers reached 44,000, up more than 50%.
- The Agent 365 registry holds more than 50 million agents, up 30% quarter over quarter.
- Agent-generated pull requests on GitHub rose six times in six months, and agents now open more than a third of all pull requests.
- The company's own MAI model family reached the Build stage in June 2026, and MAI-Base-2 is claimed at four to twelve times the training compute efficiency of tested open-weight models.
- Demand still exceeds supply, per management, and 24 data centers were added in the quarter.
Where does Microsoft stand on custom silicon?
Every hyperscaler is trying to own more of its compute stack, and Microsoft is the furthest behind of the four. Google is on its seventh TPU generation and rents Ironwood to customers at $12.00 per chip-hour on demand. Amazon has nearly 500,000 Trainium2 chips in Project Rainier and sells capacity by the block. Microsoft's Maia program, three years after its first unveiling, still serves Microsoft's own products only and has never been offered to an Azure customer.
| Program | First shown | Status at November 2026 | Sold to customers |
|---|---|---|---|
| Google TPU | 2016 era | Ironwood, seventh generation, in production | Yes, published price ladder |
| Amazon Trainium | 2020 era | Trainium2 at cluster scale, Trainium3 in docs | Yes, capacity blocks only |
| Meta MTIA | 2023 era | Extended through 2029 on 2nm, over 1 GW initial | Internal, by design |
| Microsoft Maia | November 2023 | Maia 200 in production internally, Maia 300 targeted 2027 | No |
- Maia 100 was unveiled in November 2023 and was never broadly deployed externally.
- Maia 200, internal codename Braga, slipped about six months from 2025 into 2026 amid design revisions and chip team turnover.
- Maia 200 launched in January 2026 on TSMC 3nm and runs in Arizona and Iowa data centers.
- It serves inference for GPT-5.2 through Microsoft Foundry and for Microsoft 365 Copilot.
- Microsoft confirmed on October 12, 2026 that Maia 200 is in production for Copilot and the MAI model team across the US, Europe and Australia.
- GitHub Copilot and Foundry workloads are scheduled to follow by the end of 2026.
- The efficiency claim is up to 1.7 times more tokens per watt on built-in AI features against leading GPU infrastructure. It is self-reported, with no named comparator or published methodology.
- Maia 300 was unveiled the same day, on TSMC N2P with eight HBM4 stacks, 288 GB of memory, up to 18 TB/s of bandwidth and a 950 W envelope.
- Production deployments of Maia 300 are targeted for 2027, with multi-gigawatt Maia deployments planned from 2027.
- Microsoft's stated intent is for Maia to become the primary inference system for its own products and services.
- Anthropic was reported in May 2026 to be in early talks to rent Maia 200 servers. No agreement has been signed or disclosed since.
- The dependence this leaves is measurable in the capex mix. Roughly three quarters of Q1 fiscal 2027 capital spending went to short-lived assets, meaning CPUs and GPUs bought from others, mostly NVIDIA and AMD.
- CTO Kevin Scott has stated the long-term goal is to rely primarily on Microsoft's own chips. The delivery record in section 10 grades that goal against its timeline so far.
What does the restructured OpenAI partnership look like?
The partnership that defined Microsoft's AI position has been restructured twice in a year, and both restructurings moved in the same direction. Microsoft kept the economics and gave up the exclusivity.
- Under the October 28, 2025 recapitalization, Microsoft holds about 27% of OpenAI Group PBC, a stake valued at about $135B against a group valuation of about $500B.
- OpenAI committed in the same agreement to purchase an additional $250B of Azure services.
- Microsoft gave up its right of first refusal as OpenAI's compute provider in that agreement.
- Microsoft's intellectual property rights in OpenAI models run through 2032.
- The April 27, 2026 amendment made the intellectual property license non-exclusive and removed the AGI trigger, moving revenue share payments onto fixed dates.
- Microsoft no longer pays a revenue share to OpenAI. OpenAI continues paying Microsoft, at about 20%, through 2030, subject to a total cap.
- OpenAI may now serve its products on any cloud. Microsoft remains the primary cloud partner, and OpenAI products ship first on Azure where Microsoft can and chooses to support them.
- On April 28, 2026, OpenAI models went live on AWS Bedrock, after Amazon's $50B investment in OpenAI and OpenAI's $38B AWS cloud commitment.
- Microsoft's total funding commitments to OpenAI are $13B, of which $11.8B was funded at March 31, 2026. The investment is carried on the equity method.
- The stake is now a marked asset on the income statement. Fiscal 2026 carried a net gain from OpenAI of about $5.0B, worth $0.67 of EPS.
- Q1 fiscal 2026 carried a net loss of $3.1B from OpenAI, worth $0.41 of EPS, and Q1 fiscal 2027 a net gain of $207M.
- Microsoft also holds an investment in Anthropic, on which it recognized a gain of about $3.2B in Q4 fiscal 2026.
- Our read of the sequence is in the roadmap audit. Microsoft traded a wasting asset, exclusivity over a partner determined to diversify, for a $250B purchase commitment, a 27% stake and payment terms that survive the partnership's loosening.
How strong is the moat?
The moat is the enterprise agreement. Microsoft's largest customers do not buy products, they renew a relationship that bundles identity, productivity, security, developer tooling and cloud capacity into one contract with one counterparty. The $677B remaining performance obligation is that relationship expressed as a number, and it grew 73% in a year when the company was supposedly at risk of being disrupted by the model companies.
The second wall is the seat base. Microsoft 365 commercial cloud produced $27.8B in one quarter on seat growth of only 5%, which means the growth is coming from selling more to the same seats. Copilot, E5, E7 and Agent 365 all attach to a seat Microsoft already owns, and each attachment raises the cost of leaving. A rival can build a better model. It cannot rebuild the installed identity and document estate the model has to live inside.
The third wall is the cash itself. Operating cash flow of $182.9B in fiscal 2026 funds a $170B calendar-year build without the capital markets setting terms. When capacity is the scarce input, the buyer who can write the check first gets the allocation, and Microsoft's fortress is what converts a capex race from a financing problem into an execution problem.
- Commercial RPO of $677B grew 73% year over year, with a weighted average duration of 2.3 years.
- More than 50,000-seat Copilot customers rose more than eight times year over year.
- Microsoft 365 commercial cloud revenue per user rises through Copilot, E5 and E7 upsell on 5% seat growth.
- The moat is narrowest at the model layer, where Microsoft rents intelligence it does not fully own.
- The Maia record in section 5 and the OpenAI terms in section 6 are the two tests of that boundary.
How does Azure stack up against AWS and Google Cloud?
The cloud race is now run in disclosed dollars, and the three leaders print within the same quarter. Azure's $33.2B at 48% growth sits between AWS at a larger scale and slower growth, and Google Cloud at a smaller scale and a growth rate flattered by a low base and capacity coming online.
| Cloud | Latest quarter revenue | Growth | Notes |
|---|---|---|---|
| AWS | $45.98B | +39.3% | Segment margin 38.7%, backlog $578B, per DalalBytes earnings coverage |
| Azure | $33.17B | +48% | First quarter of dollar disclosure, Q1 fiscal 2027 |
| Google Cloud | $30.71B | +103% | Per DalalBytes earnings coverage of Alphabet's Q3 2026 |
- AWS remains the revenue leader and converts at a 38.7% segment operating margin.
- Google Cloud is growing fastest off the smallest base of the three, with TPU capacity the differentiator.
- Azure grows faster than AWS on a base about three quarters of AWS's size.
- The competitive gap that matters is silicon. Google rents its seventh TPU generation, Amazon fills Project Rainier with nearly 500,000 Trainium2 chips, and Microsoft's Maia is not yet a customer product.
- Custom silicon is compounding across the industry. The DalalBytes Compute Price Reset article tracks custom silicon at 8% of the AI silicon dollar pool in 2024, 12% in 2025, 16% in 2026 and about 20% in 2027.
- Bernstein estimates NVIDIA holds about 75 to 80% of the AI silicon wallet, sliding toward 60% as custom programs scale.
- Meta codified the multi-vendor future in April 2026, extending MTIA through 2029 alongside about 6 GW of AMD capacity and millions of NVIDIA chips.
- Every point of wallet that moves to custom silicon moves to a chip Microsoft does not yet sell.
- At the model layer, OpenAI's arrival on AWS Bedrock in April 2026 ended Azure's exclusive shelf for the leading frontier models.
- Anthropic runs across AWS and Google as well as Azure, and its reported interest in renting Maia 200 capacity shows the model companies now shop the hyperscalers as much as the reverse.
What do the financial statements show?
| Fiscal year ($M) | FY2024 | FY2025 | FY2026 |
|---|---|---|---|
| Revenue | 245,122 | 281,724 | 331,839 |
| Gross profit | 171,008 | 193,893 | 225,465 |
| Gross margin | 69.8% | 68.8% | 67.9% |
| Operating income | 109,433 | 128,528 | 155,237 |
| Operating margin | 44.6% | 45.6% | 46.8% |
| Net income, GAAP | 88,136 | 101,832 | 133,749 |
| Diluted EPS, GAAP | $11.80 | $13.64 | $17.95 |
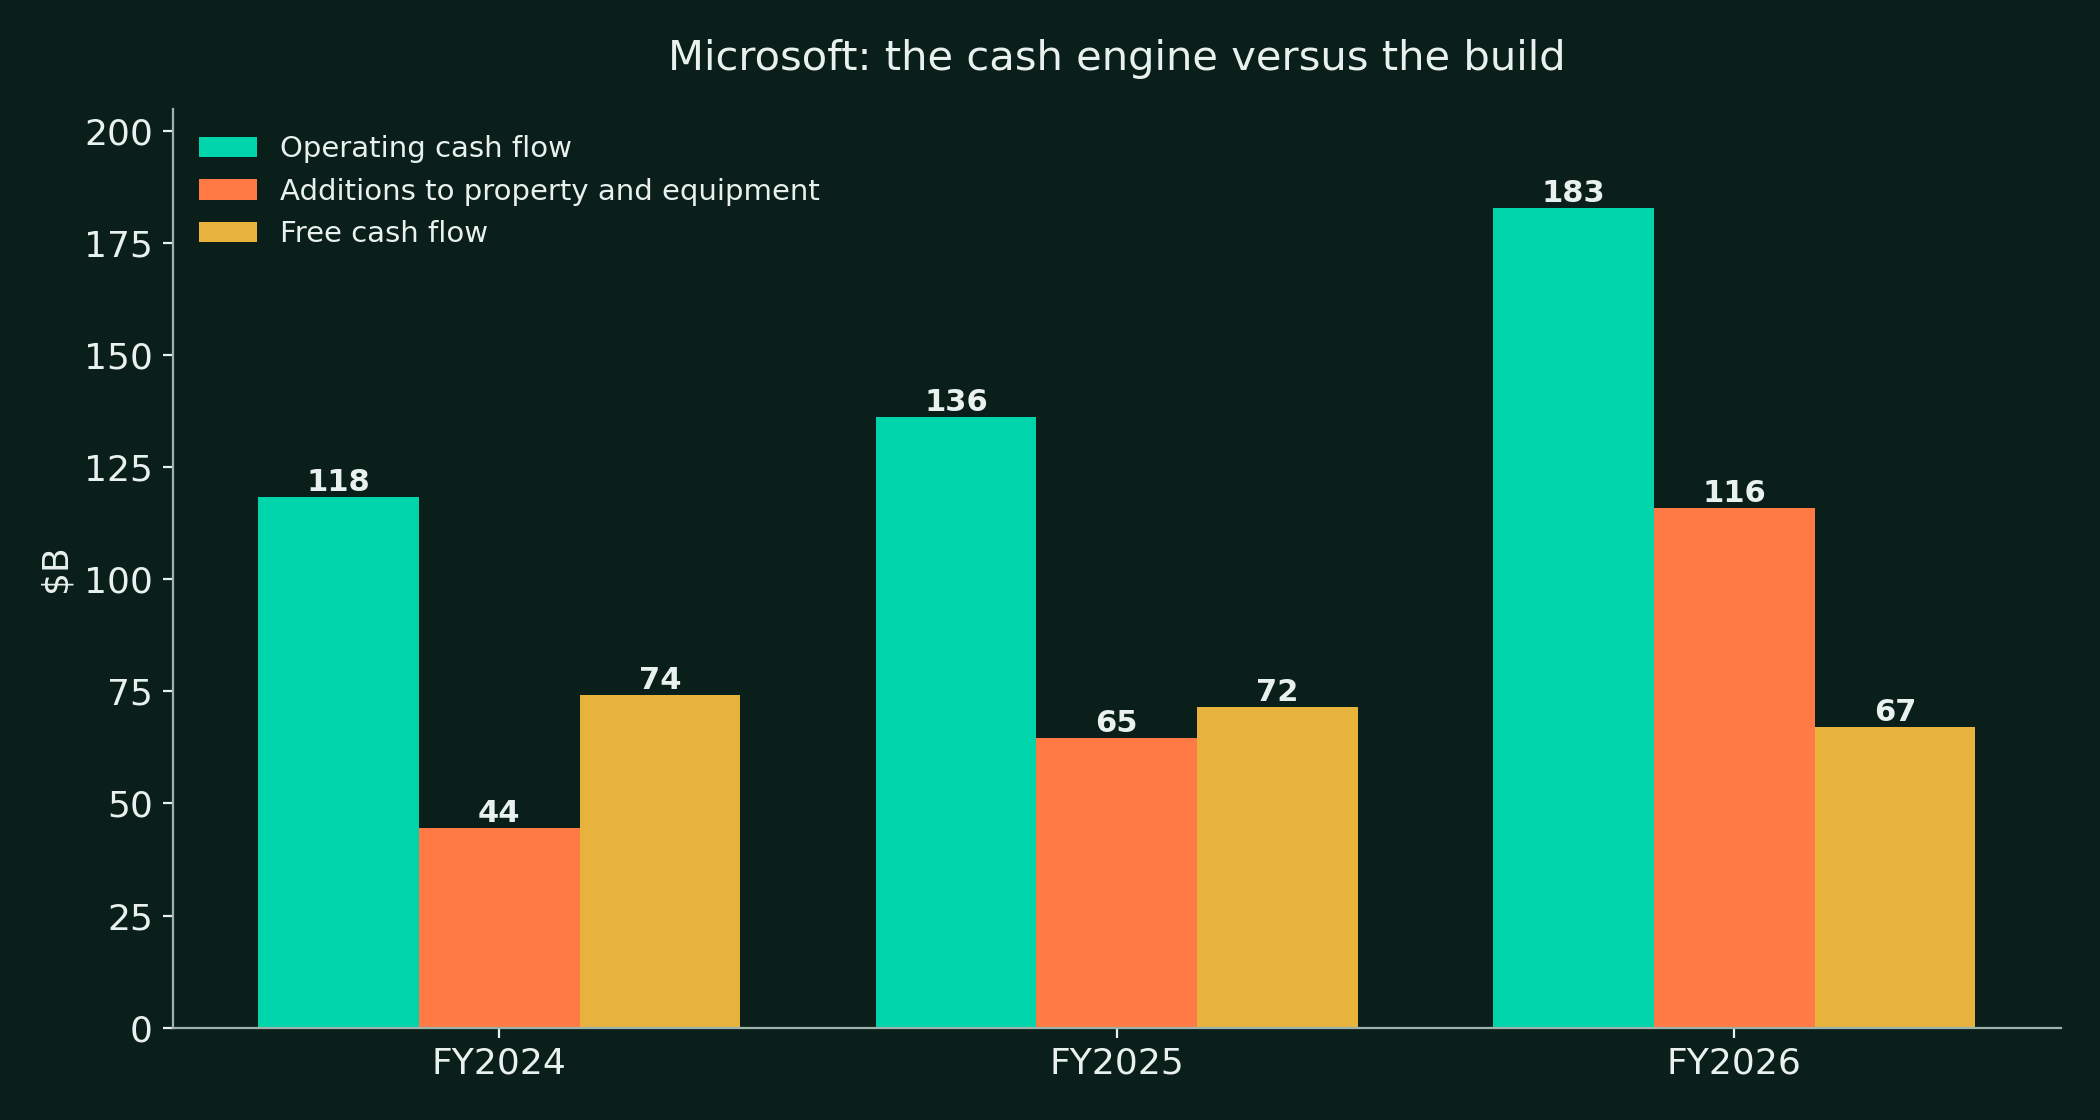
| Operating cash flow | 118,548 | 136,162 | 182,935 |
| Additions to property and equipment | 44,477 | 64,551 | 115,948 |
| Free cash flow | 74,071 | 71,611 | 66,987 |
| Stock-based compensation | 10,734 | 11,974 | 12,405 |
| Buybacks, cash | 17,254 | 18,420 | 22,271 |
| Dividends paid | 21,771 | 24,082 | 26,445 |
| Diluted shares (M) | 7,469 | 7,465 | 7,453 |
- Gross margin compressed about two points in two years on Azure mix, from 69.8% to 67.9%.
- Operating margin expanded anyway, from 44.6% to 46.8%, on operating expense leverage.
- Fiscal 2026 GAAP net income of $133.7B includes about $5.0B of net gains from the OpenAI investment.
- Non-GAAP fiscal 2026 net income was $128.8B and non-GAAP EPS was $17.28, excluding those investment effects.
- Q1 fiscal 2027 repeated the pattern in miniature. GAAP EPS of $4.92 against non-GAAP EPS of $4.89, with a $207M OpenAI gain in the quarter.
- Operating cash flow grew 34% in fiscal 2026 and 29% in Q1 fiscal 2027. The cash engine is not the problem.
- Capital expenditure is the story. Cash additions to property and equipment rose from $44.5B to $115.9B in two years.
- Q1 fiscal 2027 total capex including finance leases was $45.2B, of which finance leases were $7.4B and about three quarters went to short-lived assets.
- Free cash flow fell for the third straight period as a result, from $74.1B in fiscal 2024 to $67.0B in fiscal 2026, and fell 27% year over year in Q1 fiscal 2027 to $18.6B.
- Research and development was $35.6B in fiscal 2026, up 9%, at 11% of revenue.
- Stock compensation of $12.4B in fiscal 2026 is about 19% of free cash flow, a smaller deduction than at most large technology peers.
- The share count barely moves. Diluted shares of 7,453M in fiscal 2026 against 7,469M in fiscal 2024, because buybacks now offset issuance rather than shrink the count.
Has management delivered what it promised?
The fair test of this management team splits cleanly in two. On the demand side, the record is excellent. Azure growth was guided at about 45% in constant currency for Q1 fiscal 2027 and printed at 48%, Microsoft Cloud gross margin is landing where it was guided, and the Copilot seat count doubled its growth claims into 30 million paid seats by Q4 fiscal 2026. When Microsoft guides a revenue number for the next quarter, the number has been arriving.
On the supply side, the record is a build that keeps outrunning its own plan. Maia 100 was unveiled in November 2023 and never broadly deployed. Maia 200 slipped about six months and reached production only in early 2026, for Microsoft's internal workloads. The custom silicon program is three years old and has yet to produce a product a customer can buy, in the same period when Amazon filled a 500,000-chip cluster and Google shipped its seventh TPU generation. Management's stated goal of relying primarily on its own chips is a 2027-and-after claim, and the audit grades it as such.
The OpenAI line of the audit is the most interesting, because Microsoft chose its losses. Exclusivity was surrendered in two deliberate steps, in October 2025 and April 2026, and in exchange the company holds a $250B Azure purchase commitment, a 27% stake valued at about $135B, and a revenue share that now runs one way, toward Microsoft, through 2030. That is a rational trade of a decaying right for durable economics. It is still a trade down from the position of 2023, when the leading model company could be reached only through Azure, and the audit records both halves.
The capex line grades worst against the company's own framing. The build is being delivered. Capacity is arriving, 24 data centers in a single quarter. What has been deferred is the cash. Free cash flow has fallen three years in a row while management guides to a calendar 2026 capex figure near $170B and a Q2 figure above $50B, and the fiscal 2027 commitment on the Q1 call was that the company expects to remain free cash flow positive, a bar set at ankle height for a company that produced $74B of free cash flow two years ago.
| Commitment | Set when | Status at November 2, 2026 |
|---|---|---|
| Azure growth of about 45% cc in Q1 FY2027 | July 2026 call | Delivered 48%. Beaten |
| Azure growth of 49 to 50% cc in Q2 FY2027 | October 2026 call | Pending. Guided as acceleration |
| Microsoft Cloud gross margin near 65% | Q4 FY2026 call | Printed 65% in Q4 FY2026. Met so far |
| Maia 100 custom silicon program | Unveiled November 2023 | Never broadly deployed externally. Superseded |
| Maia 200 mass production | Originally 2025 | Slipped about six months. In internal production from early 2026 |
| Maia as a customer offering | Implied since 2023 | Not offered. Internal only at November 2026 |
| Maia 300 production deployments | Unveiled October 2026 | Targeted 2027. Pending |
| Copilot paid seats above 30 million | Disclosed Q4 FY2026 | Delivered. No revenue line disclosed alongside |
| OpenAI exclusivity | 2019 to 2025 agreements | Surrendered in two steps, October 2025 and April 2026 |
| Fiscal 2027 free cash flow positive | October 2026 call | Tracking. Q1 FCF of $18.6B was down 27% |
- The delivery record buys credibility for the Azure guidance.
- It does not buy the silicon timeline, which has slipped at every step so far.
- The audit's central finding is a split company. The selling machine delivers on schedule. The building machine spends on a schedule of its own.
How is the balance sheet funded and what comes back to shareholders?
| Item | Value | As of |
|---|---|---|
| Cash and equivalents | $20.3B | September 30, 2026 |
| Short-term investments | $44.2B | September 30, 2026 |
| Cash and short-term investments | $64.5B | September 30, 2026 |
| Total debt | $35.5B | September 30, 2026 |
| Net cash, excluding leases | About $29B | September 30, 2026 |
| Property and equipment, net | $346.8B | September 30, 2026 |
| Total equity | $470.5B | September 30, 2026 |
| Leases signed but not yet commenced | $364.6B | September 30, 2026 |
- On October 29, 2026, Microsoft priced $25B of bonds across ten series, with coupons from 4.850% to 6.350%, its first US bond sale since 2017.
- Pro forma for that sale, gross debt stands near $60.5B against about $89.5B of cash and investments. The company remains in a net cash position excluding leases.
- The honest deduction is the lease pipeline. Leases of $364.6B, primarily for data centers, had been signed but had not yet commenced at September 30, 2026, commencing between fiscal 2027 and fiscal 2034.
- At June 30, 2026 the company also carried $194.1B of purchase commitments, mainly for data centers, and $34.6B of construction commitments.
- These commitments are the build expressed as obligations. They are matched against a $677B customer backlog, but they do not shrink if AI demand growth slows.
- Shareholder returns continue through the build. Fiscal 2026 repurchases were $22.3B in cash and dividends paid were $26.4B, with $27.0B of dividends declared.
- About $37.7B remained under the $60B repurchase program at September 30, 2026.
- Q1 fiscal 2027 returns were $10.2B, even as quarterly capex reached $45.2B including finance leases.
- The dividend runs at about $3.64 per share annually on the declared total, a yield near 0.7% at the reference price. This is a compounding vehicle, not an income vehicle.
What is Microsoft worth by fiscal 2029?
The reference price of $521.91 pays 29 times trailing GAAP earnings of $17.95 and 30 times non-GAAP earnings of $17.28, with the GAAP line flattered by OpenAI investment gains. On the consensus snapshot used in the DalalBytes Compute Price Reset article, the price pays 25.1 times forward earnings growing at about 20%. That is not a distressed multiple and not a bubble multiple. It is the price of a fortress whose free cash flow is temporarily spoken for. The scenarios below are built on the new two-segment basis from the recast fiscal 2026 base of $277.8B of Agents and Infra and $54.1B of Devices and Consumer.
| Fiscal 2029 | Bear | Base | Bull |
|---|---|---|---|
| Agents and Infra revenue ($B) | 386 | 460 | 521 |
| Devices and Consumer revenue ($B) | 48 | 52 | 57 |
| Total revenue ($B) | 434 | 512 | 578 |
| Operating margin | 40% | 45% | 47% |
| Net income ($B) | 150 | 194 | 226 |
| Diluted shares (M) | 7,410 | 7,270 | 7,135 |
| EPS | $20.25 | $26.70 | $31.67 |
| Exit multiple | 21x | 27x | 30x |
| Scenario value | $425 | $720 | $950 |
The bear case, $425
- Azure growth halves as the capacity wave meets a digestion year, and Agents and Infra compounds at 16%, then 11%, then 8%.
- Devices and Consumer shrinks every year as Windows OEM declines compound the Xbox slide.
- Microsoft Cloud gross margin slips below 65% as depreciation on the build lands faster than pricing.
- Free cash flow stays near fiscal 2026 levels through fiscal 2029, and the exit multiple compresses to 21 times.
- The bear case is a return-on-build disappointment. It values the stock about 19% below the reference price.
The base case, $720
- Azure decelerates in an orderly path and Agents and Infra compounds at 22%, then 18%, then 15%.
- Devices and Consumer stabilizes as search advertising offsets Windows and Xbox declines.
- Operating margin settles near 45% as opex leverage offsets Azure gross margin compression.
- Capex intensity peaks in calendar 2026 and free cash flow returns to growth in fiscal 2028.
- The skeptic case stands beside this base. It says a $677B backlog signed at the peak of a capacity shortage is partly customers insuring against scarcity rather than final demand, that bookings already fell 12% in Q1, and that when capacity normalizes, some of that backlog renegotiates.
- Our answer is the duration. A 2.3-year weighted average backlog with about 30% recognized in the next year is short enough to audit quickly. If the base case is wrong, the bookings line shows it within two quarters, not two years.
The bull case, $950
- Azure holds growth near 40% into fiscal 2028 on agent workloads, and Agents and Infra compounds at 26%, then 24%, then 20%.
- Copilot and E7 attach rates convert the seat base into a second productivity growth engine.
- Maia 300 reaches production in 2027 and bends the cost curve on Microsoft's own inference, lifting cloud gross margin back toward the high 60s.
- Operating margin reaches 47% and the market keeps a 30 times multiple on $31.67 of EPS.
What could break the story?
The central risk is arithmetic wearing a hard hat. Microsoft has committed to roughly $170B of calendar 2026 capex, $364.6B of leases that commence through fiscal 2034, and $194B of purchase commitments, against demand that is real today and contracted for an average of 2.3 years. If AI workload growth decelerates the way every infrastructure cycle eventually does, the depreciation arrives on schedule and the revenue does not. Free cash flow has already fallen three years in a row in the good scenario. The bad scenario is the same build meeting a digestion year, with the lease obligations indifferent to the outcome.
The second risk is dependence dressed as partnership. Microsoft's frontier model position runs through a 27% stake in a company that now serves its products on AWS, licenses its intellectual property non-exclusively, and answers to its own board. The equity stake has also become an earnings volatility line, swinging from a $3.1B loss in one quarter to a $5.0B gain across a year. Microsoft is building its own MAI models and its Agent 365 layer to reduce that dependence, but at November 2026 the dependence is the fact and the reduction is the plan.
The third risk is the boundary the moat does not cover. Microsoft buys roughly three quarters of its compute hardware content from NVIDIA and AMD at prices those suppliers set, while its two largest cloud rivals increasingly run on silicon they designed. The DalalBytes Compute Price Reset article lays out the order in which a compute cycle turns. Spot prices crack first, contract prices second, backlogs third, reported margins last. Microsoft sits at the contract and backlog end of that chain as a buyer, which protects it early and exposes it late, because its capacity commitments are the longest on the field.
- The consumer segment is in managed decline. Windows OEM and devices revenue fell 22% in Q1 fiscal 2027 and is guided down in the mid-30s percent for Q2.
- Xbox revenue fell 7% in fiscal 2026 and 2% in Q1 fiscal 2027, with content and services also declining.
- Bookings fell 12% in Q1 fiscal 2027. One quarter is not a trend, and it is the first line to watch if the backlog story weakens.
- Regulatory exposure persists, including the Irish Data Protection Commission matter concerning LinkedIn disclosed in the Q1 fiscal 2027 Form 10-Q contingencies.
- GAAP EPS carries OpenAI mark-to-model swings in both directions, which will keep producing headline quarters that misstate the operating trend in both directions.
- The voluntary exit offer announced October 26, 2026 lands in Q2 operating expenses, a reminder that the legacy cost base is being managed against the build.
Where does the stock sit today?
- Reference price is the Friday October 30, 2026 close of $521.91.
- Shares outstanding were 7,427M at September 30, 2026, giving a market value of about $3.88T at the reference price.
- The price pays 29.1 times fiscal 2026 GAAP EPS of $17.95 and 30.2 times non-GAAP EPS of $17.28.
- The forward snapshot in the DalalBytes Compute Price Reset valuation table lists 25.1 times forward earnings with expected growth of about 20% and a latest gross margin of 67.8%.
- The stock was repriced with the other hyperscalers in October 2026 as the market marked capex against free cash flow, which is the debate this report prices.
- Fiscal Q2 2027 results are the next hard checkpoint. The date has not been company-announced as of November 2, 2026.
Frequently asked questions
How big is Azure now that Microsoft reports it in dollars?
Azure revenue was $33.2B in Q1 fiscal 2027, up 48% year over year in the first quarter of dollar disclosure. Azure crossed $100B in fiscal 2026, and Microsoft Cloud revenue, which adds Microsoft 365 commercial cloud and industry cloud, was $63.9B in the quarter, up 30%.
Why does free cash flow grade only partial when Microsoft is this profitable?
Free cash flow fell from $74.1B in fiscal 2024 to $67.0B in fiscal 2026 and fell 27% again in Q1 fiscal 2027, because cash capex rose from $44.5B to $115.9B across the same two years. Operating cash flow grew 34% in fiscal 2026. The engine is strong and the build is eating its growth.
What did Microsoft keep and give up in the OpenAI restructuring?
Microsoft kept a stake of about 27% valued near $135B, a $250B Azure purchase commitment, intellectual property rights through 2032 and a one-way revenue share through 2030. It gave up exclusivity in two steps, the compute right of first refusal in October 2025 and license exclusivity in April 2026, and OpenAI models now run on AWS as well as Azure.
Sources and disclosures
- Microsoft Form 10-K for fiscal 2026, filed July 29, 2026, for the three-year segment history, product lines, consolidated statements and commitments.
- Microsoft Form 10-Q for Q1 fiscal 2027, accession 0001193125-26-436133, for the new segment detail, product revenue in dollars, the balance sheet and the lease commitments.
- Microsoft investor presentation on Form 8-K, September 2, 2026, accession 0001193125-26-380280, and the recast exhibit filed October 28, 2026, for the segment change and the Azure redefinition.
- Microsoft Q1 fiscal 2027 earnings release and earnings call reporting of October 28, 2026, for guidance, Copilot and platform metrics, the RPO duration and the capex outlook.
- Microsoft Azure blog of October 12, 2026, for the Maia 200 production confirmation and the Maia 300 unveiling.
- Microsoft bond offering prospectus supplement of October 29, 2026, for the $25B ten-series sale and the capitalization table.
- AWS and Google Cloud figures as reported in DalalBytes earnings coverage of Amazon and Alphabet Q3 2026 results, and the custom silicon curve from The Compute Price Reset, DalalBytes, November 2, 2026 at https://dalalbytes.com/blog/compute-price-reset.html.
- Disclosures. DalalBytes holds no position in Microsoft (MSFT) at publication. This report is research and opinion for educational purposes only and is not investment advice, a recommendation, or a solicitation. Prices and estimates are as of November 2, 2026, and will age. Verify figures against company filings before acting on them.