
Frequently asked questions
Is Kennametal India (KENNAMET) a buy at current prices?
DalalBytes rates Kennametal India Selective Positive at 63/100. FY26 revenue rose 29.1% to Rs 1,511 crore and PAT rose 90.5% to Rs 196 crore, the balance sheet is debt-free with Rs 854 crore of net worth and a Rs 40 a share dividend, and it is the only listed pure cutting-tool company in India. The deductions are that an estimated Rs 33 of the Rs 89.18 FY26 EPS is tungsten price-timing gain, free cash flow was negative Rs 35 crore in FY26, and at Rs 3,773 the stock trades at 42.3 times reported earnings and about 67 times estimated underlying earnings.
What are Kennametal India's FY2029 price targets?
DalalBytes' FY2029 targets (fiscal year ending June 2029) are bear Rs 2,050, base Rs 3,700 and bull Rs 6,100, from a Rs 3,773 reference price (NSE close, October 28, 2026). Bear: 4% revenue CAGR, 9.0% PAT margin, EPS Rs 70 at 29 times. Base: 11% CAGR, 11.6% margin, EPS Rs 109 at 34 times. Bull: 17% CAGR, 14.5% margin, EPS Rs 160 at 38 times. Every case assumes the FY26 tungsten timing gain does not repeat.
What is the verdict on Kennametal India?
Kennametal India just printed the best year in its history, and the honest first question is how much of it is the business and how much is a metal. FY26 revenue rose 29.1% to Rs 1,511 crore and PAT rose 90.5% to Rs 196 crore, as tungsten went up roughly tenfold and the company repriced faster than its old inventory cost it money. Strip out the price-timing gain and underlying EPS is nearer Rs 56 than Rs 89.18.
The business underneath is genuinely good: the Indian arm of a global top-three cutting-tool group, debt-free with Rs 854 crore of net worth, a 33% ROCE in FY26, a Rs 40 a share dividend paid even in a cash-tight year, and a 62-year Bengaluru manufacturing base. The selective part is the cash and the price: FY26 operating cash flow collapsed to Rs 18 crore, free cash flow turned negative Rs 35 crore, inventory days blew out from 172 to 280, and the base case to FY2029 is roughly flat at Rs 3,773.
How did Kennametal India start?
The parent began in 1938 in Latrobe, Pennsylvania, when metallurgist Philip McKenna created a tungsten-titanium carbide alloy that transformed steel machining. The Indian business began in 1964, when Widia India Private Limited was incorporated in Bengaluru with about 30 employees and one shaping plant, promoted by Meturit AG of Switzerland (an associate of the Fried. Krupp WIDIA-Fabrik unit) and Sak Industries. WIDIA itself dates to 1926 in Germany and turns 100 in 2026.
Kennametal Inc. acquired WIDIA globally in 2002 and the Indian listed company took the Kennametal India name. The Bengaluru campus on Tumkur Road grew to about 29 acres with a team of 750 plus and a pan-India distributor network. In December 2020 the board approved merging WIDIA India Tooling into the listed company. Three owners and six decades, one asset persisted: a Bengaluru plant that makes the full carbide chain locally, from powder to finished insert.
What does Kennametal India sell, technically?
Cemented carbide is tungsten carbide grains bonded in a cobalt matrix and sintered at high temperature: a tool that cuts steel must be harder than steel, hold an edge at red heat (tungsten melts at about 3,422 degrees C, the highest of any metal), and survive abrasive wear. Grade design is the science: grain size, cobalt content and added carbides trade hardness against toughness for each job. Modern inserts are then coated, by chemical or physical vapour deposition, with layers such as titanium nitride, titanium carbonitride and alumina, and pressed with chip-breaker geometries. Coating recipes and geometries are where the global parents compete, and where this company draws on group research it could never fund alone.
The catalogue runs turning, milling, hole-making, threading and tooling systems under two brands, Kennametal at the premium engineered end and WIDIA as the broad value line, plus solid carbide round tools, PCD tooling, holders, rods and preforms. The same carbide science sells into infrastructure: road rehabilitation picks, foundation drilling and trenching tools, mining tools, and carbide wear parts for fluid handling, pelletising dies and defence. Machining Solutions Group (MSG), under the WIDMA name, builds special purpose machines to order: tool and cutter grinders, deep hole drilling machines, vertical turning lathes, and one-off builds such as the large horizontal boring machine built for a construction equipment maker in 2025.
How do the segments split?
| Segment | FY25 revenue (Rs cr) | FY26 revenue (Rs cr) | FY26 share | Result signal |
|---|---|---|---|---|
| Hard Metal and Hard Metal Products | 1,017 | 1,364 | 90.3% | Segment profit about Rs 316 cr |
| Machining Solutions Group | 153 | 147 | 9.7% | Loss of Rs 3.1 cr in the nine months to March 2026 |
| Total | 1,170 | 1,511 | 100% | PBT Rs 266 cr |
Hard Metal is the company: nine rupees in ten come from carbide products, and its FY26 segment margin of about 23% against 16.1% in FY25 is the tungsten story in one line. MSG is shrinking and loss-making: revenue fell from Rs 153 crore to Rs 147 crore while the core grew 34%, including a Rs 4.4 crore loss in the March 2026 quarter alone. Its defence is strategic (machine placements pull tool sales), but on the printed numbers it is a subsidy, not a second engine. No customer concentration is disclosed in the sources reviewed.
How did tungsten make the FY26 profit?
China, which produces about 79% of the world's mined tungsten, added tungsten products to its export control list in February 2025, with a licence per shipment and only 15 firms permitted to export in 2026. Fastmarkets' ammonium paratungstate (APT) assessment climbed from $342.50 per mtu in January 2025 to a $2,500 to $2,900 range by October 2026. Result coverage of the June 2026 quarter carried management's framing that a common form of tungsten had risen from about $30 to about $330 a kilogram.
| Period | Benchmark | What happened |
|---|---|---|
| Mid 2024 | APT about $300 per mtu, Rotterdam | Pre-shock baseline after decades of Chinese oversupply |
| Feb 2025 | n.v. | China export controls begin; per-shipment licensing |
| Jan 2025 to Oct 2026 | $342.50 to $2,500-2,900 per mtu (Fastmarkets) | Roughly an eight to tenfold rise |
| Mar 2026 | Peak | Chinese domestic APT at its high; corrected about 48% by October 2026 |
| Sep to Oct 2026 | $2,900-3,100 per mtu, Rotterdam | Western prices plateau at highs; the East-West spread persists |
A toolmaker holding months of inventory bought at old prices, while raising selling prices to replacement cost, books a timing gain. The parent quantified exactly this at group level in FY26: about $316 million of favourable raw material pricing timing. India's June 2026 quarter shows the same signature, with Hard Metal segment profit of Rs 139 crore on Rs 447 crore of revenue, a 31% segment margin, against a 16.1% full-year margin in FY25.
A normalisation estimate (DalalBytes, labelled as such). Had Hard Metal earned its FY25 margin of 16.1% on FY26 revenue, segment profit would have been about Rs 219 crore instead of about Rs 316 crore. The gap, about Rs 97 crore pre-tax or about Rs 73 crore after tax, is about Rs 33 of the reported Rs 89.18 EPS. On that estimate, underlying EPS is about Rs 56 and the reference price is about 67 times underlying earnings. If tungsten stays high, replacement cost catches up and the gain ends while working capital stays trapped; if it falls hard, the company holds peak-cost inventory into falling prices. Either path normalises the margin.
What do the financials show?
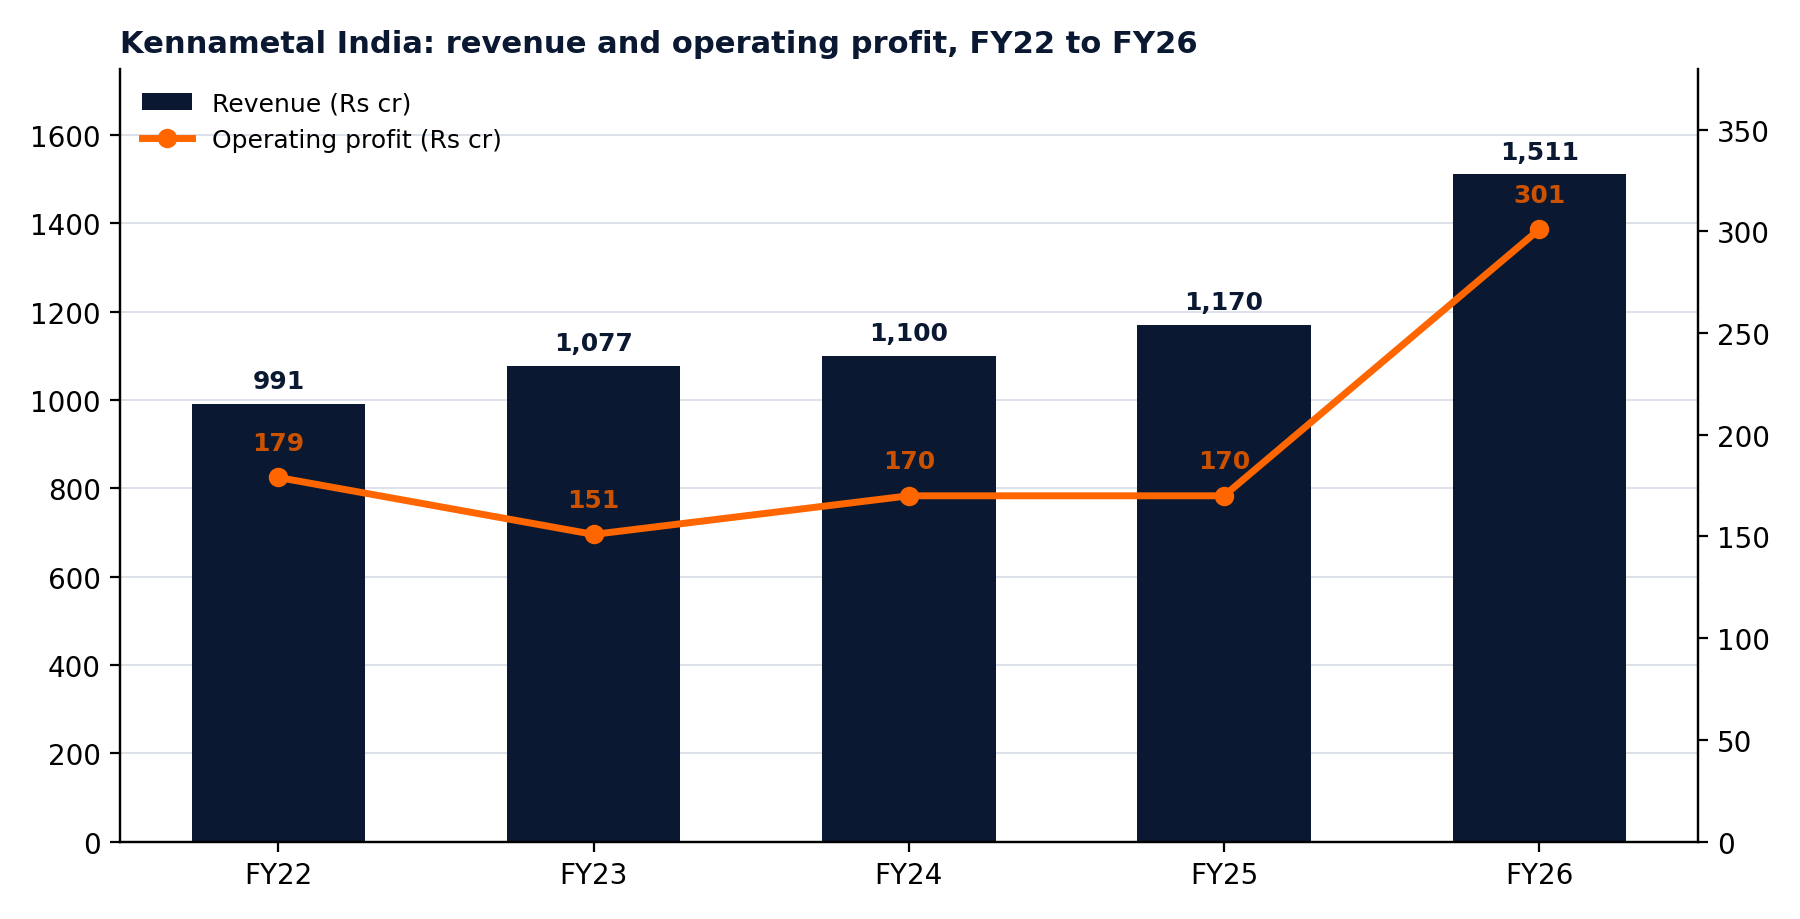
| Fiscal year (ends June) | Revenue (Rs cr) | YoY | Operating profit (Rs cr) | Operating margin | PAT (Rs cr) | EPS (Rs) | Operating cash flow (Rs cr) | Free cash flow (Rs cr) |
|---|---|---|---|---|---|---|---|---|
| FY22 | 991 | n.v. | 179 | 18.1% | 114 | 51.86 | 50 | -16 |
| FY23 | 1,077 | 8.7% | 151 | 14.0% | 88 | 39.86 | 116 | 69 |
| FY24 | 1,100 | 2.1% | 170 | 15.5% | 111 | 50.23 | 114 | 86 |
| FY25 | 1,170 | 6.4% | 170 | 14.5% | 103 | 46.77 | 145 | 116 |
| FY26 | 1,511 | 29.1% | 301 | 19.9% | 196 | 89.18 | 18 | -35 |
Standalone figures, Screener.in and filing-based vendor tables, October 2026. The company's financial year runs July to June. Revenue compounded at only about 6% a year from FY22 to FY25, with EPS below its FY22 level for three straight years; FY26 then added more revenue in one year (Rs 341 crore) than the previous three combined (Rs 179 crore). The June 2026 quarter alone (revenue Rs 478 crore, PAT Rs 88.8 crore, up 183.7% year on year) contributed 45% of the year's PAT. Q1 FY27, the quarter ended September 30, 2026, is due at the board meeting on November 12, 2026, with the 61st AGM on November 13, 2026.
How strong are the balance sheet and cash flow?
| Metric | FY22 | FY23 | FY24 | FY25 | FY26 |
|---|---|---|---|---|---|
| Inventory days | 195 | 149 | 168 | 172 | 280 |
| Debtor days | 50 | 48 | 59 | 59 | 65 |
| Days payable | 75 | 46 | 68 | 65 | 127 |
| Cash conversion cycle (days) | 170 | 151 | 160 | 166 | 219 |
| Cash conversion (Screener CFO to EBITDA) | 49% | 97% | 84% | 93% | 24% |
Borrowings are effectively zero (interest cost of Rs 0.03 crore in FY26), net worth rose to Rs 854 crore (book value Rs 388 a share), India Ratings affirmed IND AA- / Stable in December 2025, and the share count has been 2.2 crore shares throughout. Nothing about this balance sheet can be forced. The cash half is weaker: FY26 operating cash flow was Rs 18 crore against PAT of Rs 196 crore and free cash flow was negative Rs 35 crore, a swing of Rs 151 crore from FY25, as inventory days jumped 108 days to 280, partly funded by stretching payables to 127 days. The parent reported the same pattern in dollars (group operating cash flow of negative $4 million in FY26), which confirms the mechanism is supply security, not Indian mismanagement. Over FY22 to FY26 the company generated cumulative free cash flow of about Rs 220 crore on cumulative PAT of about Rs 612 crore, a 36% conversion, and paid a Rs 40 a share dividend (Rs 88 crore in FY26) even in the negative year.
Has management delivered on its roadmap?
| Commitment | Stated | Delivered | Grade |
|---|---|---|---|
| MSG greenfield plant | Board approved about Rs 68 cr of pre-project spend (studies, land identification, feasibility) | No capacity, timeline or cost disclosed since; MSG revenue fell 4% in FY26 and the segment lost money | Pending, and the base business is shrinking |
| Dividend | Interim dividend of Rs 40 a share declared in May 2025 and again in May 2026 | Paid both years; Rs 88 cr in FY26 despite negative free cash flow | Delivered |
| Tungsten supply and pricing | MD statements each quarter of FY26: actively managing the tungsten supply chain, strategic pricing actions | Record June quarter profit and no reported stock-outs; inventory days still rose to 280 | Delivered on price, open on stock |
| Numeric guidance | None given | No guidance and no order book published in any period reviewed | Visibility gap |
What this management promises in writing, it pays (the dividend, twice, to the rupee). What it discusses, it executes operationally (pricing, supply). What it will not do is publish a forward number. The MSG greenfield is therefore the decision to watch: Rs 68 crore of pre-project money on a segment doing Rs 147 crore of loss-making revenue is either the start of a serious machines business or capital following a strategic story past its evidence. On governance: Vijaykrishnan Venkatesan is Managing Director; promoters hold exactly 75.00% (Meturit AG 51%, Kennametal Inc 24%), unchanged from December 2023 to September 2026, with no pledging disclosed; statutory auditors are Price Waterhouse Chartered Accountants LLP with no qualifications in the reviews seen; CRISIL assigned an ESG rating of 55 (Adequate) in October 2026.
Who competes with Kennametal India?
| Player (global metal cutting) | Estimated global revenue share | Position |
|---|---|---|
| Sandvik Coromant (Sandvik AB) | About 11 to 14% | Technology leader; widest catalogue, digital tool management |
| IMC Group (Iscar, Tungaloy, Ingersoll) | About 9 to 12% | Berkshire Hathaway owned; multi-brand across price tiers |
| Kennametal | About 6 to 8% | Aerospace, energy and general engineering depth; WIDIA value brand |
| Mitsubishi Materials | About 5 to 7% | Integrated powder-to-tool chain |
| Kyocera | About 4 to 6% | Ceramic and cermet materials edge |
| Sumitomo Electric Hardmetal | About 4 to 6% | PCD and CBN superhard specialist |
| CERATIZIT Group | About 3 to 5% | Carbide and recycling depth |
IMARC sizes India's cutting tools market at $3.1 billion in 2025, growing to $5.3 billion by 2034, a 5.8% dollar CAGR, and Indian machine tool consumption rose about 17% in the last reported year to about $3.7 billion against production of about $1.7 billion. Sandvik Coromant, Iscar, Mitsubishi, Seco, Walter, Ceratizit and YG-1 all sell into India, mostly through unlisted subsidiaries and import channels, which is why no clean listed comparison exists. Tools are specified job by job and trialled on the customer's machine; a rival wins by cutting cycle time or cost per component in a live trial. Kennametal India's defences are its local plant, its two-brand price ladder and its application engineers. Winning: availability and pricing through the tungsten crisis, wear tools, premium engineered work. Losing: MSG machines, and the FY23 to FY25 stretch when revenue compounded at about 4% while Indian manufacturing capex boomed.
What is Kennametal India worth against peers?
At Rs 3,773 (October 28, 2026): P/E 42.3 times FY26 reported EPS of Rs 89.18, about 67 times estimated underlying EPS of about Rs 56, P/B 9.7 times, P/S 5.5 times, EV/EBITDA about 27 times, dividend yield 1.06%. The comparators below are quality capital-goods names, not tooling peers, because India lists no other tooling company.
| Company | Approx. P/E (Oct 2026) | ROCE | ROE | Note |
|---|---|---|---|---|
| Kennametal India | 42.3x reported, about 67x underlying | 33.3% (FY26) | 24.5% (FY26) | Pure carbide tooling; FY26 returns flattered by tungsten timing |
| Jyoti CNC Automation | About 62.7x | 21.3% | 18.2% | CNC machine builder; the growth-priced machine comp |
| Triveni Turbine | About 41.1x | 35.9% | 26.3% | Steam turbines; closest returns profile |
| Thermax | About 52.2x | 15.9% | 13.8% | Energy and environment capital goods |
| Honeywell Automation India | About 53.1x | 17.0% | 12.4% | The other 75% parent-owned quality compounder |
| Cummins India | About 51.4x | n.v. | n.v. | Engines and power generation |
Against this set Kennametal India is not the most expensive stock on reported numbers, and its FY26 ROCE is near the top. The catch sits in the first row: its earnings base is the one most likely to fall, and on underlying earnings it is the most expensive name in the set. The shares rose about 86% in the year to October 2026, peaked at Rs 5,136, and have since fallen about 26%. FY2029 scenarios: bear Rs 2,050 (4% CAGR, 9.0% margin, EPS Rs 70 at 29x), base Rs 3,700 (11% CAGR, 11.6% margin, EPS Rs 109 at 34x), bull Rs 6,100 (17% CAGR, 14.5% margin, EPS Rs 160 at 38x). The base case is roughly the reference price, which is the definition of a selective rating.
What are the key risks?
Peak earnings first: about Rs 33 of FY26 EPS of Rs 89.18 is estimated price-timing gain, and tungsten normalisation in either direction takes reported profit down before volume can answer. Cash conversion second: five-year free cash flow conversion of about 36% of PAT, inventory days between 149 and 280 every year, and a 219-day cash cycle in FY26. Single-input dependence third: tungsten supply is concentrated in China (about 79% of mine output), export-licensed and now a geopolitical instrument. Then cyclicality (FY23 and FY24 printed revenue growth of 8.7% and 2.1% with falling EPS), the MSG drag, and parent control: promoters at exactly 75.00%, brands and technology as group property, a 25% free float, foreign institutions at just 0.23% in September 2026, and thin liquidity (average daily traded value of about Rs 1.5 crore). Q1 FY27 results on November 12, 2026 are the next checkpoint.
Sources: company result filings and BSE disclosures (quarters ended December 2025, March 2026 and June 2026; interim dividend May 7, 2026; Q1 FY27 board meeting November 12, 2026); Screener.in standalone and consolidated pages, crawled October 28, 2026; vendor financial tables (Value Research, Smart Investing, Sharekhan, ICICI Direct); Kennametal Inc. FY26 reporting; Fastmarkets APT assessments via CME and Reuters reporting; IIFL, Dhan and Finnhub market prints; IMARC and Market Research Future market sizing; India Ratings and CRISIL ESG via exchange filings. The normalisation estimate in this report is a DalalBytes estimate, labelled as such, not a company figure.
© 2026 DalalBytes Research · For educational purposes only. Not investment advice.