Frequently asked questions
Is Jenburkt Pharmaceuticals a buy at current prices?
DalalBytes rates Jenburkt Selective Positive at 65/100. At Rs 853.60 the stock trades at 11.5x trailing earnings, 1.91x book value and a 2.43% dividend yield. The company is debt free, earned PAT of Rs 34.74 cr in FY26 at an ROE of 18.84%, and has raised its dividend five straight years. The caution is Q1 FY27, when operating margin fell to 17.0%.
What are Jenburkt Pharmaceuticals FY2029 price targets?
DalalBytes FY2029 targets for Jenburkt are bear Rs 710, base Rs 1,320 and bull Rs 1,820, from a Rs 853.60 reference price. Bear: 3% sales CAGR to Rs 184 cr, PAT of Rs 31 cr, EPS of Rs 71 at 10x. Base: 9% CAGR to Rs 219 cr, PAT of Rs 45 cr, EPS of Rs 102 at 13x. Bull: 13% CAGR to Rs 244 cr, PAT of Rs 54 cr, EPS of Rs 121 at 15x.
Why did Jenburkt profit fall in the June 2026 quarter?
Q1 FY27 sales were flat at Rs 35.51 cr against Rs 35.53 cr a year earlier, while operating profit fell to Rs 6.03 cr from Rs 8.96 cr, a margin of 17.0% against 25.2%. PAT fell 24.4% to Rs 5.89 cr despite a low 13% tax rate. Jenburkt holds no earnings calls and publishes no presentations, so no management explanation is on record. Q2 FY27 results are due on November 3, 2026.
What is the verdict on Jenburkt Pharmaceuticals?
Jenburkt is a small, old, unusually profitable branded formulations business. It has lifted PAT from Rs 22.30 cr in FY22 to Rs 34.74 cr in FY26, holds borrowings of just Rs 2.49 cr against net worth of Rs 197.04 cr, and has raised the dividend every year from Rs 12.00 to Rs 20.70. The catches are pace (sales compounding at about 8%), a promoter holding of 46.62% that creeps down, and Q1 FY27, when sales were flat and operating margin compressed to 17.0% from 25.2%, with no management explanation on record. At 11.5x trailing earnings at a fresh 52 week low, the price already assumes very little. Selective Positive.
How did Jenburkt start, and who owns it now?
Jenburkt was incorporated on June 10, 1985 by the Bhuta family, whose interests ran to chemicals and textiles trading, as a diversification into pharmaceutical formulations. The model never changed: branded formulations, an own field force, one plant at Sihor in Gujarat, and a small export sideline. Ashish U Bhuta is Chairman and Managing Director and holds 18.07%; Bhuta Holdings Private Limited holds 13.96% and Kalindi Hemendra Bhuta 9.06%, within total promoter holding of 46.62% (September 2026), down from 47.56% in March 2023, with pledging at zero since March 2024.
What does the business actually do?
Jenburkt formulates bought in active ingredients into tablets, capsules and other dosage forms at Sihor, a WHO-GMP certified plant, and sells them under its own brands through about 700 medical representatives (CRISIL, FY24). The catalogue leans chronic: pain, neuropathic pain, anti-diabetic, cardiovascular and other brands such as Nervijen, Powergesic and Cartisafe Forte, alongside gastrointestinal, anti-infective, gynaecological, respiratory and dermatological lines. Exports rose from 5 to 6% of operating income in FY24 on CRISIL estimates to 15.5% of sales in FY26, FOB Rs 26.1 cr on Equitymaster data, across 13 countries in Asia and Africa.
Where does the revenue come from?
Domestic formulations are about 84.5% of FY26 sales, implied by the export share; the company reports no segments and has no subsidiaries. The second line that matters is treasury: other income of Rs 10.31 cr in FY26 was about a fifth of profit before tax, earned on cash of Rs 53.11 cr and a large investment book. Q4 FY26 carried a Rs 3.95 cr exceptional item, which is why reported PBT of Rs 46.52 cr sits below the Rs 50.47 cr pre-exceptional audited figure.
What do the financials show?
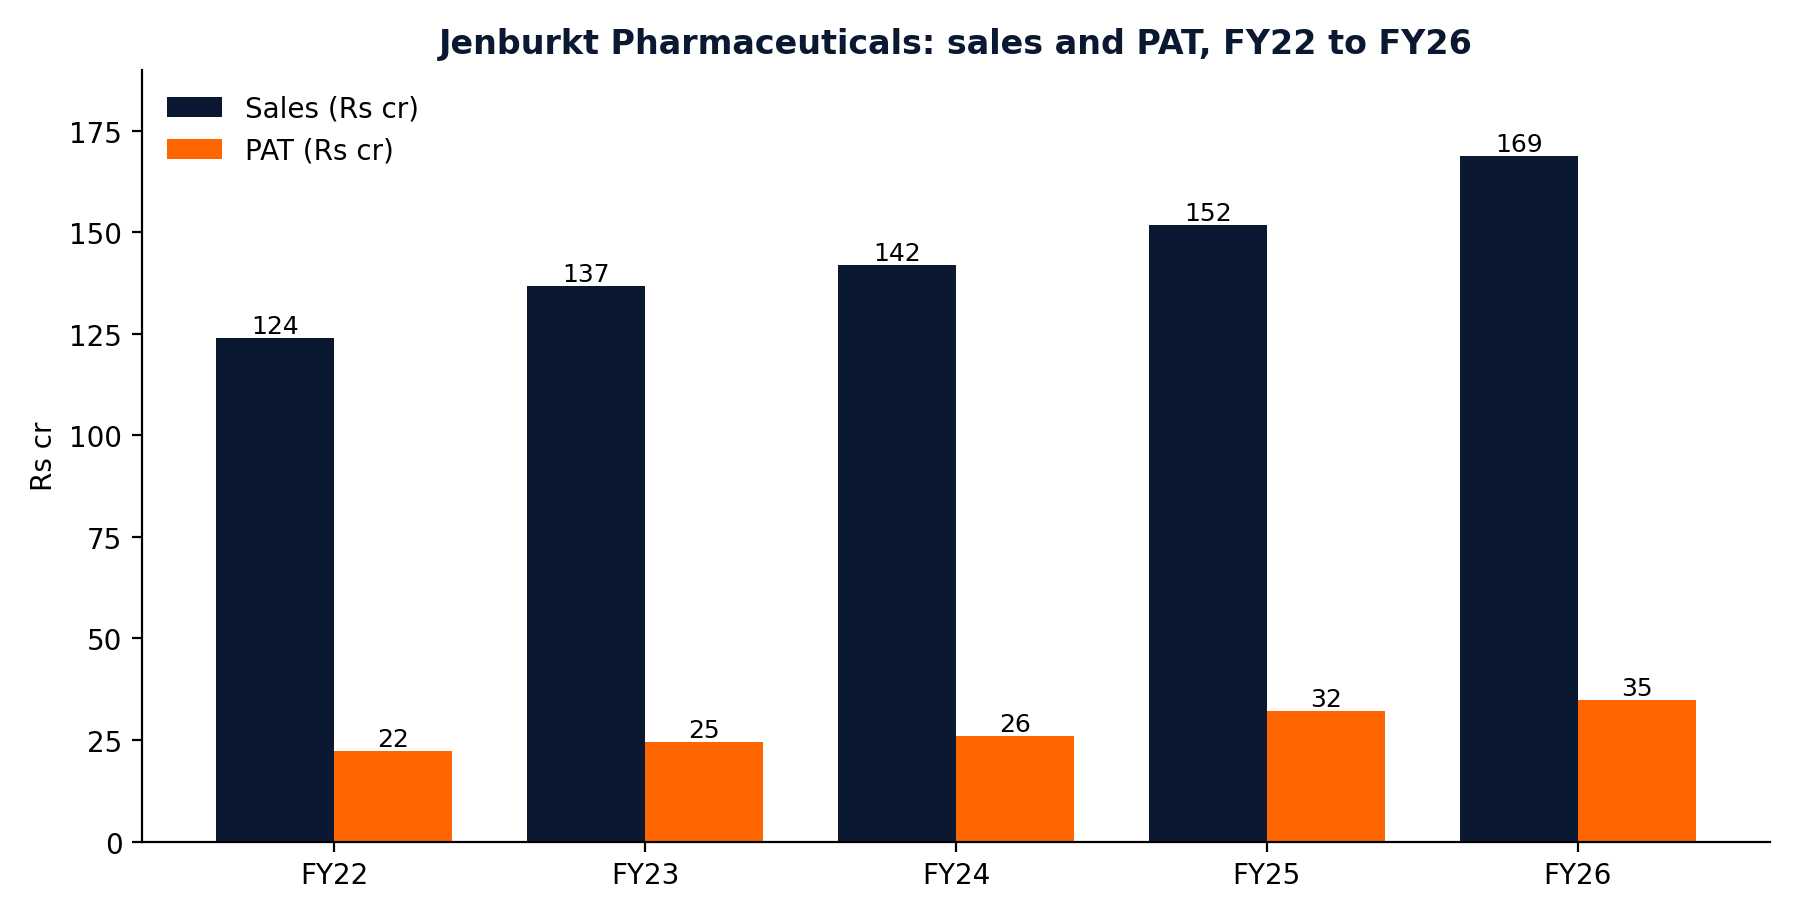
Sales went Rs 124 cr, Rs 137 cr, Rs 142 cr, Rs 152 cr, Rs 169 cr across FY22 to FY26, with operating margin of 22%, 22%, 23%, 27% and 26%, and PAT of Rs 22.30 cr, Rs 24.61 cr, Rs 25.98 cr, Rs 32.06 cr and Rs 34.74 cr. PAT margin held near 20% and ROE was 18.84% in FY26. Q1 FY27, reported August 6, 2026, broke the pattern: sales flat at Rs 35.51 cr, operating profit of Rs 6.03 cr at a 17.0% margin, and PAT down 24.4% to Rs 5.89 cr. Q2 FY27 results are scheduled for November 3, 2026.
How strong is the balance sheet and cash flow?
Net worth is Rs 197.04 cr at March 2026, borrowings Rs 2.49 cr, cash Rs 53.11 cr, and the current ratio is about 4.1. CRISIL rates the facilities BBB+ Stable and A2. Operating cash flow was Rs 27.91 cr in FY25 and Rs 26.52 cr in FY26, against a five year total of Rs 88.87 cr. The live item is expansion: capital work in progress jumped from Rs 1.24 cr at March 2024 to Rs 46.12 cr at March 2026, internally funded, with little disclosed on scope or commissioning. Free cash flow after that capex runs at roughly Rs 8 to 13 cr a year, covering the Rs 9.13 cr dividend, but not by a wide margin.
What is Jenburkt worth versus peers?
At Rs 853.60: P/E 11.5x TTM on EPS of Rs 74.39, 10.8x on FY26 EPS of Rs 78.71, P/B 1.91x on book value of Rs 446.47, yield 2.43%. The closest peer, Lincoln Pharmaceuticals, trades at Rs 499.30 and about 10.4x with a market cap of about Rs 1,000 cr, TTM sales of about Rs 694 cr and ROE of 12.30%: a similar multiple for lower returns and four times the sales. FDC trades at about 18.9x TTM and Caplin Point at about 26.9x, against Sun Pharma at 37.2x. FY2029 scenarios: bear Rs 710, base Rs 1,320, bull Rs 1,820.
What are the key risks?
First, the unexplained quarter: Q1 FY27 margin fell eight points with no concall or presentation to explain it, and a repeat in Q2 would reset the valuation base. Second, pace at home and fragility abroad: 8% domestic compounding, and exports at 15.5% of sales running into small Asian and African markets with currency and distributor credit risk. Third, concentration: one plant at Sihor, a family that supplies the chairman and the CFO, and treasury income at about a fifth of PBT. Fourth, the register and the tape: institutions hold almost nothing, NSE traded value was about Rs 0.13 cr on October 30, 2026, and the stock made a fresh 52 week low that day in its fifth straight falling session.
© 2026 DalalBytes Research · For educational purposes only. Not investment advice.