
Frequently asked questions
Is IndiaMART InterMESH (INDIAMART) a buy at current prices?
DalalBytes rates IndiaMART Selective Positive at 71/100. FY26 revenue rose 13% to Rs 1,569 crore, free cash flow was Rs 687 crore, and cash and investments stood at Rs 3,234 crore against borrowings of Rs 20 crore at September 2026. The deductions are a paying supplier base down 2% year on year to 217,000, unique business enquiries down 14% to 27 million in Q2 FY27, and growth carried entirely by a 10% rise in revenue per paying supplier to about Rs 72,000. At Rs 1,487 the stock trades at 17.8 times earnings with a 7.7% free cash flow yield.
What are IndiaMART's FY2029 price targets?
DalalBytes' FY2029 targets (year ending March 2029) are bear Rs 1,350, base Rs 2,350 and bull Rs 3,400, from a Rs 1,487 reference price (NSE close, October 30, 2026). Bear: 7% revenue CAGR, 26.0% PAT margin, EPS Rs 84 at 16 times. Base: 12% CAGR, 32.0% margin, EPS Rs 117 at 20 times. Bull: 16% CAGR, 35.0% margin, EPS Rs 143 at 24 times.
What is the verdict on IndiaMART?
IndiaMART is the toll booth of Indian B2B trade, and the market has spent a year pricing it like a road being bypassed. The stock closed at Rs 1,487 on October 30, 2026, down 40% in a year and at 17.8 times earnings, for a business with Rs 3,234 crore of cash and investments, almost no debt, free cash flow of Rs 687 crore in FY26, and roughly 60% of India's online B2B classified market on widely cited estimates. FY26 consolidated revenue rose 13% to Rs 1,569 crore, H1 FY27 revenue rose 10.5% to Rs 843 crore, and Q2 FY27 EBITDA margin printed at 37% consolidated and 40% standalone.
The selective part is the engine room. In Q2 FY27 the paying supplier base fell 2% year on year to 217,000, active buyers fell 7% to 40 million, and unique business enquiries fell 14% to 27 million. All of the revenue growth came from realisation: annualised revenue per paying supplier rose 10% to about Rs 72,000, carried by Gold and Platinum tiers, while Silver tier churn runs at about 40% a year on management disclosures. What the price now pays for is failure: at Rs 1,487 the free cash flow yield is 7.7%, cash and investments equal 36% of the market cap, and deferred revenue of Rs 2,029 crore is already collected from customers. What would change the score: two straight quarters of net paying supplier growth with enquiries stabilised would lift the score toward 80, and another year of supplier decline carried only by ARPU would cut it toward 60.
How did IndiaMART start?
Dinesh Agarwal came home from a systems job at HCL in the United States after India announced public internet access in August 1995. In April 1996, from Patparganj in Delhi, he and his cousin Brijesh Agrawal started IndiaMART with about Rs 40,000 of savings, when India had roughly 15,000 internet users. The first product was a directory and website building service for Indian exporters and small businesses. For a decade the company served foreign buyers, raised no venture money in its first ten years, and then pivoted in 2007 and 2008 to domestic B2B discovery as a strong rupee, Chinese export competition and a booming domestic economy made the Indian buyer the larger prize.
Intel Capital invested about Rs 50 crore in 2009, with Amadeus Capital and WestBridge in later rounds. The IPO in June and July 2019, priced at Rs 970 to 973 to raise about Rs 474 crore, was subscribed about 36 times and made IndiaMART the first online B2B marketplace to list in India. The founders still run it: Dinesh Agarwal is Managing Director and CEO, Brijesh Agrawal is a whole time director, and the promoter group holds 49.07% with no pledging disclosed in the sources reviewed.
What does IndiaMART sell, technically?
The product is a lead, not a transaction. A buyer searches or posts a requirement, the platform matches the enquiry to supplier storefronts and delivers it as a BuyLead, and a paying supplier consumes BuyLeads to see buyer contact details and pitch. IndiaMART does not take the order, hold inventory, move goods or settle the trade. Revenue is a subscription for visibility and lead flow, recognised over the subscription period, which is why collections and deferred revenue are the honest demand gauges. Free storefronts (8.9 million, with 135 million live listings) are the top of the funnel, and paid tiers add lead volume, priority placement, more categories and cities, and verification badges such as TrustSEAL.
The technical core is search and matchmaking over a huge, messy, multilingual SME catalogue: taxonomy, enquiry routing, supplier ranking, fraud filtering, and call and chat tooling. Management said on the Q2 FY27 call that AI is now central across discovery, matchmaking, content moderation, supplier ranking, buyer verification and conversational tools. The most important product decision of 2026 was defensive: part of the content has moved behind logins to stop unrestricted scraping by search engines and large language models, and management said it is okay to let go of 10 to 20% of current business enquiries to protect proprietary data, with Google AI Overviews the other half of the enquiry decline. The software layer is Busy Infotech (BUSY accounting software, 100% owned) and Livekeeping (live access over on premise accounting data such as Tally, 100% owned since May 2025).
How do the segments split?
| Segment (external revenue, Rs cr) | FY26 | Q1 FY27 | Q2 FY27 |
|---|---|---|---|
| Web and related services (marketplace) | 1,443 | 375.9 | 388.8 |
| Accounting software services (Busy, Livekeeping) | 126 | 38.5 | 39.8 |
| Total revenue from operations | 1,569 | 414 | 429 |
The marketplace is 92% of FY26 revenue, and every increment of standalone growth in the last two years has come from realisation per paying supplier, not supplier count. Accounting software grew 38.6% in H1 FY27 to Rs 78.3 crore, with Busy contributing Rs 36 crore of revenue and Rs 59 crore of collections in Q1 FY27. The associate portfolio (Vyapar at about 27 to 28.6%, RealBooks at 26.01%, EasyEcom at 26.01%, M1xchange, Fleetx, Zimyo, Bizom) is optionality, not earnings: the share of losses from associates widened to Rs 15.3 crore in Q2 FY27. Payments and finance are pilots by design: the company restated on the Q2 FY27 call that it does not aspire to complete the entire transaction, is running credit facilitation pilots with no direct lending from its own balance sheet, and has board approval from Q1 FY27 to incorporate a wholly owned finance subsidiary.
Why is the funnel shrinking?
| Metric | Q2 FY26 | Q1 FY27 | Q2 FY27 | Read |
|---|---|---|---|---|
| Paying suppliers (end of period) | About 221k (derived from -2%) | 218k | 217k | Falling since Q3 FY26 |
| Unique business enquiries | About 31m (derived from -14%) | 26m | 27m | AI Overviews plus login walls |
| Active buyers, LTM | About 43m (derived from -7%) | Not disclosed in Q1 release | 40m | First sustained decline |
| Annualised revenue per paying supplier | About Rs 65,500 (derived) | Not in release | About Rs 72,000 | +10% YoY, all of the growth |
| Collections (consol, Rs cr) | 406 (derived from +9%) | 463 | 443 | Still growing, slower |
| Deferred revenue (consol, Rs cr) | 1,749 (derived from +16%) | 2,014 | 2,029 | Forward cover intact |
The churn is in Silver. On management disclosures summarised in October 2026, Silver is about 50% of paying suppliers by volume and about 25% of revenue, with annual churn near 40% for annual plans, up from 20 to 24% before Q2 FY24, and near 58% for monthly plans. Gold and Platinum are about 50% by volume and about 75% of revenue, with churn stable at about 11 to 11.5%. Management has chosen to slow gross additions until the churn is understood rather than buy volume at the old rate, and offered no timing on the October 2026 call. None of this breaks the model this year, because the premium cohort is being harvested. It breaks the compounding story if it persists: a marketplace is worth its funnel, and this funnel's intake has been narrowing for about three years.
What do the financials show?
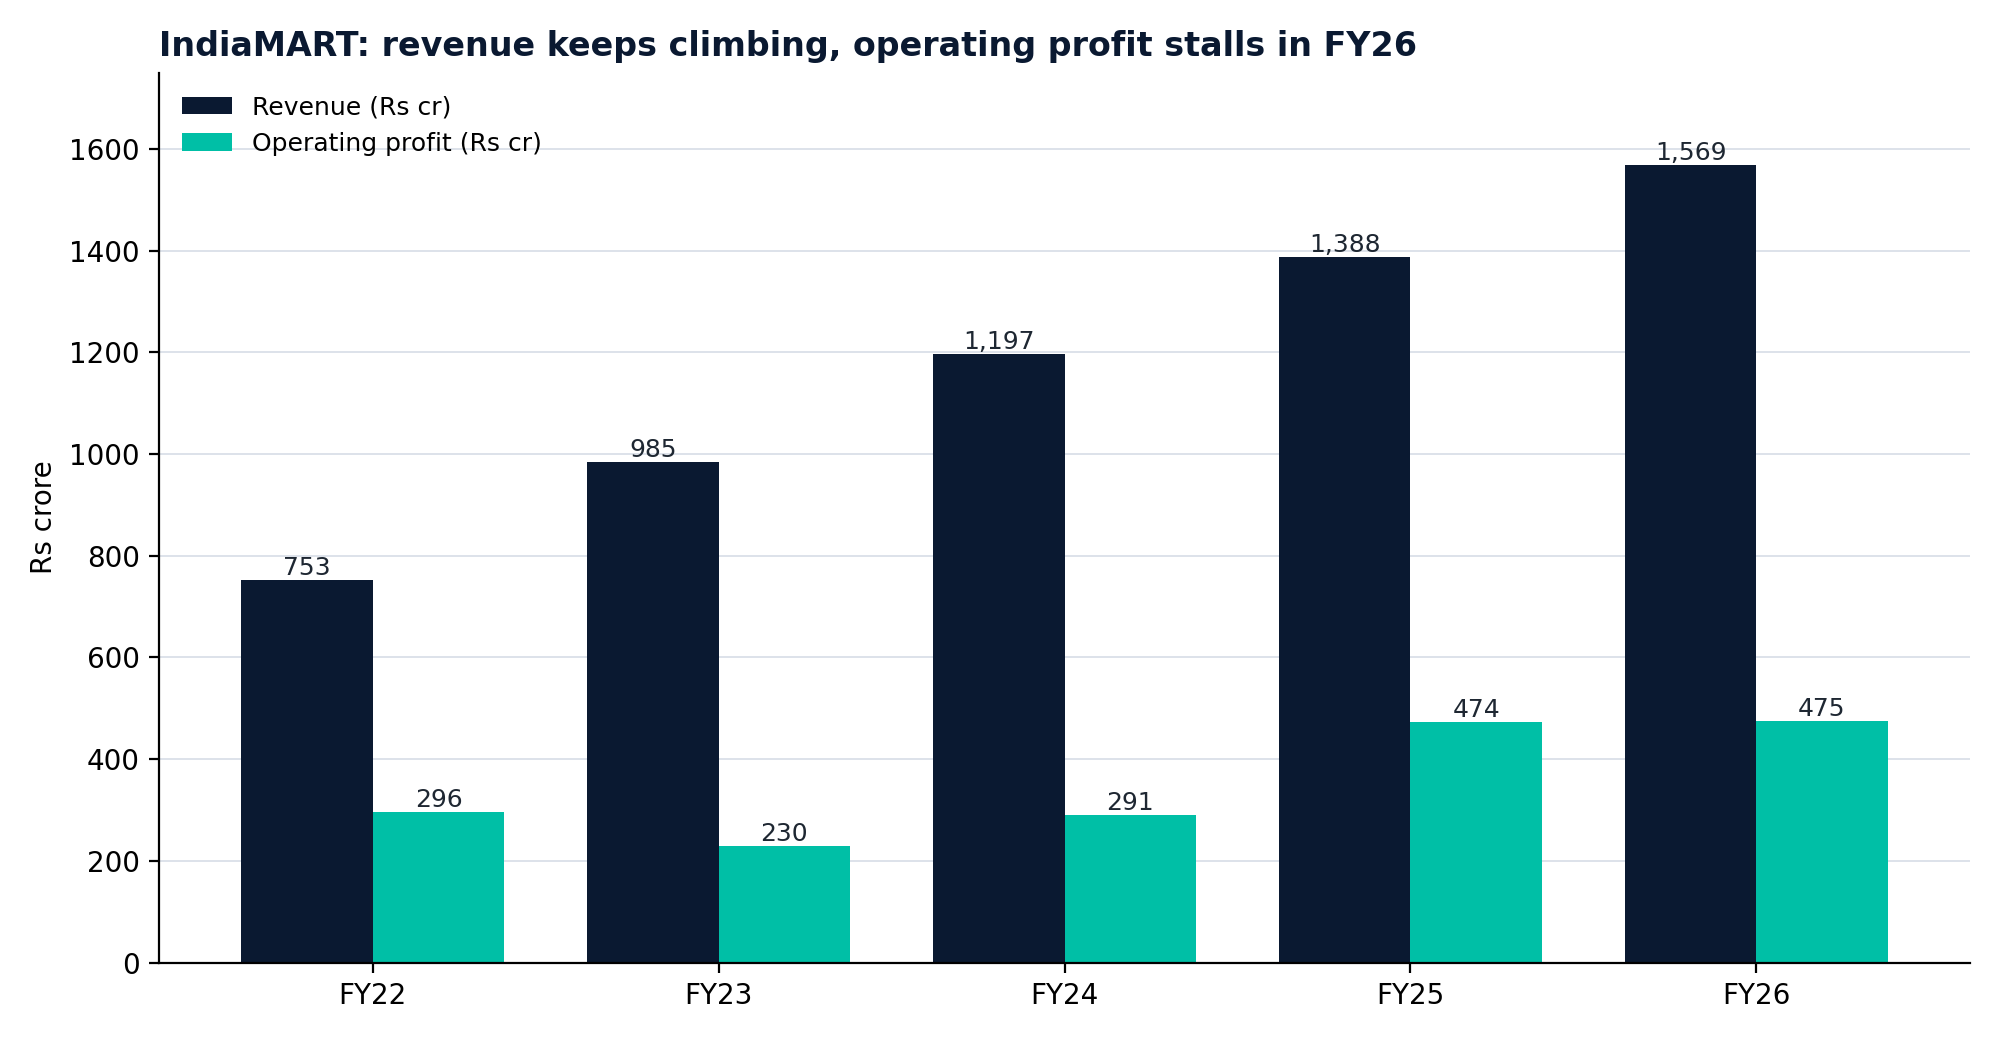
| Fiscal year (ends March) | Revenue (Rs cr) | YoY | Operating profit (Rs cr) | Operating margin | PAT (Rs cr) | EPS (Rs) | Operating cash flow (Rs cr) | Free cash flow (Rs cr) |
|---|---|---|---|---|---|---|---|---|
| FY22 | 753 | +12.4% | 296 | 39% | 298 | 48.71 | 402 | 398 |
| FY23 | 985 | +30.8% | 230 | 23% | 284 | 46.38 | 476 | 460 |
| FY24 | 1,197 | +21.5% | 291 | 24% | 334 | 55.68 | 559 | 545 |
| FY25 | 1,388 | +16.0% | 474 | 34% | 551 | 91.73 | 623 | 615 |
| FY26 | 1,569 | +13.0% | 475 | 30% | 475 | 79.00 | 694 | 687 |
Consolidated figures, Screener.in series, October 2026. The company reported consolidated EBITDA of Rs 530 crore at a 34% margin for FY26 and standalone EBITDA of Rs 520 crore at 36%, with the gap to the Screener operating profit line sitting in classification. Reported PAT swings with mark to market moves on the investment book: Q4 FY26 PAT of Rs 50 crore, Q1 FY27 PAT of Rs 172 crore, Q2 FY27 PAT of Rs 91 crore. ROE printed at 20.7% and ROCE at 28.0% in FY26.
How strong are the balance sheet and cash flow?
| Metric | FY22 | FY23 | FY24 | FY25 | FY26 |
|---|---|---|---|---|---|
| Cash from operations (Rs cr) | 402 | 476 | 559 | 623 | 694 |
| Free cash flow (Rs cr) | 398 | 460 | 545 | 615 | 687 |
| Borrowings (Rs cr, March) | 56 | 46 | 41 | 33 | 23 |
| Investments on balance sheet (Rs cr, March) | 2,722 | 2,784 | 2,746 | 3,453 | 3,792 |
| Dividend payout (Screener) | 2% | 22% | 36% | 54% | 76% |
Suppliers pay subscriptions upfront, so customers fund the company: deferred revenue stood at Rs 2,029 crore at September 2026, working capital days print at about minus 301, and free cash flow has risen every year to a cumulative Rs 2,705 crore over five years against cumulative PAT of Rs 1,942 crore, a conversion of about 139%. Cash and investments of Rs 3,234 crore at September 2026 stand against borrowings of Rs 20 crore and total equity of Rs 2,316 crore. Capital allocation runs in three legs: a total FY26 dividend of Rs 60 per share (Rs 30 final plus Rs 30 special), about Rs 900 crore invested across 13 startups since April 2021 on secondary summaries, and a compounding treasury. The deduction is the portfolio's return so far; the defence is sizing, at about sixteen months of free cash flow for the whole programme.
Has management delivered on its roadmap?
| Commitment | Stated | Delivered | Grade |
|---|---|---|---|
| Busy Infotech acquisition | 100% for up to Rs 500 cr, Jan 2022 | Closed Apr 6, 2022; accounting revenue up 38.6% in H1 FY27 | Delivered |
| Livekeeping control | 51.09% for Rs 45.98 cr, 2022 | Remainder bought May 2025 for Rs 26.78 cr; now 100% owned | Delivered |
| Long term EBITDA margin | 33% long term guide, restated Q2 FY27 | Q2 FY27 printed 37% consol and 40% standalone, flattered by low sales investment | Met, with the caveat stated |
| FY27 growth shape | About 10% revenue growth aim for FY27 | H1 FY27 revenue +10.5% | On track |
| Paying supplier growth | Additions as the growth engine in pre 2024 commentary and broker models | Base has fallen since Q3 FY26; 217k in Q2 FY27, down 2% YoY | Missed |
| Transaction and payments expansion | Pay With IndiaMART and Tolexo as transaction steps | Both cited by the CEO in Oct 2026 as failed experiments; strategy reset to listings plus facilitation pilots | Missed, then honestly closed |
| IndiaMART Finance | Wholly owned finance subsidiary approved, Q1 FY27 board | Credit facilitation pilots only, no own book lending | Pending |
Deals and margin promises get delivered to the rupee, and market promises slip: the paying supplier engine every pre 2024 model assumed has stalled for three years. On governance, Dinesh Agarwal's call commentary is unusually candid, including about failure, promoters held 49.07% in September 2026 with no pledging disclosed, and institutions hold most of the rest (FII 20.32%, DII 9.61%). The governance deduction is tempo, not conduct: entry tier churn since FY24 and the AI search shift were both visible for years before the response hardened.
Who competes with IndiaMART?
| Player | Model | Position in Oct 2026 |
|---|---|---|
| IndiaMART | Listings and leads, subscription | About 60% of online B2B classifieds (secondary estimates); 217k paying suppliers |
| Justdial / JD Mart | Local search plus B2B marketplace | Listed; JD Mart live since Feb 2021; parent at Rs 644.50, 11.9x earnings (Oct 30, 2026) |
| TradeIndia | Listings and leads, export heavy | Unlisted, among the oldest B2B portals; no audited public financials |
| Udaan | Transactional wholesale, own logistics and credit | Unlisted; raised about $1.99B on Tracxn; retrenched from peak ambitions |
| Moglix | MRO procurement and supply chain | Unlisted; raised about $471M on Tracxn; enterprise focused |
| Alibaba.com and Amazon Business | Cross border and procurement platforms | Global scale, limited Indian SME classified depth |
JD Mart launched in February 2021, after IndiaMART won a temporary Delhi High Court injunction in a copyright case that delayed the launch by months, and five years on it has not disclosed a paying supplier base anywhere near 217,000. The transactional rivals proved the listing model's point: owning inventory, logistics and credit in SME wholesale burns capital, while the asset light listing model prints 30% plus operating margins and negative working capital. The real competitor is the search box: Google AI Overviews answer supplier queries before a click exists, and that competition cannot be out sold or out priced, only adapted to.
What is IndiaMART worth against peers?
At Rs 1,487 (October 30, 2026): P/E 17.8 times on TTM EPS of about Rs 83, P/B 3.9 times on book value of Rs 385, free cash flow yield 7.7%, and an FY26 dividend of Rs 60 per share equal to about 4.0% of the reference price.
| Company | Price (Rs, Oct 30, 2026) | P/E | ROE | Note |
|---|---|---|---|---|
| IndiaMART | 1,487 | 17.8x | 20.7% | B2B classified leader; ROCE 28.0%; net cash Rs 3,234 cr |
| Justdial | 644.50 | 11.9x | About 9.7% | Local search and JD Mart; treasury heavy; no dividend |
The market pays 17.8 times for the name earning a 20.7% ROE with a growing software leg, against 11.9 times for the name earning under 10% with a stalled B2B arm: a quality gap, not an obvious mispricing between the two. The mispricing claim rests on IndiaMART's own cash: a 7.7% free cash flow yield on a net cash balance sheet, in a price down 40% in a year and 16% a year for five years while revenue compounded at 19%. FY2029 scenarios: bear Rs 1,350 (7% CAGR, 26.0% margin, EPS Rs 84 at 16x), base Rs 2,350 (12% CAGR, 32.0% margin, EPS Rs 117 at 20x), bull Rs 3,400 (16% CAGR, 35.0% margin, EPS Rs 143 at 24x). The bear case is a stagnation case, not a collapse case, which is the point of the rating.
What are the key risks?
The funnel risk comes first: paying suppliers have fallen for three straight quarters, active buyers fell 7% and enquiries 14% in Q2 FY27, and Silver churn near 40% says the entry product is not delivering value a small supplier can feel. The search risk is structural: if AI intermediaries become the default SME sourcing interface, the toll booth keeps its existing subscribers and loses the next generation's discovery moment. The third risk is model temptation: a transactional build, payments, and lending all promise to monetise the trade flow, and the company's own history here is failure by its CEO's own account, which is why the balance sheet light design of the finance pilots matters. Then treasury noise in reported PAT, widening associate losses, employee cost inflation, and a technical picture that says the de-rating has momentum of its own. Q3 FY27 is the next checkpoint: paying suppliers, enquiries, and whether sales investment returns without breaking the 33% margin guide.
Sources: company results and releases (Q2 and H1 FY27, October 27, 2026; Q1 FY27, July 21, 2026; Q4 and FY26 press release, April 30, 2026); Q2 FY27 earnings call coverage via MediaNama and Quartr transcript summaries; Screener.in consolidated page, crawled October 30, 2026; reference price Rs 1,487 on October 30, 2026 from Screener and Finnhub; Busy and Livekeeping deal terms via company announcement coverage and Dalal Street Journal; Tracxn funding totals and secondary market share and portfolio summaries labelled as estimates wherever they appear. Tier mix and churn figures are management disclosures on earnings calls as summarised in October 2026 third party analysis.
© 2026 DalalBytes Research · For educational purposes only. Not investment advice.