

What is the verdict on Alphabet?
74/100. Positive. The strongest consumer franchise in technology, a cloud business doubling on its own silicon, and a cash engine now pointed entirely at the buildout.
What would change the score. The score rises if Alphabet holds the fiscal 2027 capex guide near the fiscal 2026 exit rate and quarterly free cash flow turns positive again by Q2 2027 with Cloud growth above 60%, and it falls if Search revenue growth prints in single digits for two straight quarters or the Q4 2026 call again raises capex without naming a free cash flow recovery window.
| 74/100 | DalalBytes score |
| $279.84 | Reference price. October 30 2026 close |
| $3.4T | Market cap at about 12.2B shares |
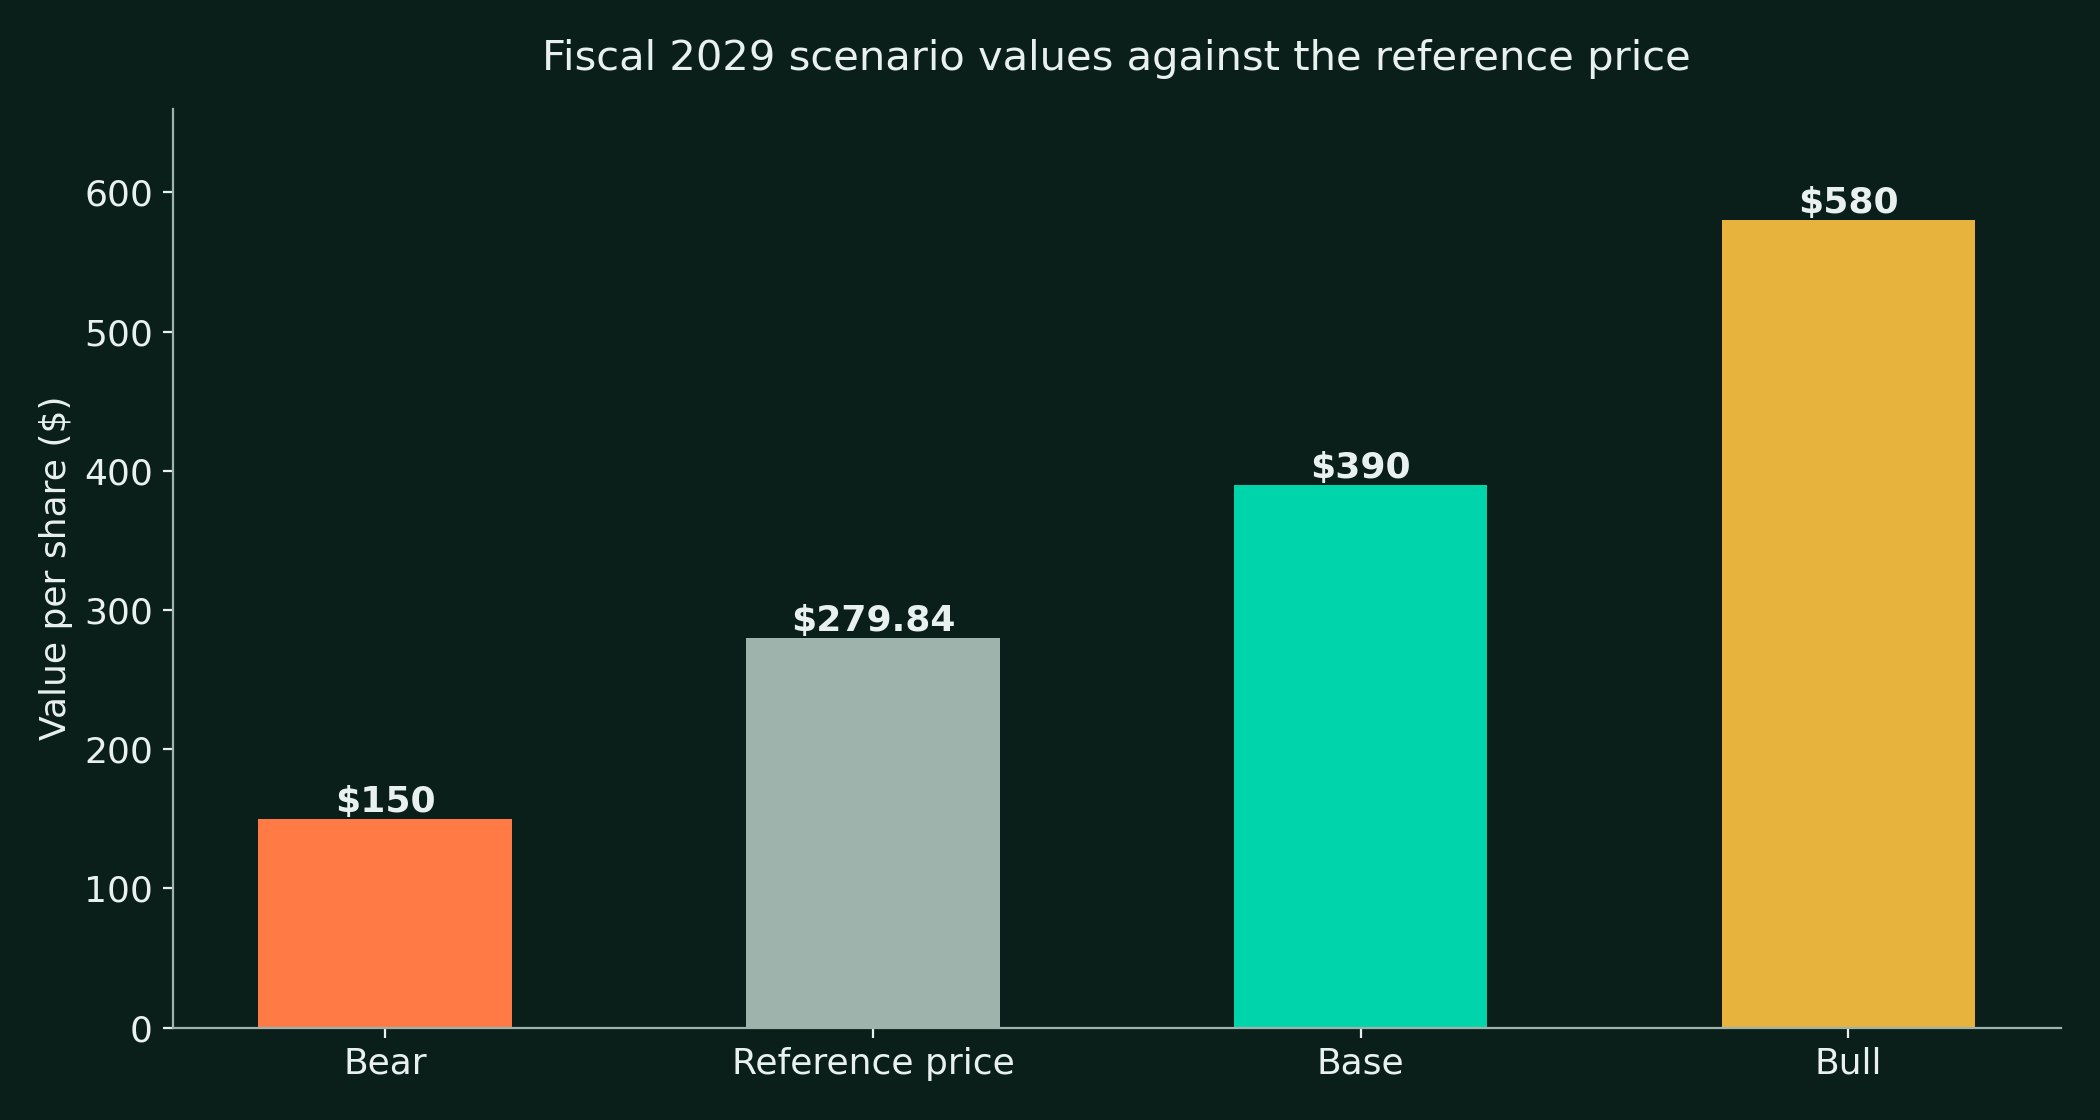
| $150 / $390 / $580 | Fiscal 2029 bear / base / bull |
Alphabet today is two facts that point in opposite directions. The first is operating momentum of a kind no company this size has produced before. Google Cloud doubled in a year, the contracted backlog behind it reached $561B, and the silicon that powers the growth is increasingly Alphabet's own, sold to customers that used to buy only NVIDIA. The second fact is that the cash flow statement has been surrendered to that buildout. Free cash flow went negative for two straight quarters, the buyback stopped for the first time since 2015, and the company raised debt and equity in size to fund the gap.
The argument is not whether the buildout is real. Section 10 audits the promises, and most of them were beaten. The argument is what to pay for a company whose earnings denominator is temporarily buried under depreciation and private investment marks. On core earnings the reference price pays about 26 times trailing and about 20 times forward consensus, for a business whose largest segment held its share through the AI shock and whose fastest segment is compounding against a contracted backlog.
Our base case has Cloud growth decaying from 103% to the high twenties by fiscal 2029 and Search compounding at high single digits through the AI transition, and still lands at $390. The bear case is a digestion case, not a collapse case, and it still costs a holder about half the price. That spread, elite delivery on one side and an unpriced cash flow recovery on the other, is the report in one paragraph.
The price basis of this report
This report uses the Friday October 30, 2026 close of $279.84 throughout, the same price carried in the DalalBytes Compute Price Reset valuation table published November 1, 2026. Alphabet has not announced the date of its Q4 2026 results as of November 2, 2026. The print is expected in early February 2027, and management has promised the fiscal 2027 capex figure on that call. Treat the timing as unconfirmed until the company issues its announcement release.
What is Alphabet in one page?
Alphabet Inc. is based in Mountain View, California, and trades on Nasdaq as GOOGL (Class A) and GOOG (Class C), with Class B shares held by the founders carrying ten votes each. Google was founded in 1998, went public in 2004, and became a subsidiary of the Alphabet holding company in 2015. Sundar Pichai has led Google since 2015 and Alphabet since 2019. The fiscal year is the calendar year, and the latest reported quarter is Q3 2026, which ended September 30, 2026.
The company reports three segments. Google Services holds Search, YouTube, subscriptions, platforms and devices. Google Cloud holds GCP, Workspace, and, since 2026, TPU systems as a named product revenue line. Other Bets holds Waymo and the earlier-stage portfolio. Shared AI research and development runs through Alphabet-level activities, which consumed $16.8B in fiscal 2025 and $18.8B in the first nine months of 2026 alone.
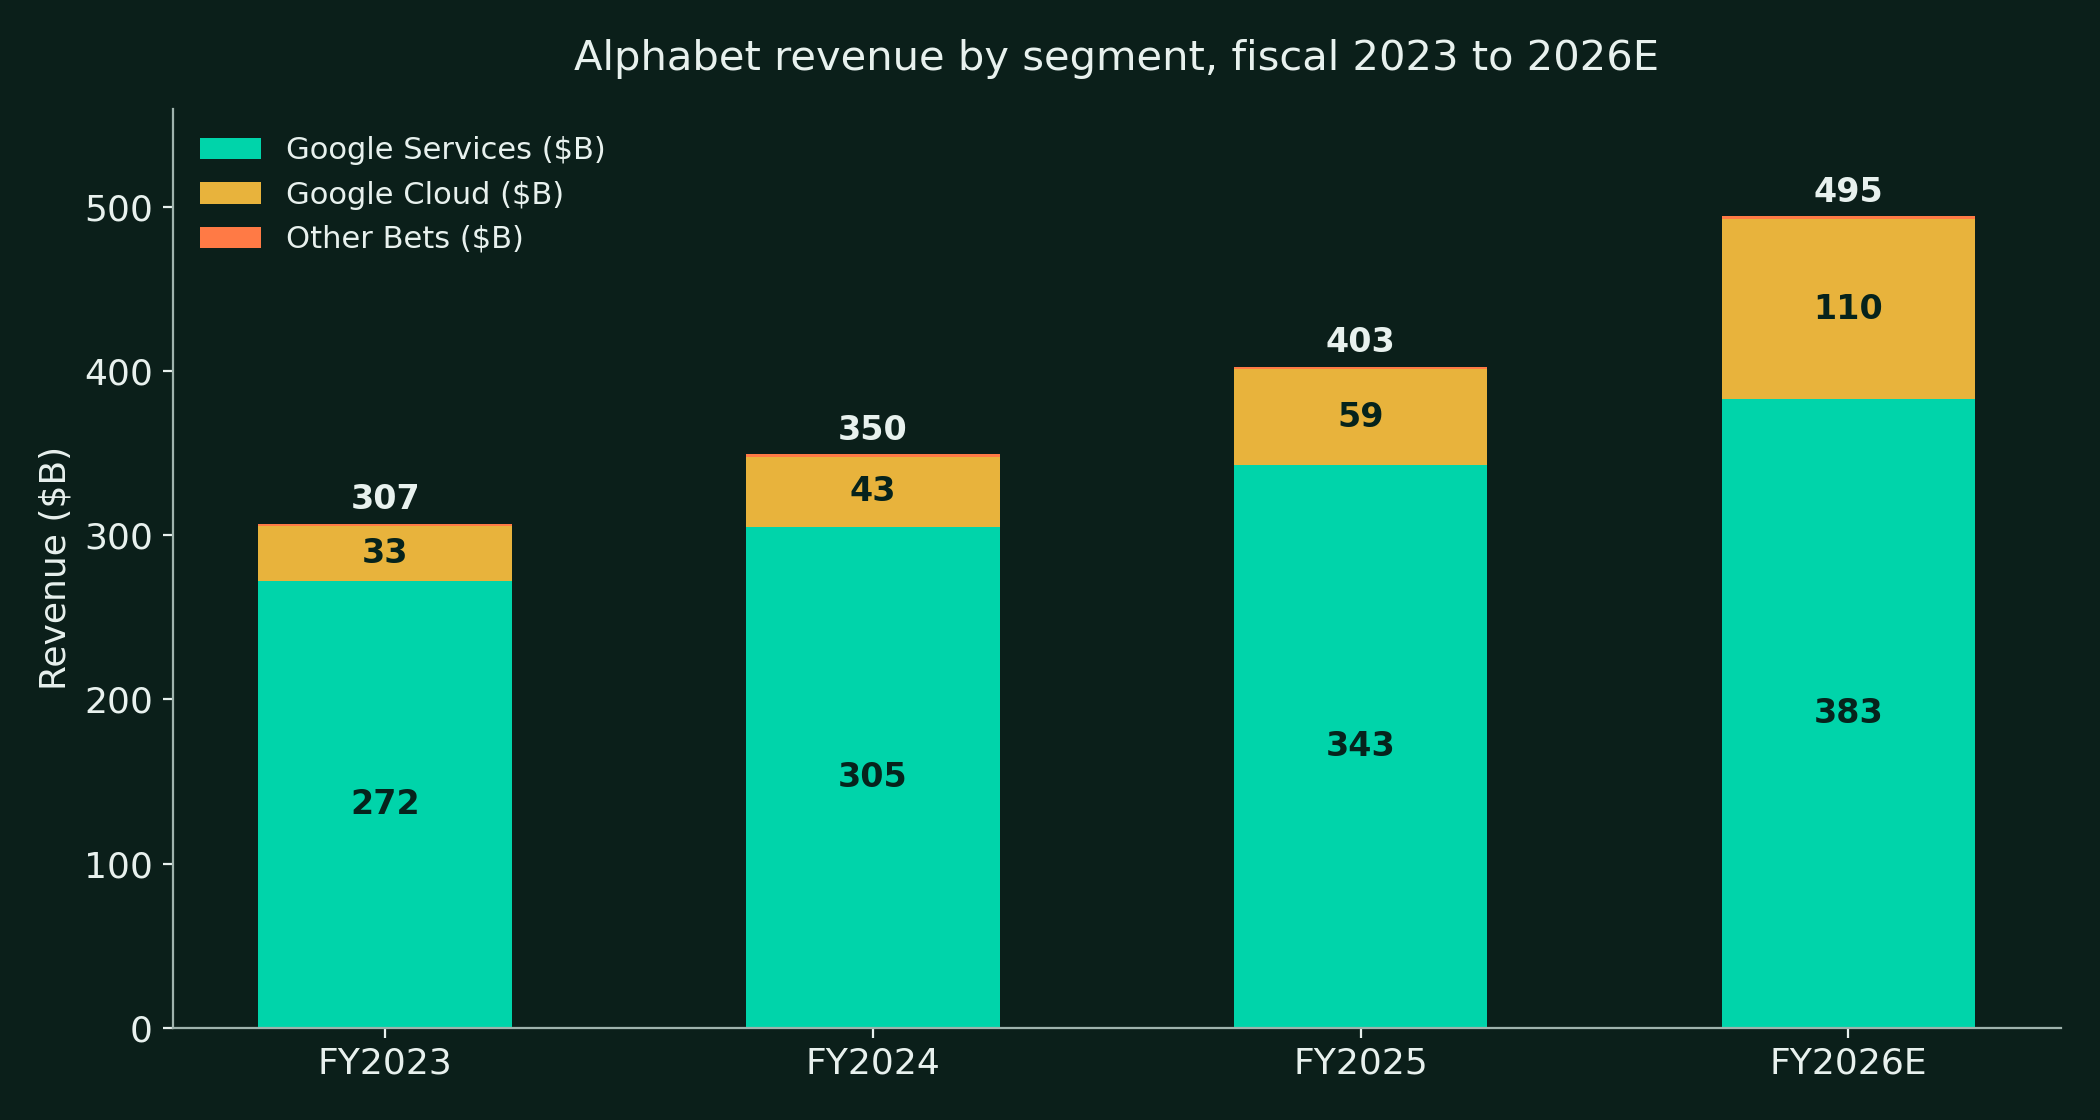
| Metric | FY2024 | FY2025 | Q3 2026 |
|---|---|---|---|
| Total revenue ($M) | 350,018 | 402,836 | 127,577 |
| Google Services revenue ($M) | 304,930 | 342,721 | 96,302 |
| Google Cloud revenue ($M) | 43,229 | 58,705 | 30,709 |
| GAAP operating income ($M) | 112,390 | 129,039 | 40,576 |
| GAAP diluted EPS | $8.04 | $10.81 | $2.12 |
| Free cash flow ($M) | 72,764 | 73,266 | (9,065) |
- Fiscal 2025 revenue grew 15% to $402.8B, and nine-month 2026 revenue of $357.3B already equals 89% of it.
- Google Cloud revenue in nine months of 2026 was $75.5B, more than all of fiscal 2025.
- Headcount reached 204,757 at September 30, 2026, up 8% year over year.
- Management describes the business as running at a half-trillion dollar revenue run rate after Q3 2026.
- Fiscal 2024 free cash flow is calculated from filed operating cash flow of $125.3B less capex of $52.5B.
How does Alphabet make money?
| Revenue line ($M) | FY2024 | FY2025 | 9M 2026 |
|---|---|---|---|
| Google Search & other | 198,084 | 224,532 | 187,020 |
| YouTube ads | 36,147 | 40,367 | 32,145 |
| Google Network | 30,359 | 29,792 | 21,729 |
| Google advertising | 264,590 | 294,691 | 240,894 |
| Subscriptions, platforms, and devices | 40,340 | 48,030 | 39,585 |
| Google Services total | 304,930 | 342,721 | 280,479 |
| Google Cloud | 43,229 | 58,705 | 75,505 |
| Other Bets | 1,648 | 1,537 | 1,165 |
| Total revenues | 350,018 | 402,836 | 357,269 |
- Search & other grew 13% in fiscal 2025 to $224.5B, and remains about 56% of total revenue.
- Search growth in 2026 ran 19% in Q1, 17% in Q2 and 12% in Q3, a deceleration section 5 takes apart.
- YouTube ads grew 12% in fiscal 2025 to $40.4B.
- Google Network is the one shrinking line, down 2% in fiscal 2025 and up just 1% in Q3 2026.
- Subscriptions, platforms, and devices grew 19% in fiscal 2025 to $48.0B, the fastest Services line that year.
- Traffic acquisition costs were $16.4B in Q3 2026, up 10% year over year, growing slower than Search revenue.
- Cloud was 15% of fiscal 2025 revenue and 24% of Q3 2026 revenue. The mix shift is the story of the next three years.
How big is Google Cloud and the TPU business?
GCP and the backlog
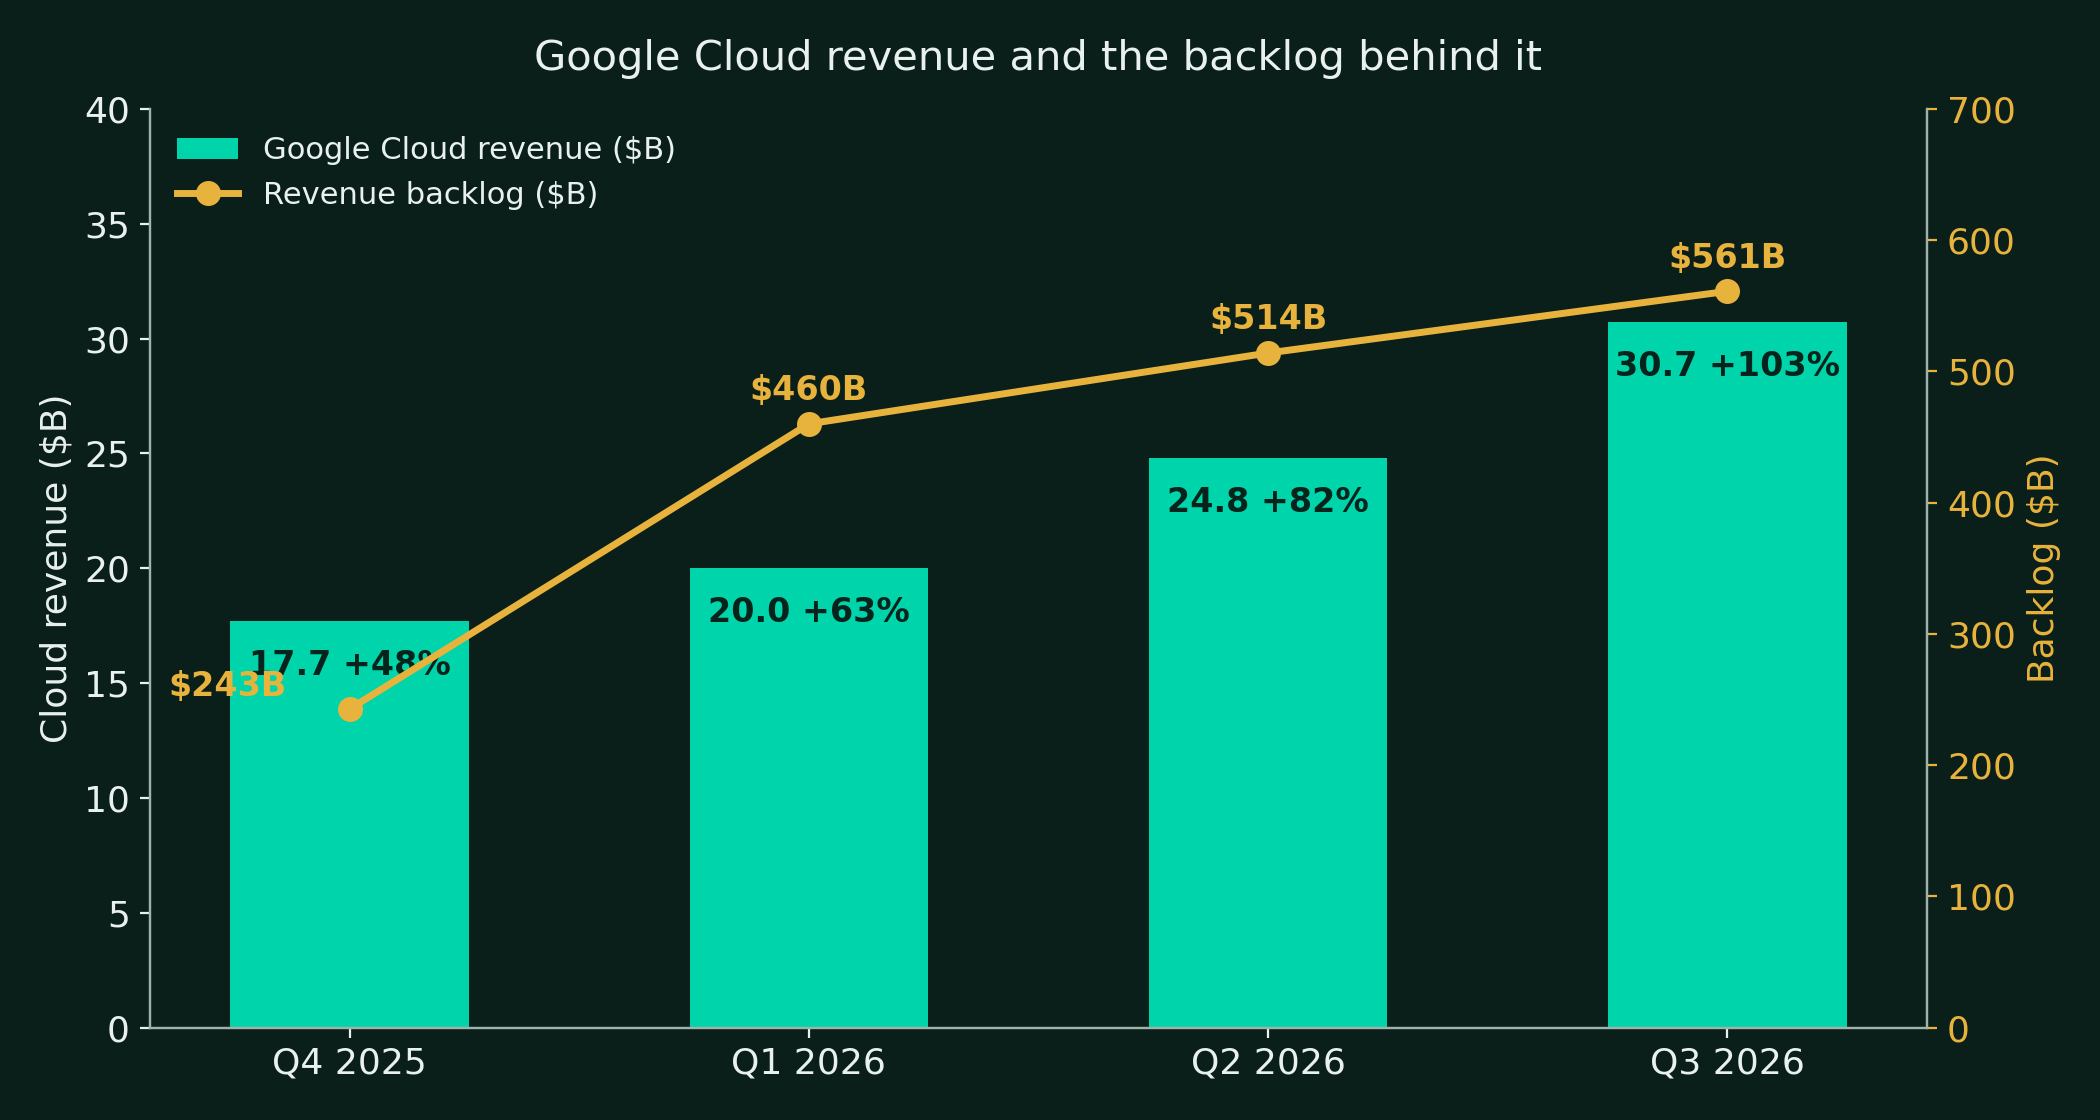
- Google Cloud revenue grew 48% in Q4 2025, 63% in Q1 2026, 82% in Q2 and 103% in Q3.
- Revenue backlog was $242.8B at December 31, 2025 per the Form 10-K, then over $460B at Q1, $514B at Q2 and $561B at Q3 2026.
- Just over 55% of the Q3 backlog is expected to convert to revenue within 24 months.
- Management said on the Q3 call that the majority of the backlog is tied to typical GCP contracts, not one-off system sales.
- Cloud operating income reached $11.1B in Q3 2026 at a 36.2% margin, against $3.6B in Q3 2025.
- Cloud operating income in nine months of 2026 was $26.5B, nearly double the $13.9B of all of fiscal 2025.
- Third-party bridging capacity came online only at the very end of Q3 2026 and ramps through Q4, with near-term margin headwinds flagged while it is used.
- Inventory rose to $13.3B at September 30, 2026 from $2.4B at December 31, 2025, as TPU systems are built against signed contracts ahead of revenue.
The silicon: from internal tool to product line
- The 2026 segment description in Alphabet's filings now lists TPU systems as a Google Cloud product revenue line. The Q3 2026 release states TPU systems sales were a meaningful contributor to Cloud revenue growth.
- Ironwood, the seventh-generation TPU, reached general availability on March 31, 2026. It delivers 4,614 TFLOPS of FP8 compute and 192 GiB of HBM per chip, in pods of up to 9,216 chips.
- Published on-demand pricing per chip-hour runs $1.20 for TPU v5e, $2.70 for Trillium (v6e), $4.20 for v5p and $12.00 for Ironwood, with one-year commitments 30% below on-demand and three-year commitments 55% below.
- SemiAnalysis put Ironwood inference total cost of ownership at $0.18 per million tokens in February 2026, against $0.31 for comparable NVIDIA B200 configurations.
- The eighth generation, announced April 22, 2026 at Cloud Next, splits in two for the first time. TPU 8t (Sunfish) is the training chip, designed with Broadcom. TPU 8i (Zebrafish) is the inference chip, designed with MediaTek.
- TPU 8t delivers 12.6 FP4 petaFLOPS per chip with 216 GB of HBM3e, and scales to a 9,600-chip superpod at 121 FP4 exaflops with 2 PB of shared memory, about three times Ironwood pod compute at twice the performance per watt.
- TPU 8i delivers 10.1 FP4 petaFLOPS with 288 GB of HBM3e and 384 MB of on-chip SRAM, three times Ironwood, on a new Boardfly topology built for low-latency agentic serving.
- Broadcom's five-year TPU design agreement runs through 2031, and Broadcom began production shipments of TPU 8i in September 2026.
- TorchTPU, released in October 2026, makes TPUs a native PyTorch device, lowering the switching cost that protected NVIDIA's software moat.
- Morgan Stanley estimates about $13B of Google revenue per 500,000 TPUs sold to external customers. Mizuho estimates Broadcom's Google-linked AI revenue at $21B in 2026, more than doubling to $42B in 2027.
The Anthropic file
- Alphabet invested about $3B in Anthropic across 2023 to 2025, for a reported stake near 10% before the 2026 rounds.
- On October 23, 2025, Anthropic committed to up to one million TPUs, bringing well over a gigawatt of capacity online in 2026, in a deal reported at tens of billions of dollars.
- On April 6, 2026, Anthropic, Google and Broadcom expanded the arrangement to multiple gigawatts of next-generation TPU capacity from 2027, about 3.5 GW per Broadcom's SEC filing.
- Anthropic's S-1, filed publicly on October 26, 2026, shows about $114.5B of Google Cloud spend committed through 2033, and Alphabet as a greater-than-5% shareholder after the IPO.
- Anthropic's revenue run rate rose from about $9B at the end of 2025 to about $65B by the end of July 2026, so the largest TPU customer is also one of the fastest-growing software companies on record.
- The relationship is three-sided. Anthropic is Alphabet's investee, its largest external silicon customer, and the maker of Claude, the model family that competes most directly with Gemini. Section 13 prices that circularity.
- Other named TPU demand: Apple is scaling pre-training of its foundation models on the latest TPU generation, Meta signed a reported multi-billion-dollar TPU rental in February 2026, Oracle will offer TPUs in its own cloud from 2027, and nearly 100 customers now run TPUs.
Is Search surviving the AI transition?
- StatCounter put Google at 89.94% of global searches in September 2026, with Bing at 5.29%. Share held through the AI shock.
- Management reported year-over-year query growth in Q3 2026 was the highest in five years, including growth in commercial queries.
- AI Overviews reached 2.5 billion monthly users by May 2026, and AI Mode passed one billion monthly users within a year of launch.
- AI Overviews appeared on about 48% of tracked queries by February 2026 (BrightEdge), and 68% of US searches ended without a click in early 2026 (SparkToro and Similarweb).
- ChatGPT reached 1.2 billion weekly users by September 2026 (OpenAI DevDay). The challenger is real, and it is still a fraction of Google's more than five trillion searches a year.
- AI Mode queries run about three times longer than traditional searches, and one in five uses voice, images or documents. Visual searches crossed 50 billion a month.
- The monetization gap is conceded in management's own words. AI Mode queries monetize at lower rates today, and ads are scaling inside AI Overviews and AI Mode with international expansion under way.
- The counter-evidence: click-through rates on sponsored and organic product listings inside AI Mode are already similar, and management says the majority of AI Mode queries are incremental rather than cannibalized.
- The Q3 deceleration had named causes beyond AI mix: foreign exchange was the single largest driver versus Q2, APAC retail advertisers were hit by the EU ending its de minimis exception, media spending normalized after the FIFA World Cup quarter, and lapping late-2025 acceleration cost about three points.
We are focused on building the best Search user experience, followed by monetization.
Sundar Pichai, Q3 2026 earnings call
| Search & other revenue growth | Q1 2026 | Q2 2026 | Q3 2026 |
|---|---|---|---|
| Year over year | +19% | +17% | +12% |
| Named drags | None flagged | None flagged | FX, AI Mode mix, de minimis, media normalization, tough lap |
How strong are YouTube and subscriptions?
- YouTube ads revenue was $11.2B in Q3 2026, up 9%, and $43.5B across the last four quarters.
- YouTube ads plus subscriptions together exceeded $60B in fiscal 2025, a scale no other video platform reports.
- Paid subscriptions across consumer services passed 325 million in Q4 2025 and reached 350 million in Q1 2026.
- YouTube Music and Premium passed 150 million subscribers including trials in Q3 2026.
- Subscriptions, platforms, and devices revenue grew 11% in Q3 2026 to $14.3B, with subscriptions the growth engine inside the line.
- World Cup 2026 content drew over 1.7 billion unique viewers to YouTube in Q2 2026, a reminder that the platform is now the default screen for live global events.
- For scale, Netflix, the strongest subscription video business in the world, delivered $12.87B of revenue in Q3 2026. YouTube's advertising line alone nearly matches it, before any subscription revenue is counted.
- The strategic point is bundling. YouTube Premium, YouTube Music, Google One and Gemini subscriptions share one billing relationship, and the subscription base is the distribution Gemini sells into.
How strong is the moat?
The moat is a stack, and each layer reinforces the next. Distribution comes first. Google Search, Chrome, Assistant and now Gemini sit as defaults across Android and through paid placement on rival platforms, and the query volume those defaults produce is the training data no competitor can buy. The September 2025 remedies judgment trimmed the exclusivity of those arrangements but left the payments themselves legal, and Alphabet's share of global search, 89.94% in September 2026, has not moved in the year since.
The second layer is vertical integration that no rival matches end to end. Alphabet designs its own accelerators, trains its own frontier models on them, and distributes those models through Search, YouTube, Android and Cloud. That chain is why Ironwood inference economics beat merchant silicon on cost per token, and why a customer like Anthropic can scale on TPUs without Alphabet needing NVIDIA's permission or paying NVIDIA's margin.
The third layer is the content and advertiser graph. YouTube's creator library, the advertiser relationships behind $294.7B of fiscal 2025 advertising revenue, and two decades of click and query data are cumulative assets. They compound with usage, and usage is still growing at a five-year-high rate.
The honest bend in the moat sits at the monetization layer, not the usage layer. Zero-click results and AI Mode answer formats tax the ad load per query even as query volume rises. A moat that keeps the users while charging less per user is still a moat, but it converts at a lower rate, and section 12 grades the scenarios on exactly that conversion question.
Who competes with Alphabet and by how much?
| Cloud, quarter ended Sep 30, 2026 | Google Cloud | AWS | Azure |
|---|---|---|---|
| Revenue | $30.71B | $45.98B | $33.17B |
| Growth | +103% | +39.3% | +48% constant currency |
| Operating margin | 36.2% | 38.7% | Not broken out |
| Backlog | $561B | $578B | $677B Microsoft RPO |
- Google Cloud is now about 92% of Azure's quarterly revenue and 67% of AWS's, growing at more than twice either rival's rate.
- Microsoft guided Azure growth of 49 to 50% for the December 2026 quarter, so the gap closes on growth only if Google decelerates hard.
- AWS guided growth above 40% for both 2027 and 2028 on its Q3 2026 call. All three clouds are capacity constrained, not demand constrained, today.
- In models, Gemini 4 Carbon scored 59 on the Artificial Analysis Intelligence Index v5.0 at its October 28, 2026 announcement, one point above Claude Opus 5.5 at 58, with OpenAI's GPT-6.1 Astra also in the field. Gemini 4 Argon, the generally available model, scored 50.
- In consumer AI usage, ChatGPT's 1.2 billion weekly users dwarf the Gemini app's one billion monthly users. Google's counterweight is distribution: Gemini rides inside Search, Android and Workspace rather than standing alone.
- In merchant silicon, NVIDIA remains the default and the benchmark. The TPU wedge is price-performance on inference at scale, quantified in section 4 at $0.18 against $0.31 per million tokens.
- In video, the quantified rival is Netflix at $12.87B of quarterly revenue. YouTube answers with a larger combined ads and subscriptions pool and the live-events gravity shown by the World Cup numbers.
What do the financial statements show?
The income statement and the marks problem
| ($M) | FY2024 | FY2025 | 9M 2026 |
|---|---|---|---|
| Total revenue | 350,018 | 402,836 | 357,269 |
| Operating income | 112,390 | 129,039 | 121,042 |
| Operating margin | 32.1% | 32.0% | 33.9% |
| Net income | 100,118 | 132,170 | 201,239 |
| Diluted EPS | $8.04 | $10.81 | Not meaningful |
- Nine-month 2026 net income of $201.2B is not a trend figure. It includes $126.8B of net gains on debt and equity securities in other income, which is why the diluted EPS column is marked not meaningful and the marks table below carries the real story.
- Services operating income was $139.4B in fiscal 2025 at a 40.7% margin, and $119.3B in nine months of 2026 at 42.5%.
- Alphabet-level activities, mostly shared AI research, consumed $16.8B in fiscal 2025 and $18.8B in nine months of 2026. It is the fastest-growing cost line in the company.
- Depreciation rose 49% year over year in Q3 2026, to $8.4B in the quarter. The capex of 2024 and 2025 is arriving in the cost lines now, and the larger capex of 2026 arrives next.
| Quarter | Equity securities gain (loss) | Headline diluted EPS | Core EPS excluding the mark |
|---|---|---|---|
| Q4 2025 | +$2.3B | $2.82 | About $2.67 |
| Q1 2026 | +$37.7B net other income gain | $5.11 | About $2.73 |
| Q2 2026 | +$99.0B | $9.11 | $2.85 |
| Q3 2026 | ($8.7B) | $2.12 | About $2.67 |
- The Q2 2026 gain of $99.0B was worth $77.1B after tax and $6.26 per share, per the release. Reporting attributes the 2026 marks primarily to SpaceX and Anthropic.
- The Q3 2026 loss of $8.66B pre-tax cut net income by $6.7B and EPS by $0.55. The CFO attributed it primarily to an unrealized loss on the SpaceX stake after its stock price fell in the quarter.
- Core EPS, excluding the disclosed mark effects, ran about $2.67, $2.73, $2.85 and $2.67 across the last four quarters. That flat-to-rising line, not the headline, is the earnings trend.
- Stock-based compensation was $25.0B in fiscal 2025, about a third of that year's free cash flow. It is the quiet second capex.
Cash flow
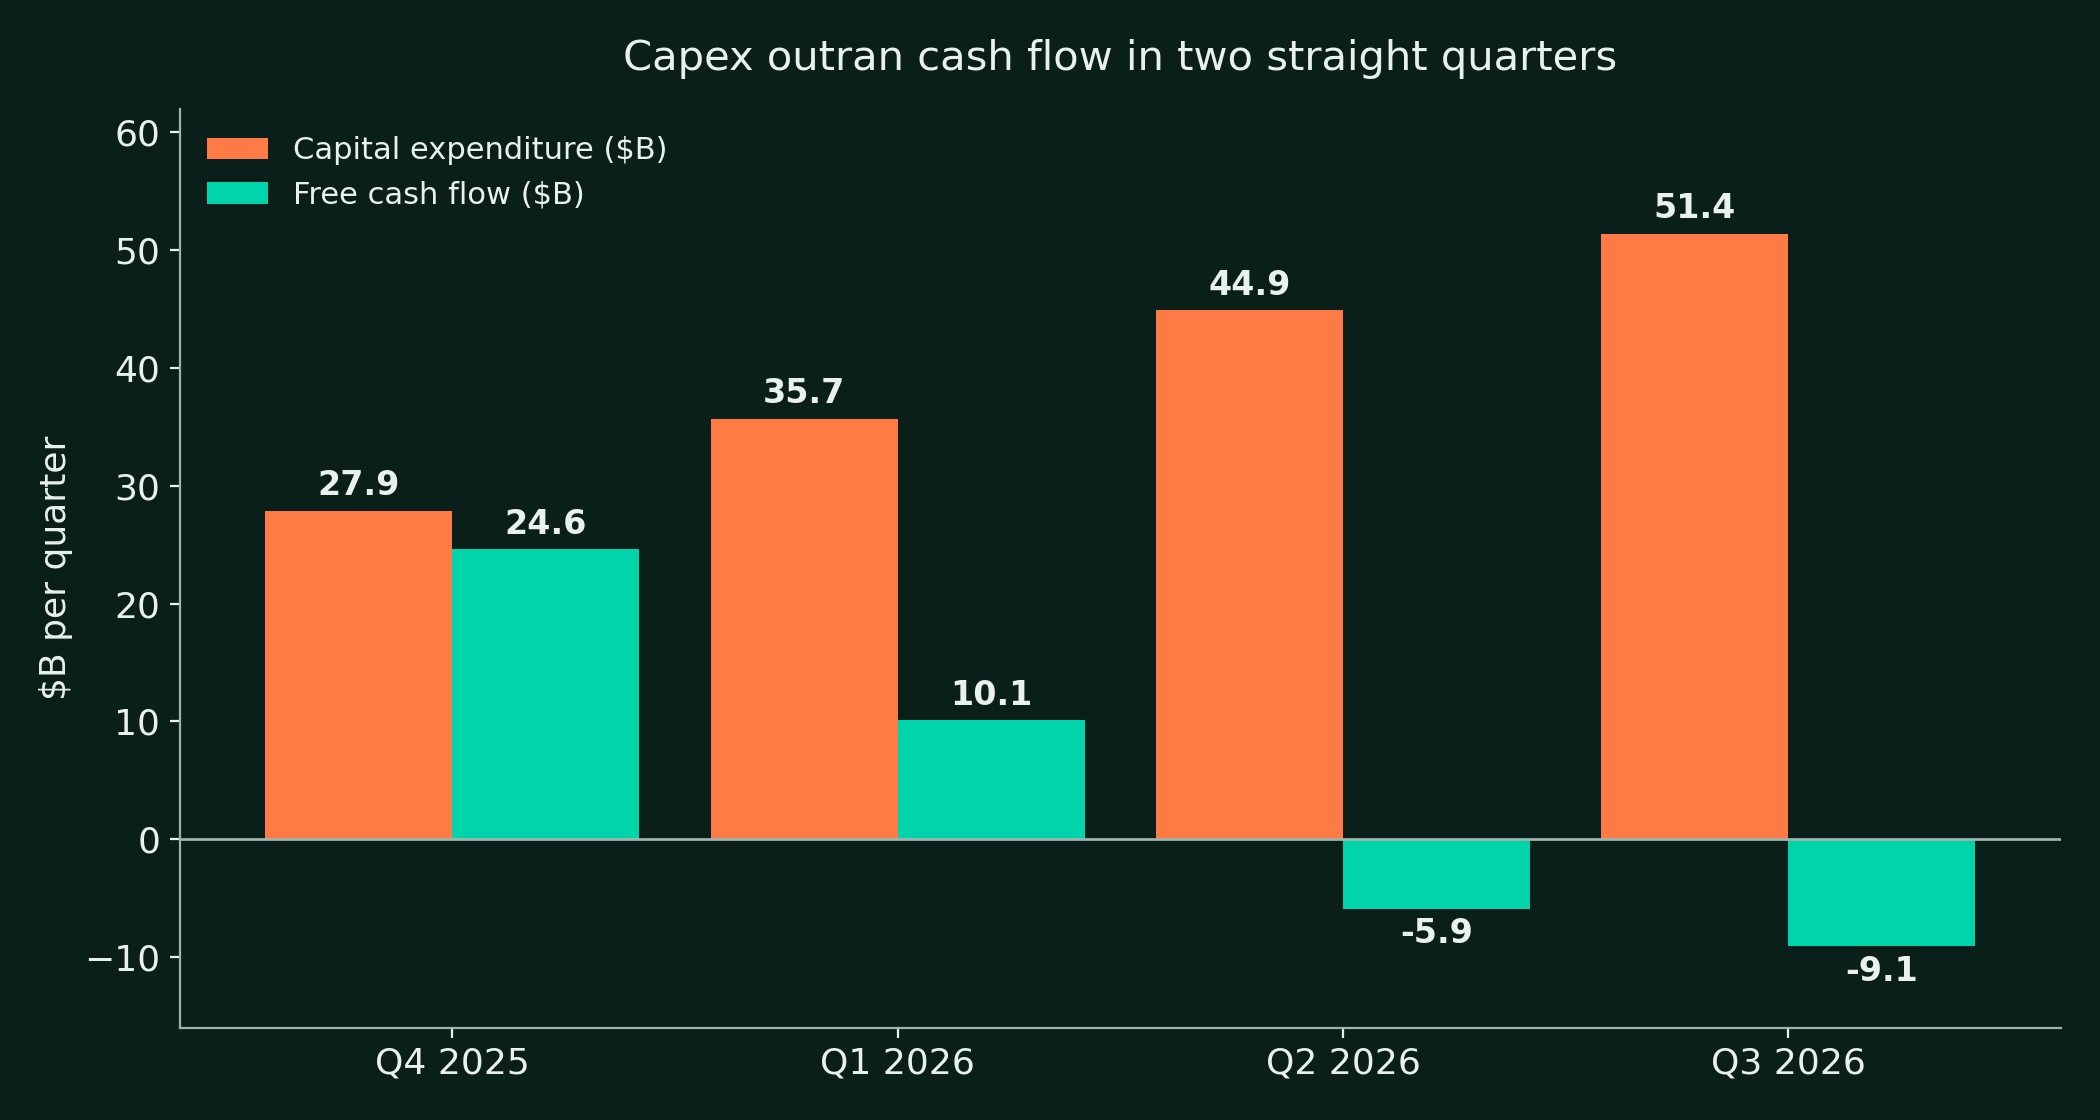
- Operating cash flow set a record on a trailing basis: $179.6B in the twelve months to September 2026.
- Trailing free cash flow still fell to $19.7B, because trailing capex reached $159.8B.
- Q2 2026 free cash flow of negative $5.9B was the first negative quarter in the company's history. Q3 deepened it to negative $9.1B.
- Q3 2026 operating cash flow of $42.3B was down from $48.4B a year earlier despite 25% revenue growth, and included a $5.2B cash payment settling the 2018 European Commission fine after appeals completed.
- The fiscal 2026 capex guide of $195B to $205B implies about $68B of spending in Q4 2026 alone at the midpoint, so a fourth-quarter free cash flow recovery is arithmetically unlikely.
The investment book
- Non-marketable securities on the balance sheet rose from $68.7B at December 31, 2025 to $135.2B at September 30, 2026, almost entirely on mark-to-market gains rather than new purchases.
- The book holds the SpaceX and Anthropic stakes among others. Alphabet does not break out individual carrying values in its releases, which is itself a disclosure gap worth naming.
- The Anthropic IPO, targeted for the week of November 16, 2026 on Nasdaq as ANT, will put a market price on the largest AI holding and convert paper marks into a quoted asset.
- The accounting consequence is permanent, not temporary. As long as the book is this large, GAAP EPS will swing by dollars per quarter on marks, and headline P/E ratios will mislead in both directions.
Has management delivered what it promised?
Five promises define the Alphabet story. They grade very differently, and the differences are the investment case in miniature.
The capex guide is the promise that moved. Alphabet guided fiscal 2026 capex to $175B to $185B on February 4, 2026, raised it to $180B to $190B in April, raised it again to $195B to $205B on July 22, with the July step described as the third increase of the year, and held the range in October while repeating that fiscal 2027 capex will increase significantly. The spending itself was delivered: $132.0B in nine months, on plan against the guide. What was not delivered is a frame for when it stops, or a free cash flow recovery window. Grade: delivered on construction, ungraded on discipline, because management declines to state the test.
Cloud growth is the promise that was beaten. Management spent 2025 promising acceleration as capacity came online, and the delivery ran 48%, 63%, 82% and 103% across the last four quarters, with backlog compounding from $242.8B to $561B behind it. The Q3 call added the honest caveat that third-party bridging capacity carries near-term margin costs. Grade: beaten, with the caveat disclosed rather than buried.
The TPU externalization roadmap is the promise that outran its own story. TPUs were an internal cost advantage for a decade. In thirteen months they became a one-million-chip commitment from Anthropic, a 3.5 GW expansion, a named product revenue line inside Cloud, a second design partner in MediaTek, and a chip other hyperscalers resell. The one soft spot is timing on the eighth generation: announced for general availability later in 2026, with 8i production shipments begun in September 2026 but flagship availability still ramping as this report publishes. Grade: delivered, one generation's launch timing still to prove.
The Gemini cadence promise was parity at the frontier, and it is met on the scoreboard with an asterisk. Gemini 3 in November 2025, the 3.5 family in the first half of 2026, Gemini 4 Argon generally available on October 13, 2026 and Gemini 4 Carbon announced fifteen days later at number one on the Artificial Analysis index. The asterisk is availability: Carbon shipped first to a small set of cyber defenders with no developer date, and Argon, the model anyone can call, scores mid-pack at 50. Grade: at the frontier on announcements, a half-step behind on what customers can deploy today.
The search AI transition carries the oldest explicit claim. Through 2025 management said AI Overviews monetize at approximately the same rate as traditional search. The 2026 delivery is split. Usage delivered beyond the claim, with query growth at a five-year high and a billion AI Mode users. Monetization delivered partially: ads are live and scaling in AI Overviews, click-through on AI Mode listings is described as similar, and AI Mode's own monetization is conceded to run below core search today. Grade: half delivered, and it is the half that funds everything else.
How is the balance sheet funded and what comes back to shareholders?
| ($M) | Dec 31, 2025 | Sep 30, 2026 |
|---|---|---|
| Cash and marketable securities | 126,843 | 265,098 |
| Non-marketable securities | 68,687 | 135,230 |
| Long-term debt | 46,547 | 125,102 |
| Total assets | 595,281 | 1,003,312 |
- Alphabet raised about $147B of outside capital in nine months of 2026: $42.9B of common stock, about $19.1B of mandatory convertible preferred stock, and $85.2B of debt proceeds.
- The June 2026 equity raise alone brought $49.6B of net proceeds. A $40B at-the-market program followed, with $12.4B sold in Q3 2026 and $27.6B still available at September 30.
- Management framed the equity program around employee equity tax obligations. The scale, the first issuance program of this kind in the company's history, says more than the framing.
- Buybacks were zero in each of the first three quarters of 2026, against $39.8B in the same period of 2025, the first three-quarter pause since 2015. Fiscal 2025 buybacks were $45.7B.
- The dividend was raised 5% to $0.22 per share in Q1 2026 and held there. It is a token next to the issuance, and it was not cut.
- Commitments at September 30, 2026 totaled $924B of future purchase obligations plus $152B of pre-commencement leases and other obligations, stated by the company as maximum contractual amounts with variable pricing and volume flexibility.
- The fortress is intact on liquidity. Cash and marketable securities of $265.1B cover long-term debt of $125.1B more than twice. The direction, not the level, is what changed in 2026.
- Diluted share count rose to 12.37B in Q3 2026 from 12.20B a year earlier. For the first time in the modern era, Alphabet is a net issuer.
What is Alphabet worth by fiscal 2029?
The reference price of $279.84 pays 20.3 times forward consensus earnings, about 26 times core trailing earnings of about $10.92 excluding the marks, and 14.6 times headline trailing EPS of $19.16, a number the marks make meaningless. The honest denominator is the core line, and on it the stock trades at a market multiple for an above-market business with a below-market cash conversion year in progress. The scenarios below price fiscal 2029 three ways, segment by segment.
| Fiscal 2029 | Bear | Base | Bull |
|---|---|---|---|
| Search & other revenue ($B) | 268 | 312 | 340 |
| YouTube ads revenue ($B) | 50 | 58 | 63 |
| Google Network revenue ($B) | 23 | 26 | 29 |
| Subscriptions, platforms, and devices ($B) | 65 | 75 | 81 |
| Google Cloud revenue ($B) | 225 | 315 | 390 |
| Other Bets revenue ($B) | 2 | 3 | 6 |
| Total revenue ($B) | 633 | 789 | 909 |
| Operating margin | 25.0% | 31.0% | 34.5% |
| Net income ($B) | 140 | 212 | 274 |
| Diluted shares (B) | 12.3 | 12.0 | 11.8 |
| EPS | $11.40 | $17.70 | $23.20 |
| Exit multiple | 13x | 22x | 25x |
| Scenario value | $150 | $390 | $580 |
The bear case, $150
- AI Mode mix keeps diluting Search monetization, and Search growth slows to low single digits, reaching only $268B by fiscal 2029.
- Cloud growth decays fast as the 2026 capacity wave is absorbed, printing about $225B in fiscal 2029 with price competition from AWS and Azure compressing margins.
- Capex stays above $200B a year through 2028 and depreciation drags consolidated operating margin to 25%.
- The investment book gives back part of the 2026 marks, and regulators on appeal win restrictions on default-placement economics.
- The bear case is a digestion and de-rating case. The business still earns $140B. It is worth about half the reference price at 13 times.
The base case, $390
- Search compounds at high single digits through the transition as AI Mode monetization closes most of the gap to core search, reaching $312B.
- Cloud follows the backlog: about $175B in fiscal 2027, $245B in fiscal 2028 and $315B in fiscal 2029, as growth decays from 103% to the high twenties and TPU systems become a durable second engine.
- Subscriptions compound at low double digits to $75B on the 350 million subscriber base and Gemini bundling.
- Operating margin holds at 31% as Cloud mix gains offset depreciation, and buybacks resume once capex growth flattens, taking the share count to 12.0B.
- The skeptic case stands beside this base. It says the capex supercycle repeats the telecom buildout of 1999, that AI Mode cannibalizes the ad load funding it, that Anthropic is a circular customer whose spend is partly Alphabet's own capital returning, and that the marks reverse. Section 13 prices those claims.
- Our answer is the backlog and the usage data. $561B of contracted revenue and five-year-high query growth are not narrative. The base case can miss Cloud by a fifth and still clear the reference price.
The bull case, $580
- Search re-accelerates as AI Mode formats monetize at parity and query growth compounds, reaching $340B.
- Cloud reaches $390B as TPU systems take share from merchant silicon across the industry and the 8t and 8i generation ships on time.
- Waymo scales to real revenue inside Other Bets at $6B, and the Anthropic stake lists at a value the market can see.
- Operating margin expands to 34.5% on Cloud operating leverage, and the market pays 25 times for the cleanest AI platform P&L in the industry.
What could break the story?
The first risk is capital intensity without a guided exit. Alphabet will spend about $200B on capex in fiscal 2026, has promised significantly more in 2027 without a figure, and carries $924B of purchase commitments. Every prior cycle of this kind, from railroads to telecom fiber, ended with capacity arriving faster than demand for a period. The backlog argues this time is contracted rather than speculative, and bridging capacity in the Q3 numbers shows the strain is already real at the margin. If AI demand growth slows to merely fast, the depreciation wall of 2027 and 2028 lands on a P&L whose management has given no recovery date to be graded against.
The second risk is the monetization gap becoming structural. AI Mode is the fastest-growing surface in Search history and it monetizes below core search today, by management's own statement. If answer formats keep taking query share while converting at a discount, Search can grow queries and shrink revenue quality at the same time. The 19% to 17% to 12% growth path in 2026 is partly explained by currency and laps, and partly by exactly this mix effect. Two more quarters of deceleration would move it from explanation to trend.
The third risk is the regulatory stack. The search remedies judgment is behavioral rather than structural, and it is on appeal in both directions: Alphabet wants the data-sharing and exclusivity provisions narrowed, the government wants more. Oral argument could come as early as December 2026. Europe has already converted one case into a $5.2B cash payment in Q3 2026, and DMA and app store proceedings continue. No analyst raised any of it on the Q3 call, which says more about the quarter than about the exposure.
The fourth risk is the circularity at the center of the AI economy, with Alphabet on every side of it. Anthropic is simultaneously an investee carried in the $135.2B book, the largest external TPU customer, a $114.5B committed Cloud spender, and Gemini's closest competitor. If Anthropic's valuation or spending falters, Alphabet takes the mark, loses the backlog conversion, and weakens the Cloud growth rate in the same quarter. The SpaceX mark showed the mechanism in miniature in Q3 2026, on the way down as well as up.
- Customer concentration inside the Cloud ramp is rising, with a handful of AI buyers driving the backlog's growth rate.
- Dual-class control means public holders cannot force a capital discipline debate, however the spending performs.
- Key-person risk is diffuse but real: the AI program runs through a small group across DeepMind, Cloud and infrastructure.
- The equity issuance that funded 2026 dilutes the per-share compounding the buyback built for a decade, if it becomes a habit rather than a bridge.
Where does the stock sit today?
- Reference price is the Friday October 30, 2026 close of $279.84, the price carried in the DalalBytes Compute Price Reset valuation table of November 1, 2026.
- The stock closed Q3 earnings day, October 28, at $324.89, fell 8.6% after hours to $297.02, and then fell with the sector through October 29 and 30, when reporting counts over $1 trillion of technology market value erased.
- The 52-week intraday range runs from $266.50 to $408.61, with the high set on May 18, 2026. The reference price sits about 31% below that high and about 5% above the low.
- On the October 28 basis the price trades below its 50-day average of $341.51 and its 200-day average of $341.20, with RSI (14) at 38.7. The trend is broken near term, whatever the fundamentals say.
- The technical picture is a de-rating in progress. The fundamental picture in sections 4 and 10 is a backlog doubling into that de-rating.
- Q4 2026 results are the next hard checkpoint, expected in early February 2027 with the fiscal 2027 capex figure promised on the call. The date is not yet company-announced.
Frequently asked questions
Why do Alphabet's reported earnings swing so much?
Alphabet carries its private investments at fair value through the income statement. The book reached $135.2B by September 2026. It added a $99B gain and $6.26 of EPS in Q2 2026, then an $8.66B loss and $0.55 of EPS in Q3. Core EPS was $2.85 and about $2.67 in those quarters.
How does Google Cloud stack up against AWS and Azure?
In the September 2026 quarter Google Cloud delivered $30.71B of revenue, up 103%, at a 36.2% operating margin, against AWS at $45.98B, up 39.3% at 38.7%, and Azure at $33.17B, up 48% in constant currency. Cloud backlog of $561B nearly matches the AWS backlog of $578B.
When does free cash flow turn positive again?
Management has not given a date. The fiscal 2026 capex guide is $195B to $205B, fiscal 2027 capex will increase significantly, and the figure arrives on the Q4 call. The offset is contracted demand. Just over 55% of the $561B backlog converts to revenue within 24 months.
Sources and disclosures
- Alphabet Form 10-K for fiscal 2025, filed February 5, 2026, for segment history, revenue by type, the $242.8B revenue backlog and the consolidated statements.
- Alphabet Forms 10-Q for Q1, Q2 and Q3 2026, for quarterly balance sheets, equity issuance and commitments.
- Alphabet earnings releases for Q4 2025, Q1 2026, Q2 2026 and Q3 2026, furnished on Form 8-K, for segment revenue, segment operating income, cash flow and the equity securities effects.
- Alphabet Q3 2026 earnings call of October 28, 2026, via the official investor relations stream, for backlog composition, Search monetization commentary and the fiscal 2027 capex framing.
- Anthropic S-1 registration statement, filed publicly October 26, 2026, for the Google Cloud commitment through 2033 and shareholder disclosure.
- Broadcom disclosures of April and September 2026 for the five-year TPU design agreement and TPU 8i production shipments, and Google Cloud Next 2026 materials for the TPU 8t and 8i specifications.
- StatCounter global search share, September 2026; Artificial Analysis Intelligence Index v5.0, October 2026; SemiAnalysis Ironwood cost analysis, February 2026; Mizuho and Morgan Stanley estimates as labeled in the text.
- The DalalBytes landscape pieces, The Compute Share Wars and The Compute Price Reset, published November 1, 2026, for the accelerator market map and the published TPU price ladder.
- Disclosures. The author is long Alphabet (GOOGL) at publication. This analysis is research and opinion for educational purposes only and is not investment advice, a recommendation, or a solicitation. Prices and estimates are as of November 2, 2026.