
What is the verdict on Enphase?
58/100. Selective Positive. The best balance sheet in residential solar, a real microinverter moat, and a stock priced for a stagnation that management's own 2027 targets say is not the plan.
What would change the score. The score rises if US sell-through grows year on year for two straight quarters with revenue excluding safe harbor above $250M a quarter and the 2027 battery target of 675 MWh tracking on plan at mid-year, and it falls if 2027 revenue tracks the Street path near $1.02B, if battery shipments land under 550 MWh, or if foreign entity rules strip Section 45X eligibility from US-made product.
| 58/100 | DalalBytes score |
| $30.42 | Reference price. November 3 2026 close |
| $4.02B | Market cap at 132.31M shares |
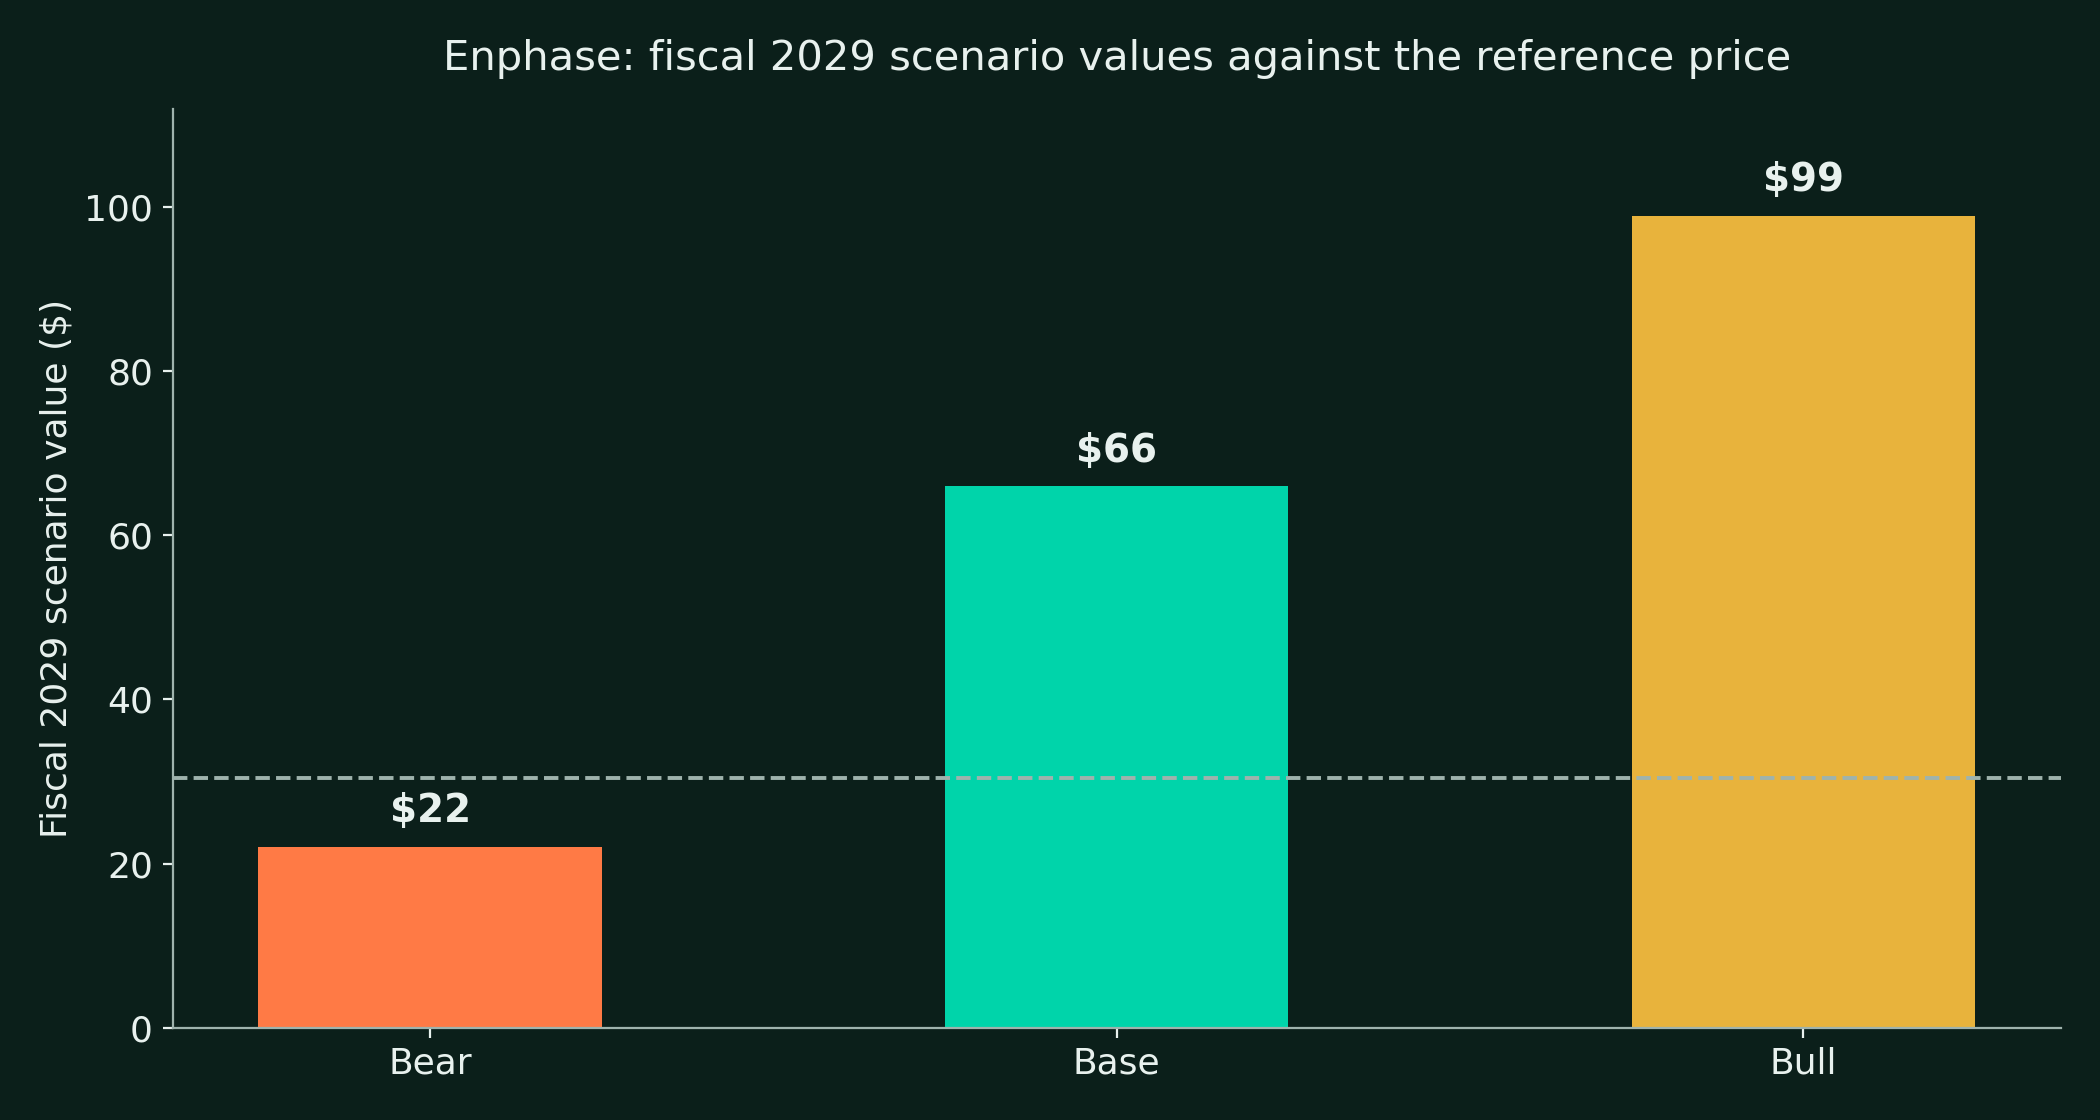
| $22 / $66 / $99 | Fiscal 2029 bear / base / bull |
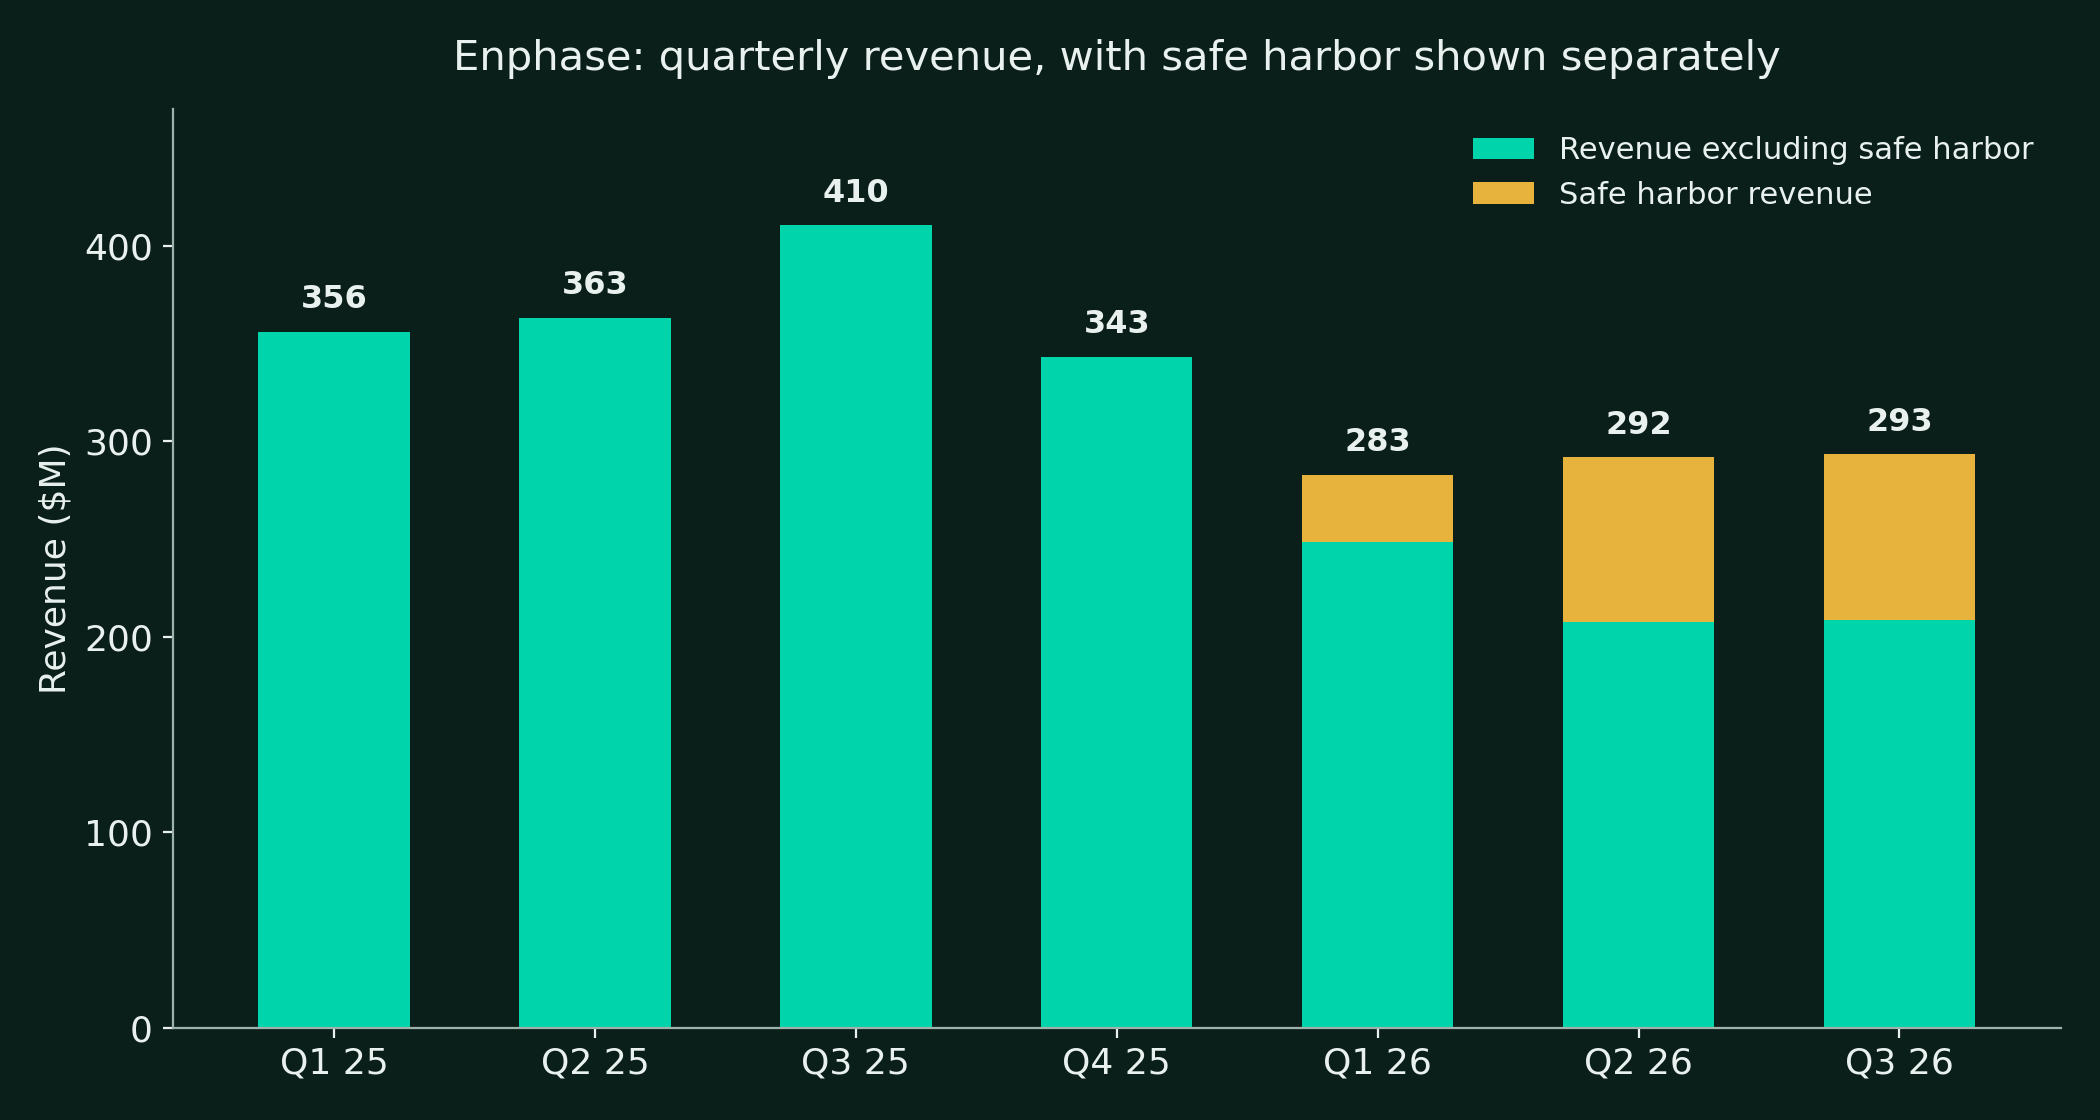
Enphase today is a fortress sitting on a trough. The trough is real and it is policy-made. The Section 25D credit that paid homeowners 30% of system cost expired on December 31, 2025, US sell-through fell 35% year on year in Q3 2026, and the Q4 guide of $225M to $255M is the weakest revenue guide since the 2023 reset. Reported revenue flatters the damage, because $85M of the Q3 print was safe harbor shipments to leasing partners, product shipped to lock in credits rather than product pulled by homeowners.
The fortress is also real. Cash and marketable securities of $931.8M stand against a single $575M zero-coupon convertible due in March 2028, the $632.5M 2026 maturity having been settled in cash in March 2026 without drama. The installed base passed 86.4M microinverters and 5.1M systems at the end of 2025, the microinverter carries a 25-year warranty no string rival matches at the panel level, and the battery line is guided from about 450 MWh in 2026 to 675 MWh in 2027.
The argument is what the recovery is worth before it prints. At $30.42 the stock sits 59% below its 52-week high and carries 22.2% short interest, a price that pays for the Street's 2027, revenue of about $1.02B and falling. Our base case pays for a normal post-cliff recovery, batteries and commercial doing the lifting, and lands at $66 by fiscal 2029. The bear case is the Street case extended, and it lands at $22. That spread, a fortress balance sheet on one side and a policy trough on the other, is the report in one paragraph.
The price basis of this report
This report uses the Tuesday November 3, 2026 Nasdaq close of $30.42 throughout, cross-checked across TipRanks, FinanceCharts, YCharts and Optionistics. Enphase has not yet announced the date of its Q4 2026 results as of November 4, 2026. The company's recent cadence points to late January or early February 2027, and that window is an estimate, not a company-confirmed date.
What is Enphase in one page?
Enphase Energy is based in Fremont, California, and trades on Nasdaq as ENPH. The company was founded in 2006 and built its name on a single architectural bet: put a small inverter under every solar panel instead of one large inverter on the wall. That bet made it the defining equipment company of the US residential solar era, with cumulative shipments past 86.4M microinverters and more than 5.1M Enphase systems deployed through December 2025.
The platform has widened in rings around that core. IQ Batteries store the power the panels make. The IQ System Controller and IQ Meter Collar manage backup and the grid connection. The IQ EV Charger 2 charges the car. The Enlighten platform monitors every system and produces the services revenue that arrives over time rather than at shipment. The newest ring is the strangest: an IQ Solid-State Transformer that converts medium-voltage AC directly to 800 volt DC for AI data centers, covered in section 6.
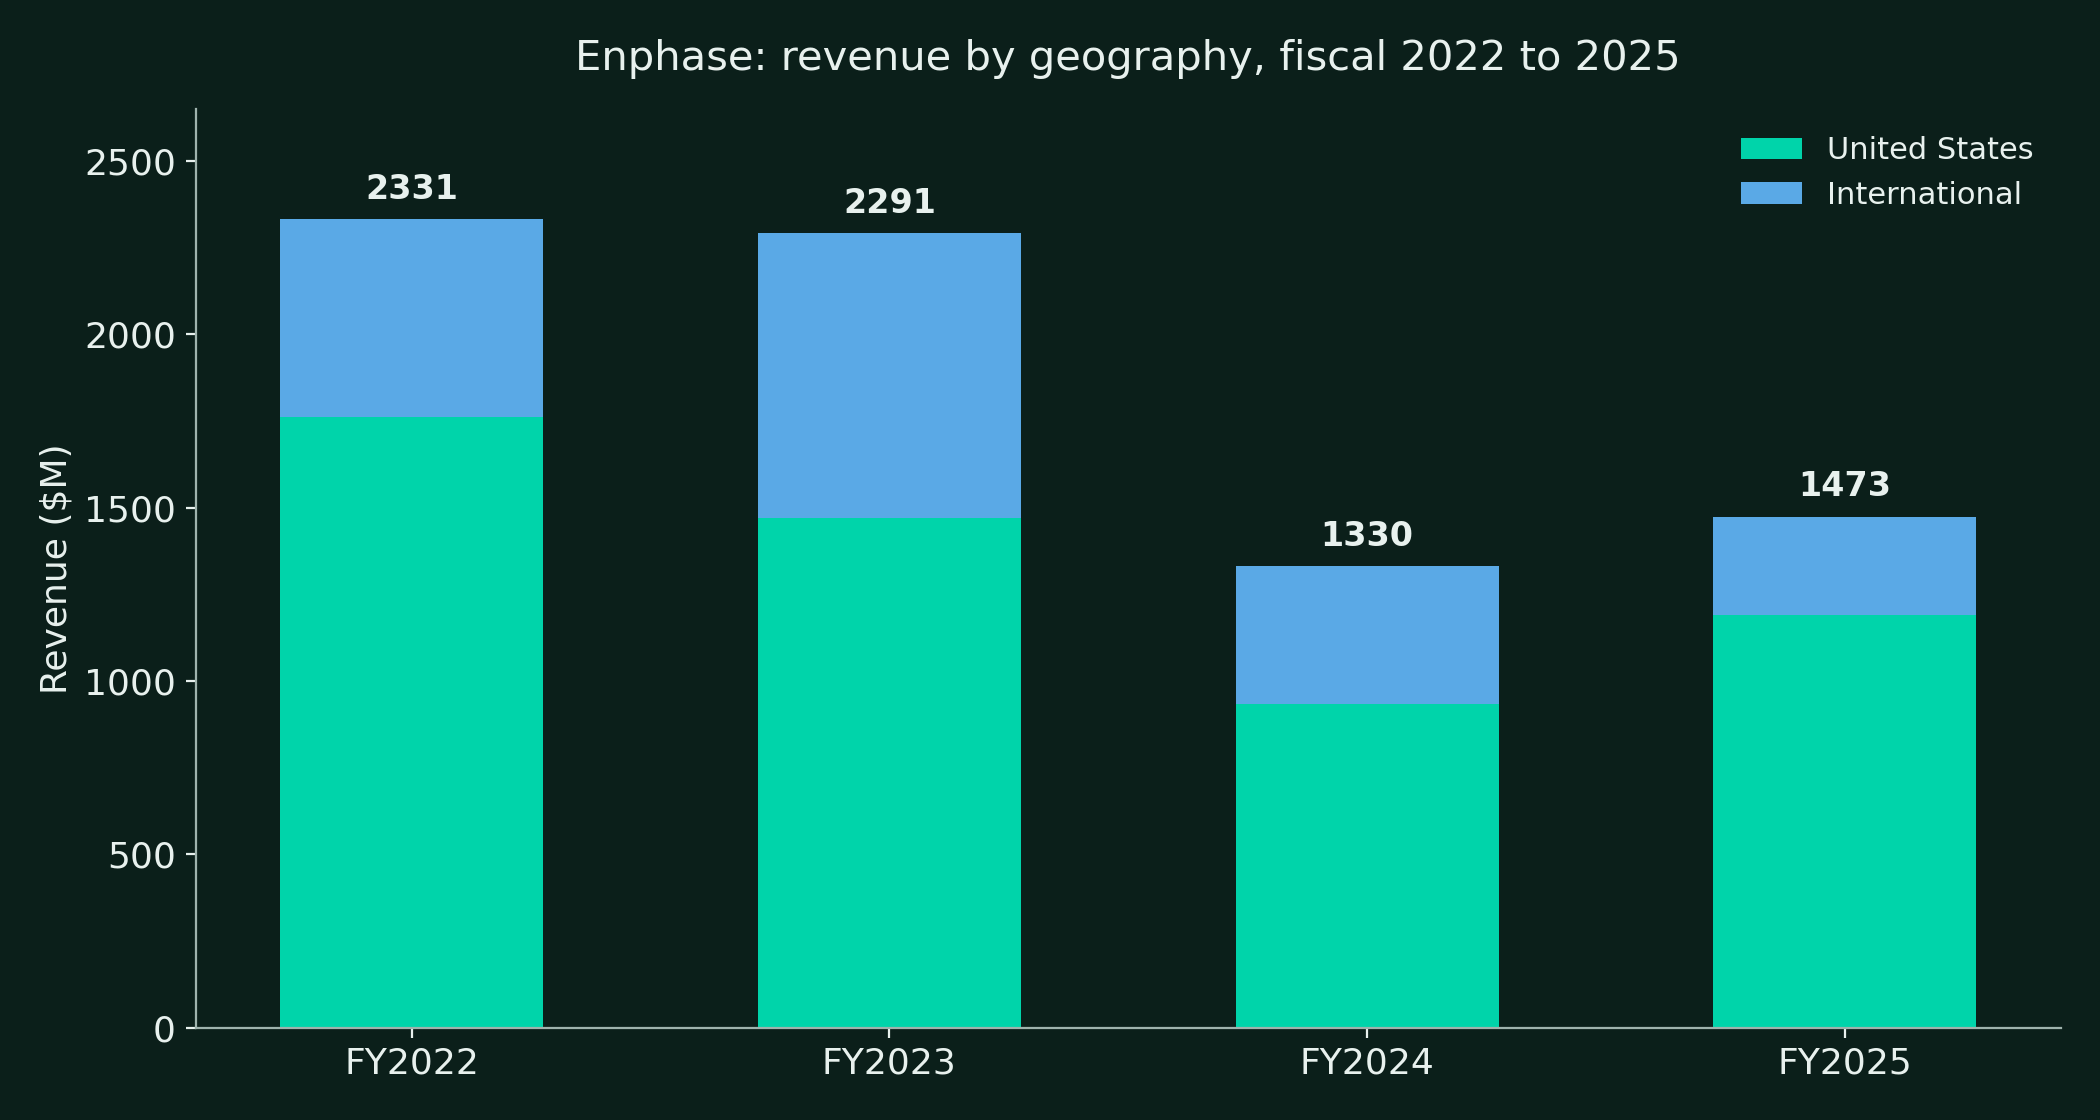
The story of the last four years is a boom, a reset and a policy cliff in sequence. Revenue peaked at $2.33B in 2022 when California's net metering deadline pulled demand forward, fell to $1.33B in 2024 as higher rates and the new California billing regime bit, and recovered to $1.47B in 2025. In 2026 the expiration of the homeowner tax credit cut the other way, and trailing twelve-month revenue is back to $1.21B. Section 4 decomposes that cliff, and section 10 grades how management navigated it in public.
| Metric | FY2024 | FY2025 | Q3 2026 |
|---|---|---|---|
| Total revenue ($M) | 1,330 | 1,473 | 293 |
| United States revenue ($M) | 935 | 1,189 | n.d. |
| International revenue ($M) | 396 | 284 | n.d. |
| GAAP net income ($M) | 103 | 172 | 23 |
| GAAP diluted EPS | $0.75 | $1.29 | $0.17 |
| Free cash flow ($M) | 480 | 96 | -11 |
- Fiscal 2025 revenue grew 10.7% to $1.47B.
- The United States was 81% of fiscal 2025 revenue.
- Q3 2026 revenue fell 28.5% year on year as the credit cliff hit.
- Trailing twelve-month revenue through Q3 2026 is $1.21B.
- Q4 2026 revenue is guided to $225M to $255M, which puts fiscal 2026 near $1.11B at the midpoint.
- The next hard checkpoint is the Q4 2026 print, whose date is not yet company-announced.
How does Enphase make money?
Enphase reports one operating segment and one product line. The filings disaggregate revenue only by geography and by timing of recognition, so there is no reported revenue split between microinverters, batteries and services. Any product split in print elsewhere is an estimate. What the filings do give is shipment volume by product, geography by year, and a services stream that can be measured through the timing split. This report uses exactly those, and labels everything else as channel evidence.
| Revenue ($M) | FY2022 | FY2023 | FY2024 | FY2025 |
|---|---|---|---|---|
| United States | 1,762 | 1,469 | 935 | 1,189 |
| International | 569 | 822 | 396 | 284 |
| Total | 2,331 | 2,291 | 1,330 | 1,473 |
| US share | 76% | 64% | 70% | 81% |
The timing split, the services tell
- In Q1 2026, $254.0M of revenue was recognized at a point in time and $28.9M over time, per the Form 10-Q revenue note.
- The over-time stream, about 10% of revenue, is Enlighten monitoring, extended services and deferred product arrangements.
- Deferred revenue on the balance sheet was $518.4M at December 31, 2025 and $582.5M at June 30, 2026.
- Remaining performance obligations at March 31, 2026 totaled $470.6M, scheduled through 2030 and beyond.
- That deferred stack is the quiet annuity under a hardware business, and it is why revenue quality is better than the headline suggests.
Volume is the product split the filings allow
| Shipments | FY2024 | FY2025 | Q1 2026 | Q2 2026 | Q3 2026 |
|---|---|---|---|---|---|
| IQ Microinverters (M units) | n.d. | n.d. | 1.41 | 1.59 | 1.42 |
| Microinverter capacity (MWdc) | n.d. | about 2,800 | n.d. | 725.2 | 655.2 |
| IQ Batteries (MWh) | 521.0 | 706.1 | 103.0 | 113.8 | 129.9 |
- Battery volume grew 36% in fiscal 2025 to 706.1 MWh while microinverter wattage was essentially flat at about 2.8 GWdc.
- Battery volume then halved on the credit cliff, running at about 450 MWh for fiscal 2026 on the Q4 guide.
- Q3 2026 microinverter volume of 655.2 MWdc fell 16% year on year from 784.6 MWdc.
- Mix is the margin story. Gross profit per microinverter excluding the Section 45X credit was $48.24 in Q3 2026 against $72.66 a year earlier, calculated from the Form 10-Q.
Concentration, in the company's own words
- One customer accounted for 39% of net revenues in fiscal 2025, down from 48% in fiscal 2024, per the Form 10-K.
- The filing does not name that customer.
- Sales run through distributors and installers, so the concentration is a channel fact as much as a customer fact.
- Section 5 maps the channel that concentration runs through.
What broke US residential solar demand?
US residential solar demand runs on three fuels: the federal tax credit, the price of grid power under state net metering rules, and the interest rate on the loan or lease that finances the system. All three turned against the industry inside eighteen months, and Enphase's revenue is the cleanest public record of the damage.
The 25D cliff, quantified
- The Section 25D residential clean energy credit paid homeowners 30% of system cost for cash and loan purchases.
- The One Big Beautiful Bill Act, enacted in July 2025, ended it for expenditures after December 31, 2025.
- Installers rushed completions into Q4 2025. US sell-through rose 21% sequentially that quarter, its best reading in over two years.
- The payback arrived in 2026. US sell-through fell 35% year on year in Q3 2026, and management names the credit expiry and high rates as the causes.
- SEIA and Wood Mackenzie put US residential installations at 4,647 MWdc in 2025, down 2%, and expect a contraction of about 19% in 2026.
- Q2 2026 residential installations were 995 MWdc, down 12% year on year, and residential storage additions fell 27% year on year in MWh.
- The Federal Reserve held the funds rate at 3.75% to 4.00% on October 28, 2026, a hawkish hold, with the ten-year Treasury near 4.93%. Loan-financed solar economics stay tight at those levels.
- California's NEM 3.0 net billing regime, in force since 2023, already covers most California installs and pushed battery attach rates up even as it cut solar-only paybacks.
Sell-through is the number that matters
- Sell-through measures product pulled from distributors by installers, the closest public proxy for end demand.
- In Q3 2026 global sell-through rose 1% sequentially against management's expectation of 10%.
- US sell-through rose 5% sequentially but fell 35% year on year.
- European sell-through fell 12% sequentially on seasonality and softness in France.
- The Q4 2026 guide assumes global sell-through falls a further 10% sequentially to about $210M.
- On that assumption the underlying business runs near $200M of quarterly demand against a $293M reported Q3 print.
Safe harbor, the bridge and the mask
- Third-party ownership partners, the lease and PPA companies, can still claim commercial credits under Section 48E over a longer phase-out window.
- Those partners safe harbored equipment in 2026 to lock eligibility, and Enphase shipped against those arrangements.
- The Form 10-Q discloses about $1.081B of product arrangements executed during 2026 through the safe harbor deadline, split $202.4M under the 5% investment credit method and $878.6M under the physical-work method.
- Deliveries and revenue recognition on that book may extend through Q2 2031.
- Safe harbor revenue inside reported revenue was $34.5M in Q1 2026, $84.3M in Q2 and $85.0M in Q3, with about $51.2M guided for Q4.
- The $1.081B is not cash received and not revenue earned. It is a shipment runway whose pace the partners control.
- Management also guided to about $20M of deliberate under-shipment in Q4 2026 to drain distributor inventory, an honest signal that the channel is overstocked.
The offset already visible in the data
- Battery attach keeps rising through the cliff. Berkeley Lab data puts storage on 37% of US residential installs in 2025, up from 25% in 2024.
- Storage is the part of the system the post-credit market still pays for, because backup and time-of-use savings do not depend on the homeowner credit.
- That attach trend is the factual spine of the recovery case in section 12.
Who sells and installs Enphase systems?
Enphase does not sell to homeowners. It sells to distributors, who sell to installers, who sell the system. The bench below is where the moat is either defended or lost, because the installer chooses the equipment on most roofs.
Distributors and the concentration line
- One unnamed customer was 39% of fiscal 2025 net revenue, per the Form 10-K, down from 48% in fiscal 2024.
- The large US solar distributors carry Enphase as their premium microinverter line, and the channel was deliberately over-shipped into safe harbor in 2026.
- The Q4 2026 under-shipment guide is the correction, and it lands on distributor inventory first.
Installers, the actual sales force
- Enphase sells through a certified installer network built over a decade, trained on the IQ platform and the Enlighten software.
- The installer economics favor Enphase on labor. A microinverter system has no separate string inverter to mount and wire, and panel-level monitoring cuts truck rolls.
- The counterweight is price. Microinverter systems carry a hardware premium per watt over string and optimizer systems, which matters more in a post-credit market.
Third-party ownership, the channel that now carries demand
- Lease and PPA partners can still monetize the commercial credit that homeowners lost, so demand is migrating to their channel.
- Safe harbor arrangements of $1.081B were executed with these partners during 2026, per the Form 10-Q.
- The Propel prepaid lease program is Enphase's own answer, live in 13 states with more than 350 installers and a 71% battery attach rate.
- Management expects equipment revenue from Propel originations to begin in the first half of 2027.
- A 71% attach rate on Propel against a 37% industry attach rate shows what the TPO channel does to battery volume when the financing is bundled.
Partnerships named in the record
- Infineon and Enphase announced a 900 volt GaN bidirectional switch device designed for the IQ Solid-State Transformer.
- Three global auto OEM partnerships sit behind the bidirectional EV charging revenue targeted at $15M to $20M in 2027.
- The IQ Meter Collar had approvals from 39 US utilities by Q3 2025, each approval a small regulatory moat brick.
- No material channel partner loss to a rival was disclosed in the past year. The risk is slower, installer-level drift toward cheaper hardware, and it shows up in sell-through before it shows up in announcements.
What are Enphase's second engines?
Batteries, the engine that has to fire
- IQ Battery shipments were 706.1 MWh in fiscal 2025, then fell to a run rate near 450 MWh in 2026 on the credit cliff.
- Management targets about 675 MWh in 2027, up 50%, a target set on the Q3 2026 earnings call.
- The fourth-generation IQ Battery 10C was 40% of US battery shipments in Q3 2025. The fifth generation battery and a commercial IQ Battery C80 are named 2027 drivers.
- The IQ Battery 5P carries 5.0 kWh and 3.84 kW per unit, and the 10C carries 10.0 kWh and 7.08 kW, both with 15-year warranties.
- Battery cells are the exposed input. The Form 10-K discloses LFP cells sourced entirely from two vendors in China, which collides with the foreign entity rules covered in section 13.
Commercial, small today and guided to triple
- Commercial revenue runs at about $30M in 2026 and is guided above $100M in 2027.
- The vehicle is the IQ9N-3P, a GaN-based three-phase microinverter for 480Y/277V commercial grids, US-made and marketed as compliant with the foreign entity rules.
- Commercial shipments of the IQ9N-3P began in Q4 2025, on plan.
- Small commercial storage is the second leg, which is why the C80 battery matters to the same target.
EV charging and the rest of the ring
- Bidirectional EV charging revenue is targeted at $15M to $20M in 2027, with management pointing to potential above $100M as the three auto OEM partnerships ramp.
- The IQ EV Charger 2 and the European IQ Balcony Solar Kit launched in 2025 and are volume footnotes today.
- None of these lines is large enough to grade the company on. Together they decide whether 2027 is a recovery or a plateau.
The IQ Solid-State Transformer, the option
- The IQ SST converts medium-voltage AC, 13.8 kV to 34.5 kV, directly to 800 volt DC, the distribution voltage AI data centers are standardizing on.
- On September 8, 2026 the company said 4 kW power modules were being built at its Arlington, Texas line to assemble and validate full-scale racks that scale to about 5 MW.
- On October 27, 2026 it demonstrated 13.8 kV AC to 800 volt DC conversion at its Austin lab with 132 modules, holding output through AI-style load steps. Modules are now rated 5.5 kW on GaN switching, the fifth-generation Kestrel ASIC and in-house magnetics, with efficiency claimed at 98.5%.
- The pipeline of customers and partners more than doubled in Q3 2026 to over 50, and the company says it is working with a leading hyperscaler and a global AI computing company on technical requirements.
- The milestones management has set are 34.5 kV validation and a megawatt-scale full-system demonstration by the end of 2026, customer pilots in 2027 and commercial shipments from 2028.
- The skeptic frame belongs here too. Independent estimates put the entire solid-state transformer market near $40M in 2025 growing to about $570M by 2034, rival Amperesand targets 30 MW of commercial deployments in 2026 with first units shipping this year, and Enphase has no named SST customer and no booked order.
- Our base case prices the SST at zero through fiscal 2029. The bull case is where it lives.
How strong is the moat?
The moat is the distance between a panel-level architecture and everything else on the roof. A microinverter under every panel means no single point of failure, no high-voltage DC run across the roof, panel-level monitoring on every module, and a 25-year warranty that matches the life of the panels themselves. A string inverter is a 12-year box in a 25-year system, and every installer who has replaced one on a customer's roof understands what that difference is worth in truck rolls and in reputation.
The second wall is the installed base as a data and service asset. More than 5.1M systems report into Enlighten, which produces the over-time revenue stream of section 3, the fleet data that trains failure prediction, and the homeowner relationship that makes the battery and the EV charger natural second sales into the same house. Storage attach rising from 25% to 37% of installs runs disproportionately through ecosystems the homeowner already has an app for.
The third wall is manufacturing policy turned into margin. US production through contract partners in Texas and South Carolina earns the Section 45X credit of $0.11 per watt of AC capacity on every US-made microinverter sold, worth $238.7M in fiscal 2025. A rival importing finished inverters cannot replicate that credit, and the foreign entity and FCC rules tightening around imported grid-connected inverters in 2026 raise the wall further.
- The IQ8 microinverter lists 97.7% peak efficiency and 97.0% to 97.5% CEC weighted efficiency, against 99% CEC for the SolarEdge Home Hub inverter, the one spec where the string architecture genuinely leads.
- The warranty comparison reverses that lead. Enphase microinverters carry 25 years at the panel, SolarEdge optimizers carry 25 years but its inverter carries 12 years standard, and Tesla's Powerwall 3 carries 10 years.
- Enphase batteries carry 15-year warranties against 10 years for the Powerwall 3 and the SolarEdge Home Battery.
- Counter-evidence sits in section 8. SolarEdge recognized 388 MWh of battery shipments in Q3 2026 against Enphase's 129.9 MWh shipped, and Tesla's Powerwall owns the single-unit capacity mindshare at 13.5 kWh.
- The moat is strongest where the system is designed in from the start, and weakest in retrofit storage, where FranklinWH's inverter-agnostic aPower 2 attacks exactly the installed base Enphase does not own.
Who competes with Enphase and on what numbers?
| Player | Latest quarter | Revenue | Gross margin | The read |
|---|---|---|---|---|
| Enphase | Q3 2026 | $293.3M | 45.0% non-GAAP | Down 28.5% year on year on the credit cliff |
| SolarEdge | Q3 2026 | $326.1M | 34.7% non-GAAP | Down 4.1% year on year, margins rebuilding from a lower base |
| Tesla Energy | Q3 2026 | $2,881M | 33.1% | Mostly Megapack utility storage, not residential |
| FranklinWH | Private | Not disclosed | Not disclosed | The retrofit storage specialist |
| Generac | Q3 2026 | Not broken out | Not broken out | Clean energy is a small line inside a generator company |
SolarEdge, the mirror rival
- SolarEdge reported Q3 2026 revenue of $326.1M on November 4, 2026, down 4.1% year on year, at the midpoint of its guide.
- Its GAAP gross margin was 33.2% including a $36.0M benefit from IEEPA tariff matters. Excluding that benefit the margin calculates to about 22%.
- Non-GAAP gross margin was 34.7%, non-GAAP EPS was positive $0.29, and free cash flow was positive for a fifth straight quarter at $7.8M.
- Cash and investments net of debt were $260.9M, against Enphase's net cash position of roughly $320M to $360M on a larger liquidity pile.
- SolarEdge recognized 388 MWh of battery shipments as revenue in the quarter, roughly triple Enphase's 129.9 MWh shipped, on a different recognition basis.
- Its Q4 2026 guide is revenue of $245M to $275M and non-GAAP gross margin of 17% to 21% excluding potential refunds, a weaker guide than Enphase's on both lines.
- The architectural contest is unchanged. SolarEdge wins inverter efficiency at 99% CEC, and Enphase wins warranty structure and the absence of a central box.
Tesla, the storage gravity well
- Tesla Energy deployed 13.7 GWh of storage in Q3 2026, up 10% year on year, and produced $2,881M of segment revenue, down 16% on price.
- The bulk is Megapack utility storage. The residential overlap is the Powerwall line only.
- The Powerwall 3 carries 13.5 kWh and 11.5 kW continuous output, and Berkeley Lab's finding that the median US residential battery installed in 2025 was exactly 13.5 kWh tells you whose unit defines the category.
- Tesla's weapon is price per kWh and brand. EnergySage marketplace data puts the Powerwall 3 near $998 per kWh installed against about $1,177 for the FranklinWH aPower 2.
- Enphase's counter is the 15-year battery warranty against Tesla's 10 years, and an installer channel Tesla does not match.
The spec table where the products actually compete
| Spec | Enphase IQ Battery 10C | Tesla Powerwall 3 | FranklinWH aPower 2 | Generac PWRcell 2 |
|---|---|---|---|---|
| Usable capacity | 10.0 kWh | 13.5 kWh | 15.0 kWh | 9 to 18 kWh modular |
| Continuous power | 7.08 kW | 11.5 kW | 10.0 kW | 9.0 kW |
| Chemistry | LFP | LFP | LFP | NMC |
| Warranty | 15 years | 10 years | 15 years | 10 years |
| Coupling | AC, Enphase systems | Integrated inverter | AC, any inverter | Integrated |
- FranklinWH's aPower 2 is the retrofit threat. It is AC-coupled and inverter-agnostic, carries 15 kWh and 10 kW per unit, integrates generators, and stacks to 15 units behind one aGate controller.
- Generac's PWRcell 2 competes on the dealer network of a generator incumbent, with NMC chemistry and a 10-year warranty that trail the LFP field.
- APsystems and Hoymiles attack the microinverter itself on price, at lower cost per watt with 10 to 25 year warranties, and their US ceiling is set by tariffs and the 2026 FCC authorization rules on foreign-produced inverters rather than by product quality.
- Chinese hybrid inverter brands such as Sungrow and Huawei are formidable in Europe and Australia and structurally constrained in the US by the same rules.
- The honest summary is that Enphase owns the premium new-install ecosystem, Tesla owns storage mindshare and price, FranklinWH owns retrofit, and SolarEdge is rebuilding. Share will be decided installer by installer.
What do the financial statements show?
| Fiscal year ($M) | FY2022 | FY2023 | FY2024 | FY2025 | TTM Sep 2026 |
|---|---|---|---|---|---|
| Revenue | 2,331 | 2,291 | 1,330 | 1,473 | 1,211 |
| GAAP net income | 397 | 439 | 103 | 172 | 91 |
| GAAP diluted EPS | $2.77 | $3.08 | $0.75 | $1.29 | $0.68 |
| Operating income | 453 | 461 | 91 | 165 | 11 |
| Operating cash flow | 745 | 697 | 514 | 137 | 191 |
| Capital expenditure | 47 | 110 | 34 | 41 | n.d. |
| Free cash flow | 698 | 586 | 480 | 96 | 135 |
- The earnings collapse is a revenue story, not a cost story. Operating income fell from $461M in fiscal 2023 to $11M on a trailing basis because volume halved.
- Fiscal 2025 GAAP gross margin was 46.6%, down from 47.3% in fiscal 2024, per the Form 10-K reporting.
- Inside that margin sits the Section 45X credit, $238.7M in fiscal 2025 contributing 16.2 points of gross margin, after about $157M and 11.8 points in fiscal 2024.
- Excluding the credit, fiscal 2025 gross margin calculates to about 30.4%.
- Fiscal 2025 operating cash flow fell 73% to $137M on a $123M inventory build and $243M of prepaid income taxes, the two working capital decisions that broke the cash pillar.
- Non-GAAP EPS was $2.96 in fiscal 2025 against $2.37 in fiscal 2024, a reminder that the GAAP lines carry restructuring and impairment noise the operations do not.
- Stock compensation remains the honest deduction. It ran $92.5M in the first half of 2026 against $109.5M in the first half of 2025.
The 2026 quarters, with the one-offs named
| Quarter | Revenue ($M) | Safe harbor ($M) | GAAP gross margin | Non-GAAP gross margin | GAAP EPS | Non-GAAP EPS |
|---|---|---|---|---|---|---|
| Q1 2026 | 282.9 | 34.5 | 35.5% | 43.9% | -$0.06 | $0.47 |
| Q2 2026 | 291.9 | 84.3 | 60.0% | 46.8% | $0.27 | $0.46 |
| Q3 2026 | 293.3 | 85.0 | 43.3% | 45.0% | $0.17 | $0.41 |
| Q4 2026 guide | 225 to 255 | about 51.2 | 38% to 41% | 40% to 43% | n.d. | n.d. |
- Q1 2026 GAAP gross margin of 35.5% carries the accounting of the credit sale. The company sold $235.0M of its 2025 manufacturing credits at 93% of face in March 2026 and recorded a net AMPTC benefit of $35.7M against $59.8M generated.
- Q2 2026 GAAP gross margin of 60.0% carries a $45.4M customs refund worth 15.6 points. The non-GAAP line, which excludes it, is the honest trend.
- Q3 2026 GAAP net income of $23.4M exists because of a roughly $27.0M income tax benefit against a pretax loss of about $3.6M, per the Form 10-Q.
- Q3 2026 non-GAAP EPS of $0.41 includes a $0.14 per share investment impairment that was not excluded, so operating EPS was about $0.55.
- Reciprocal tariff drag on gross margin has faded through the year, about 4.3 points in Q1, about 2.0 in Q2, 1.3 in Q3 and about 2 guided for Q4.
- Q3 2026 operating cash flow was about $0.1M and free cash flow about negative $11.4M, the weakest cash quarter of the cycle.
Has management delivered what it promised?
The fair test of this management team is whether the targets it sets in public arrive. Through 2025 the record was strong: guidance ranges were met or beaten, the IQ9N-3P commercial microinverter shipped on plan in Q4 2025, and US sell-through into the credit deadline was honestly flagged as pull-forward while it was happening. The 2026 record is weaker, and the weakness is specific. The Q3 2026 quarter missed its demand expectation, not its cost lines: revenue landed at the low end of the guide, the battery guide landed a fraction below its range, and sell-through grew 1% against an expectation of 10% that management itself had set.
The forward targets are a different category of claim. The 2027 frame, batteries at 675 MWh, commercial above $100M, EV charging at $15M to $20M and Propel revenue from the first half of the year, is decomposable and checkable quarter by quarter. The SST program is the opposite, a sequence of demonstrations whose commercial value rests on pilots that have not been awarded. The audit posture of this report is to bank the decomposable targets at a discount and the demonstrations at zero.
| Commitment | Set when | Status at November 4, 2026 |
|---|---|---|
| Q1 2026 revenue of $270M to $300M | January 2026 guide | Delivered $282.9M. Met |
| Q1 2026 batteries of 100 to 120 MWh | January 2026 guide | Delivered 103 MWh. Met |
| Q1 2026 non-GAAP gross margin of 42% to 45% | January 2026 guide | Delivered 43.9%. Met |
| Q1 2026 GAAP gross margin of 40% to 43% | January 2026 guide | Printed 35.5% on the credit-sale accounting. Missed on presentation |
| Q3 2026 revenue of $290M to $320M | July 2026 guide | Delivered $293.3M. Met at the low end |
| Q3 2026 batteries of 130 to 150 MWh | July 2026 guide | Delivered 129.9 MWh. Missed by a fraction |
| Q3 2026 global sell-through growth of 10% | Management expectation | Delivered 1%. Missed |
| IQ9N-3P commercial shipments begin | 2025 product plan | Began Q4 2025. Delivered |
| IQ SST demonstrates 13.8 kV to 800 volt DC | September 2026 plan | Demonstrated October 27, 2026. Delivered |
| IQ SST 34.5 kV validation and MW-scale demo | By end of 2026 | Pending. Weeks remain |
| 2027 batteries of about 675 MWh | October 2026 call | Pending. Decomposed in section 12 |
| 2027 commercial revenue above $100M | October 2026 call | Pending |
| Propel equipment revenue begins | First half of 2027 | Pending |
| IQ SST customer pilots, then shipments | 2027, then 2028 | Pending. No named customer |
- The guidance pattern is worth naming. Ranges get met on the lines management controls and missed on the demand line it does not.
- The February 2026 restructuring, about 160 roles or 6% of the workforce, was the cost response to the cliff and was disclosed with the Q4 2025 results.
- The 2027 targets were set on the Q3 2026 call, after the miss was known, which makes them post-reset targets rather than hope carried forward.
- The burden of proof now sits on sell-through, the one series that has missed twice.
How is the balance sheet funded and what comes back to shareholders?
| Item | Value | As of |
|---|---|---|
| Cash and marketable securities | $931.8M | September 30, 2026 |
| Convertible notes due 2028 | $575M face, 0% coupon | Carrying value $572.8M at June 30, 2026 |
| Fair value of the 2028 notes | $534.75M | June 30, 2026 |
| Total debt including leases | about $614.6M | September 2026 |
| Net cash | about $320M to $360M | September 2026 |
| Warranty obligations | $204.2M | March 31, 2026 |
| Shares outstanding | 132.31M | November 3, 2026 |
- The $632.5M of zero-coupon converts due March 2026 were settled in full for cash at maturity on March 1, 2026.
- Cash and securities moved from $1,512.9M at December 2025 to $930.6M after that settlement, and have held near that level since, $937.7M at June and $931.8M at September.
- The remaining converts are $575M of zero-coupon notes due March 1, 2028, trading below face at $534.75M fair value in June.
- There is no bank debt and no dividend. The capital question is purely what the cash pile is for.
- The buyback record answers part of it. The $1.0B authorization of July 2023 expired on July 26, 2026 with about $268.7M unspent, and no renewal had been announced as of the Q3 2026 print.
- Execution was $100.0M in Q1 2025 at an average of $62.71 a share, $30.0M in Q2 2025, and zero through the first nine months of 2026.
- Share count has therefore drifted up, from 131.08M at December 2025 to 132.31M, as equity awards vest faster than buybacks retire them.
- The credit pile is now a cash asset. On October 28, 2026 the company entered a transfer agreement to sell up to $100M of manufacturing credits to a financial institution, after selling $235.0M of 2025 credits at 93% of face in March.
- Warranty obligations of $204.2M are the real long liability, the accrual against 25-year promises on tens of millions of installed units.
What is Enphase worth by fiscal 2029?
The reference price of $30.42 pays about 45 times trailing GAAP earnings and about 22 times the Street's 2027 EPS estimate of $1.39, a multiple that only makes sense if 2027 is the new normal. The whole valuation question is whether it is. Management's 2027 targets say no: batteries up 50%, commercial tripling, Propel revenue starting, safe harbor deliveries continuing. The Street's 2027 revenue estimate of about $1.02B, down 8.6%, says yes. The scenarios below price both claims and the one beyond them.
| Fiscal 2029 ($M) | Bear | Base | Bull |
|---|---|---|---|
| Core residential microinverters and services | 830 | 1,020 | 1,250 |
| Batteries, residential and commercial | 240 | 380 | 520 |
| Commercial microinverters and systems | 60 | 130 | 210 |
| EV charging and other new products | 20 | 45 | 70 |
| Safe harbor deliveries and other | 50 | 75 | 0 |
| IQ Solid-State Transformer | 0 | 0 | 50 |
| Total revenue | 1,200 | 1,650 | 2,100 |
| Non-GAAP gross margin | 43% | 45.5% | 47% |
| Non-GAAP EPS | $1.30 | $2.75 | $3.65 |
| Exit multiple | 17x | 24x | 27x |
| Scenario value | $22 | $66 | $99 |
The bear case, $22
- The Street path is the bear path. Revenue stagnates near $1.02B in 2027 and reaches only $1.20B by fiscal 2029.
- The US residential market contracts again in 2027, battery shipments land near 500 MWh against the 675 MWh target, and commercial stalls near $60M.
- Propel disappoints, the safe harbor book converts slowly, and the SST stays a demonstration program.
- Gross margin erodes toward 43% as price competition from Tesla and the budget microinverter brands bites.
- The bear case values a fine company as a permanent ex-growth equipment vendor. It lands 28% below the reference price.
The base case, $66
- The US residential market bottoms in 2026 on the Wood Mackenzie path, a contraction of about 19%, and grows modestly from 2027 as rates ease and the TPO channel takes share.
- Batteries deliver the 675 MWh target in 2027 and keep growing with attach rates, reaching the volume implied by $380M of fiscal 2029 battery revenue.
- Commercial crosses $100M in 2027 on the IQ9N-3P and passes $200M by fiscal 2029 in the bull case only. In the base it reaches $130M.
- Propel contributes from 2027 and safe harbor deliveries add a declining tail through the decade.
- Non-GAAP gross margin holds near 45.5% as battery and commercial mix offsets residential price pressure, with the 45X credit intact through 2029.
- The skeptic case stands beside this base. It says the 2027 targets were set by the same team that expected 10% sell-through growth and got 1%, that the credit carrying the margin steps down after 2029, and that Tesla sets the storage price. Section 13 prices those claims.
- Our answer is the asymmetry. The base case needs a normal recovery, not a boom, and it still clears the reference price by more than double. The assumption doing the most work is battery volume, which is why the score trigger in section 1 is written on it.
The bull case, $99
- The recovery compounds. Residential demand returns toward 2024 levels by 2028 and Enphase takes share from a still-rebuilding SolarEdge.
- Batteries pass $500M of revenue, commercial passes $200M, and bidirectional charging becomes a real line as the auto partnerships ramp.
- The SST converts pilots into first shipments in 2028 and contributes $50M in fiscal 2029, with the data center option re-rating the multiple to 27 times.
- Gross margin recovers toward 47% on mix, and the buyback resumes and bends the share count down.
What could break the story?
The central risk is that the trough is not a trough. US residential solar has now contracted through two separate policy regimes, and the demand that remains is increasingly financed by third-party owners whose economics depend on commercial credits that themselves phase down. If the post-25D market settles near the Q2 2026 installation run rate rather than recovering from it, Enphase is a $1.1B revenue company with a cost base built for $1.5B, and the bear case in section 12 is not a stress case but a description.
The second risk is that the margin is partly a government receivable. Section 45X credits contributed 16.2 points of fiscal 2025 gross margin and $58.6M of Q3 2026 gross profit. The credit pays in full through 2029 and then steps down 25% a year to zero for product sold after 2032. Worse, eligibility now runs through foreign entity rules while the company's battery cells come entirely from two vendors in China. Management's answer is US manufacturing depth and FEOC-compliant product design, and the 2026 filings show the credits still flowing, but a single adverse determination lands directly on the gross margin line.
The third risk is competitive arithmetic. Tesla prices storage to move volume, FranklinWH takes the retrofit jobs Enphase's ecosystem cannot serve, and SolarEdge recognized triple Enphase's battery volume in Q3 2026 on its own recognition basis. None of these breaks the moat in section 7 this year. Together they cap the recovery the base case assumes, which is why the base case pays for share stability rather than share gains.
- Short interest of 29.42M shares, 22.2% of shares outstanding, makes the stock violent in both directions on any print.
- Customer concentration runs through one unnamed customer at 39% of fiscal 2025 revenue.
- The Q4 2026 guide embeds a further 10% sequential sell-through decline. A worse print extends the trough into 2027 guidance season.
- Reciprocal tariffs have cost between 1.3 and 4.3 points of quarterly gross margin through 2026 and can re-escalate.
- The stock comp line, $92.5M in the first half of 2026, dilutes the recovery per share if buybacks stay paused.
- Key-product risk is real in both directions. The SST consumes engineering attention for a market independent estimates size below $600M even by 2034.
Where does the stock sit today?
- Reference price is the Tuesday November 3, 2026 Nasdaq close of $30.42, up 8.92% on the day from $27.93.
- The 52-week range runs from $23.83 to $73.74.
- The low was set in the selloff after the Q3 2026 print, when the stock closed at $24.99 on October 28, down 16.0% in a session.
- The reference price sits about 59% below the 52-week high and about 28% above the low.
- Short interest stands at 29.42M shares, 22.2% of the 132.31M shares outstanding.
- The average analyst target is $40.58, about 33% above the reference price.
- The technical picture is a base being built after a capitulation print. The fundamental picture in sections 4 and 10 is a demand trough with a dated recovery plan.
- Q4 2026 results are the next hard checkpoint. The date is not yet company-announced, as flagged in the verdict note.
Frequently asked questions
Why did Enphase revenue fall so hard in 2026?
The Section 25D credit paid homeowners 30% of system cost and expired on December 31 2025. US sell through fell 35% year on year in Q3 2026 and high loan rates compounded the hit. Reported revenue held up only because safe harbor shipments to leasing partners added $85M in the quarter.
How much of the Enphase margin is really a tax credit?
A large share of the gross margin is. Section 45X manufacturing credits were $238.7M in fiscal 2025 and added 16.2 points of gross margin. Excluding the credit, gross margin was near 30% in fiscal 2025 and 23.4% in Q3 2026. The credit pays in full through 2029 and then steps down to zero after 2032.
What is the solid state transformer and does it matter yet?
The IQ SST converts medium voltage AC directly to 800 volt DC for AI data centers. Enphase demonstrated 13.8 kilovolt conversion in October 2026 and targets customer pilots in 2027 and shipments in 2028. It matters as an option only. There is no named customer and no booked order, so the base case carries it at zero.
Sources and disclosures
- Enphase Form 10-K for fiscal 2025, filed February 17, 2026, for the annual statements, geography, customer concentration and risk disclosures.
- Enphase Forms 10-Q for Q1 2026, filed April 28, 2026, and Q2 2026, filed July 28, 2026, for the revenue disaggregation, the AMPTC note, the balance sheet and the cash flow statements.
- Enphase earnings releases for Q4 2025 and Q1, Q2 and Q3 2026, furnished on Form 8-K, for quarterly revenue, safe harbor amounts, shipments, margins and guidance.
- Enphase Q3 2026 earnings call reporting, October 27, 2026, for the 2027 battery, commercial and EV charging targets and the sell-through detail.
- Enphase press releases of September 8, 2026 and October 27, 2026 for the IQ Solid-State Transformer module production and the 13.8 kV demonstration, and the October 28, 2026 disclosure of the manufacturing credit transfer agreement.
- SolarEdge Q3 2026 results release of November 4, 2026 and Tesla Q3 2026 update deck for competitor figures, with SEIA and Wood Mackenzie Solar Market Insight data for market volumes and Berkeley Lab data for attach rates.
- Manufacturer datasheets for the IQ Battery 5P and 10C, Tesla Powerwall 3, FranklinWH aPower 2 and Generac PWRcell 2 for the specification table.
- Market data for the November 3, 2026 close, the 52-week range and short interest cross-checked across TipRanks, FinanceCharts, YCharts, Optionistics and StockAnalysis.
- Disclosures. DalalBytes holds no position in Enphase Energy (ENPH) at publication. This report is research and opinion for educational purposes only and is not investment advice, a recommendation, or a solicitation. Prices and estimates are as of November 4, 2026, and will age. Verify figures against company filings before acting on them.