
What is the verdict?
54/100. Neutral. The fastest growth in on site power, a backlog near $20B, and a stock that already pays today for delivery due in 2029.
| 54/100 | DalalBytes score |
| $222.30 | Reference price, Oct 29, 2026 close |
| $65.7B | Market cap, 295.5M shares outstanding |
| $47 / $133 / $275 | FY2029 bear / base / bull |
What would change the score
Free cash flow that stays positive across consecutive quarters, rather than resting on one collection quarter, would lift this score, and another negative free cash flow quarter at record revenue would cut it.
Bloom is the purest listed play on time to power. Revenue grew 138.1% in Q3 2026, guidance rose three times in one year, and GAAP gross margin reached a record 33.8%. The order book holds frameworks with Brookfield, AEP, and Oracle.
The weak spots are just as clear. One counterparty drove about 73% of Q2 2026 revenue, and Q3 free cash flow was negative $180.6M in a record quarter. A securities class action now tests past supply chain statements, and the price sits about 67% above our base case value.
Our read is simple. The business is real and the ramp is real. The stock has already collected payment for years of clean delivery.
The price basis of this report
Bloom reported Q3 2026 on October 22, 2026, a week before this report. The stock fell hard on the print and kept falling. All valuation math here uses the October 29, 2026 close of $222.30.
What is Bloom Energy today?
Bloom Energy sells solid oxide fuel cell systems for on site power. The company is based in San Jose, California, its fiscal year ends on December 31, and its plants sit in Fremont, California and in Delaware. Bloom reports one business segment.
KR Sridhar founded the company, and he is chairman and chief executive. Staff stood at 2,214 full time employees at the end of 2025, and the fleet runs at about 1,100 sites in 9 countries. The United States produced 81% of FY2025 revenue, and Bloom joined the S and P 500 index in 2026.
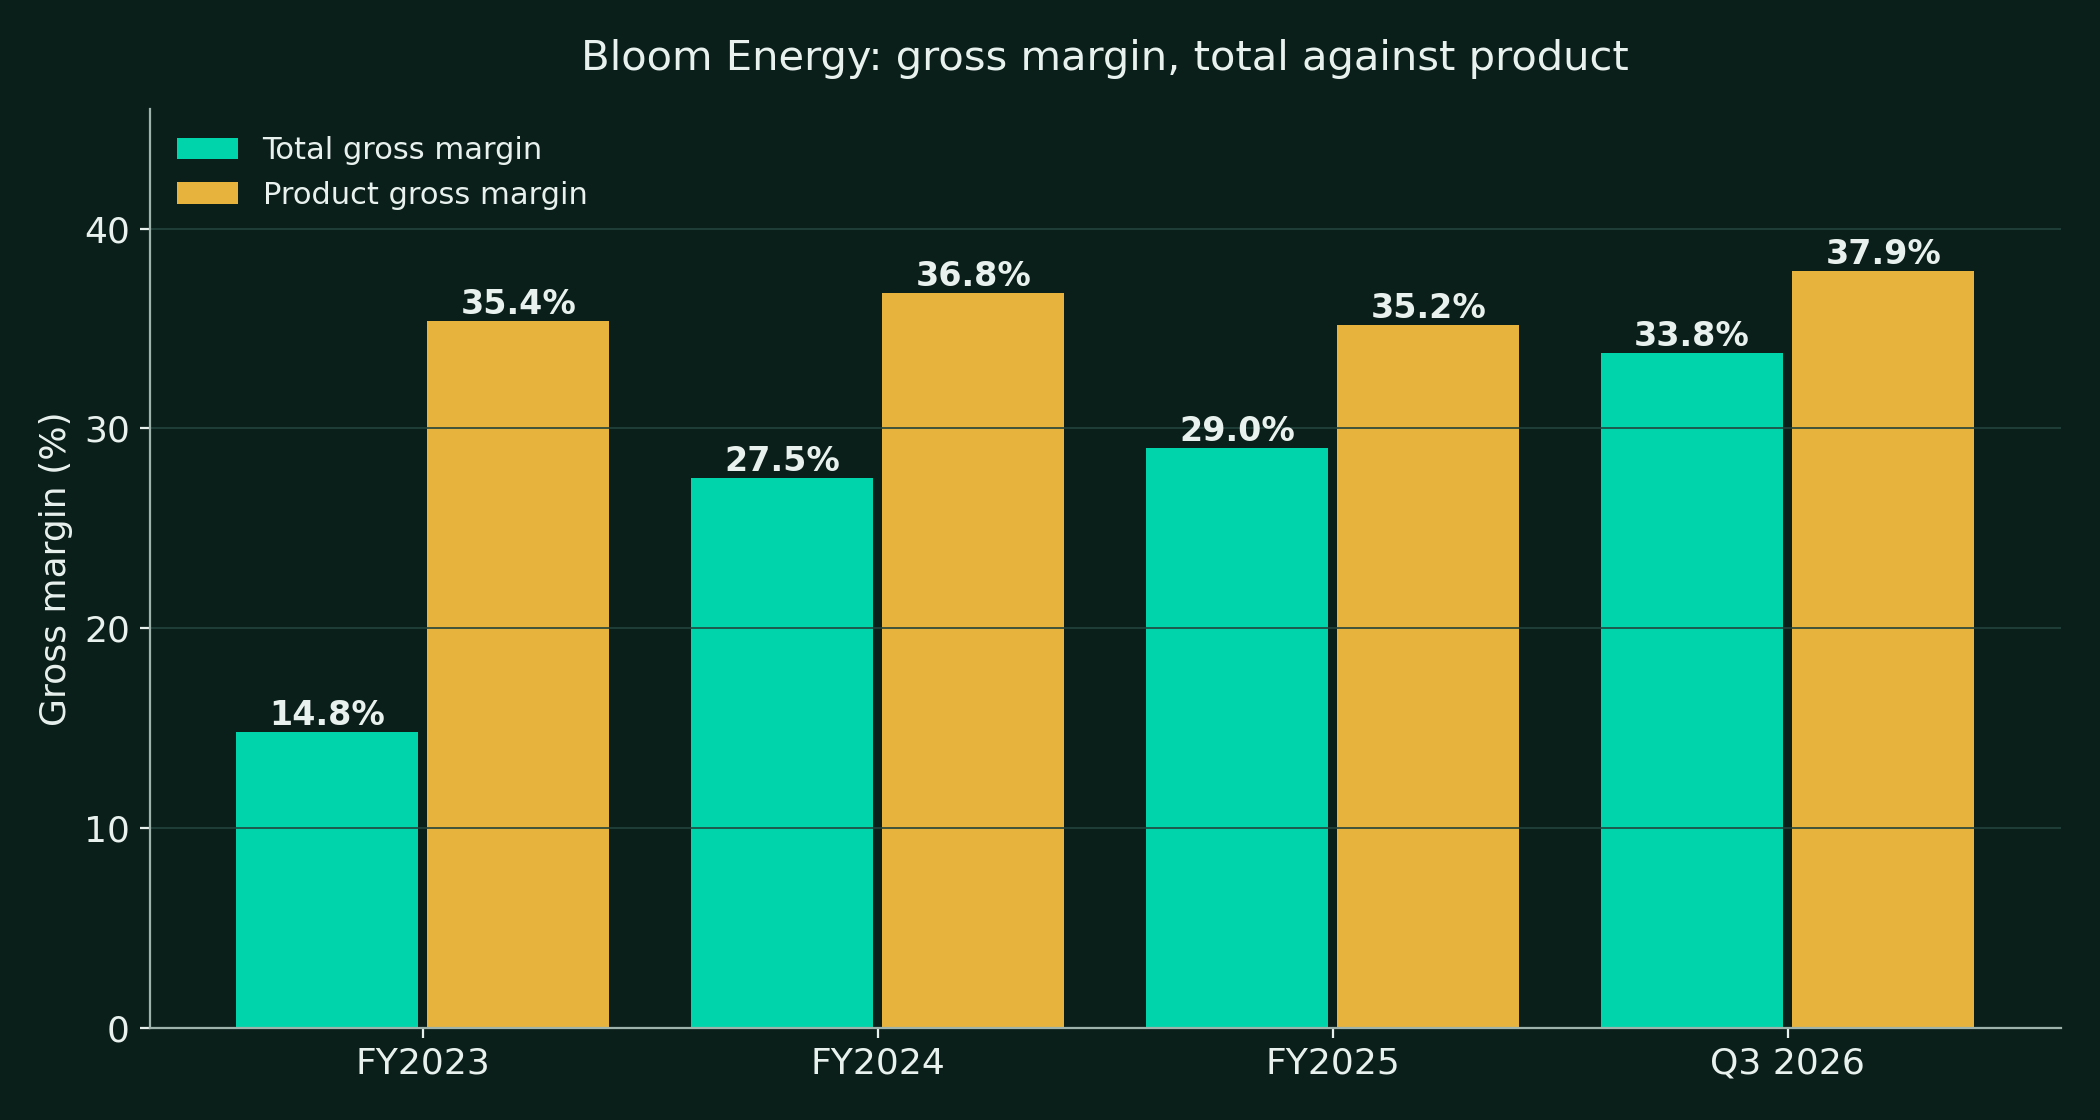
| Metric | FY2023 | FY2024 | FY2025 | 9M 2026 |
|---|---|---|---|---|
| Total revenue ($M) | 1,333.5 | 1,473.9 | 2,024.0 | 3,052.3 |
| Gross margin | 14.8% | 27.5% | 29.0% | 32.7% |
| Operating income ($M) | (208.9) | 22.9 | 72.8 | 479.8 |
| Net income to common ($M) | (302.1) | (29.2) | (88.4) | 517.2 |
| Free cash flow ($M) | (456.3) | 33.1 | 57.2 | 41.6 |
Sources: Bloom Energy FY2025 10-K, the Q3 2026 earnings release, and 10-Q data as cited. Nine month free cash flow is calculated from the filed operating cash flow and capital spending.
The table tells the story in one view. Revenue and profit inflected hard in 2026. Cash conversion did not keep pace.
How does a Bloom Energy Server make power?
The product is the Bloom Energy Server. It is a box of fuel cell stacks that sits at the customer site.
- Natural gas flows in one side. Air flows in the other.
- Inside the stack, thin ceramic cells carry oxygen ions from the air side to the fuel side.
- The fuel reacts across the ceramic. No flame burns anywhere in the box.
- The reaction frees electrons. The box collects them as direct current power.
- An inverter turns that power into the alternating current a building uses.
- The byproducts are heat, water, and carbon dioxide when the fuel is gas.
- Output runs around the clock. Sun and wind play no part.
- Each unit is modular. Sites stack units from hundreds of kilowatts to hundreds of megawatts.
- The same stack platform runs on biogas today. It can run on hydrogen blends and on pure hydrogen.
- Bloom also sells the Bloom Electrolyzer. It runs the cell in reverse to make hydrogen.
Why buyers pay a premium for it:
- A Bloom site can stand up in months. A new grid connection can take five years or more.
- The system needs no water for cooling.
- Local air pollutants stay near zero because nothing burns.
- On gas, carbon output per unit of power runs well below a simple gas engine.
The honest limits:
- On natural gas the box still emits carbon dioxide.
- Full carbon capture is a project add-on, not a built in feature.
- The ceramic electrolyte uses scandium, a rare metal with a thin world supply.
- Stacks wear over time. Bloom sells long term service plans that include stack refresh.
How does Bloom Energy make money?
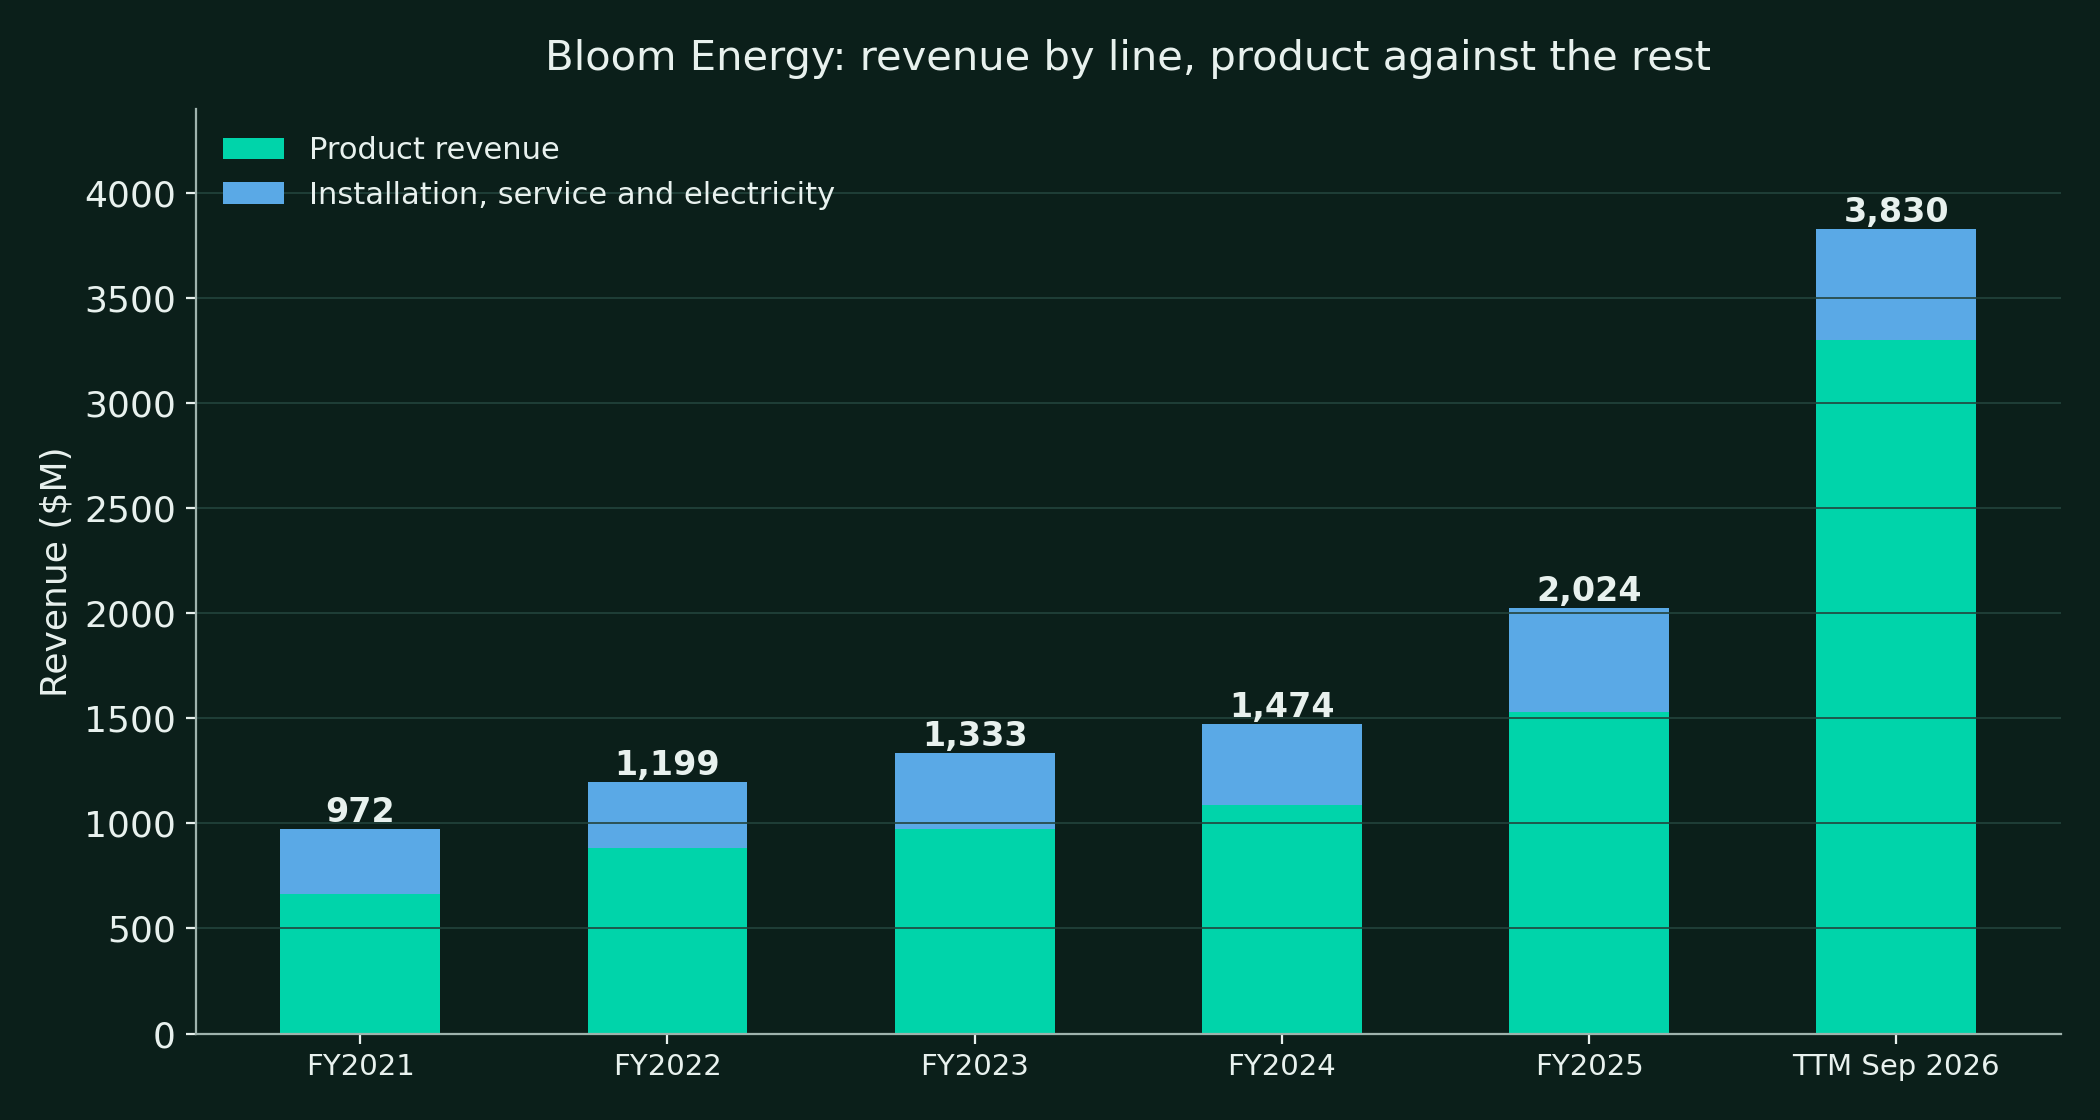
Bloom reports four revenue lines. Product is the engine. Service is the annuity that follows each install.
| Revenue line ($M) | FY2025 | Gross margin | Q3 2026 | Gross margin |
|---|---|---|---|---|
| Product | 1,531.3 | 35.2% | 1,073.6 | 37.9% |
| Installation | 204.1 | -0.9% | 84.9 | -4.8% |
| Service | 228.3 | 10.0% | 67.6 | 17.8% |
| Electricity | 60.4 | 46.3% | 9.8 | 25.7% |
| Total | 2,024.0 | 29.0% | 1,235.8 | 33.8% |
Source: Bloom Energy FY2025 10-K and the Q3 2026 earnings release.
- Product was 87% of Q3 2026 revenue.
- Product margin reached 37.9% in Q3 2026, the best print in the data we reviewed.
- Service margin climbed from a 20.7% loss in FY2023 to a 17.8% gain in Q3 2026.
- Service revenue grows with every accepted system. Contracts run 5 to 20 years.
- Installation runs near zero or below. Bloom now shifts large sites to a consult only model.
- Electricity is the legacy power purchase fleet. It shrinks as Bloom buys out and repowers old sites.
- Related party revenue was $892.0M in FY2025. That is 44% of the year, per the 10-K.
- The related party flow runs through joint ventures and partners, led by Brookfield vehicles.
One margin caution
Q2 2026 product gross profit included a $37.4M recovery of import tariffs paid in past periods, per the 10-Q. That one item flattered the Q2 margin. Q3 carried no such item in the release.
What did Bloom report in Q3 2026?
Q3 2026 was reported on October 22, 2026. The quarter ended on September 30, 2026. The print is inside this report in full.
| $M except EPS | Q3 2025 | Q2 2026 | Q3 2026 |
|---|---|---|---|
| Total revenue | 519.0 | 1,065.4 | 1,235.8 |
| Product revenue | 384.3 | 935.4 | 1,073.6 |
| Gross profit | 151.7 | 355.6 | 417.1 |
| Gross margin | 29.2% | 33.4% | 33.8% |
| Operating income | 7.8 | 182.2 | 225.4 |
| Net income to common | (23.1) | 196.3 | 250.3 |
| GAAP diluted EPS | (0.10) | 0.62 | 0.78 |
| Non-GAAP diluted EPS | 0.15 | 0.78 | 0.94 |
| Operating cash flow | 19.7 | 226.4 | (27.1) |
| Capital spending | 12.3 | 51.6 | 153.5 |
| Free cash flow | 7.4 | 174.8 | (180.6) |
Source: Bloom Energy Q3 2026 earnings release. Free cash flow is operating cash flow less purchases of property, plant and equipment.
- Revenue beat the consensus near $1.07B by a wide margin.
- Non-GAAP EPS of $0.94 beat the consensus near $0.71.
- Stock based compensation was $60.1M in the quarter. It is the main gap between GAAP and non-GAAP profit.
- Contract assets jumped to $858.6M. Bloom booked revenue ahead of billing milestones.
- The stock fell about 7% after hours on the print.
- It closed down 11.24% at $193.30 on October 23, 2026.
- Analyst cuts followed at Jefferies and others. The debate moved from growth to cash.
Guidance, raised three times
| FY2026 guide | Feb 2026 | Apr 2026 | Jul 2026 | Oct 2026 |
|---|---|---|---|---|
| Revenue ($B) | 3.1 to 3.3 | 3.4 to 3.8 | 3.9 to 4.2 | 4.4 to 4.6 |
| Non-GAAP gross margin | about 32% | about 34% | about 34% | about 34% |
| Non-GAAP operating income ($M) | not given | 600 to 750 | 800 to 900 | 960 to 1,030 |
| Non-GAAP diluted EPS | not given | 1.85 to 2.25 | 2.55 to 2.85 | 3.10 to 3.40 |
Sources: Bloom Energy earnings releases through 2026. The October guide needs Q4 revenue of about $1.35B to $1.55B. Management warned that the timing of a few year end deliveries sets the final landing point inside the range.
Which deals drive the story?
Frameworks are not orders. This section keeps the two apart on every line.
| Partner | Date | Size | Status at Oct 2026 |
|---|---|---|---|
| Brookfield | Aug 2025, expanded Jun 2026 | $5B framework, later $25B | Framework, funds projects that meet set criteria |
| AEP | Nov 2024 | Up to 1 GW, first order 100 MW | Deploying, plus a 700 MW carbon capture project |
| Oracle | 2025, expanded Apr 2026 | Up to 2.8 GW | About 1.2 GW contracted at last report |
| SK ecoplant | Since 2018 | About 682 MW deployed in Korea | Active channel, owns about 2.5% of Bloom |
| Equinix | Since 2015 | Data center fleet across many sites | Active, no new headline deal in 2026 |
| US Army via Indelible | Sep 2026 | Lease awards at Army sites | Conditional awards, not equipment orders |
Brookfield, the financing engine
- Brookfield set a financing framework of up to $5.0B over five years in August 2025.
- The money sits in a Brookfield AI infrastructure fund.
- Bloom is the preferred on site power partner for Brookfield AI factories.
- The framework expanded to $25B in June 2026, as reported.
- Project vehicles buy the systems. Bloom books product revenue through the ventures.
- That structure explains the related party revenue of $892.0M in FY2025.
- Contracted status: a framework with criteria. It is not a single $25B purchase order.
AEP, the utility door
- AEP agreed in November 2024 to procure up to 1 GW of Bloom systems.
- The first order covered 100 MW. The commitment was reported near $2.65B.
- In October 2026 AEP announced 700 MW of Bloom servers with carbon capture.
- That fleet will serve Google with near net zero power, per AEP and Bloom.
- It is front of the meter supply. The utility sells the power onward.
- Contracted status: a supply agreement with phased orders, now with a named 700 MW project.
Oracle, the largest single site story
- Oracle signed supply agreements with Bloom through 2025.
- Reporting in April 2026 put the program at up to 2.8 GW. About 1.2 GW stood contracted.
- Project Jupiter in New Mexico takes about 2.4 GW of that program, as reported.
- Oracle delivered power at a Utah site less than two months after the project news, per press coverage of the Q3 call.
- Oracle held a warrant for 3.5M Bloom shares at $113.28. It exercised the warrant without cash on May 1, 2026.
- A gas pipeline delay at Jupiter led Oracle to serve a force majeure notice, as reported.
- Oracle reaffirmed the commitment in September 2026 reporting. The project stands delayed, not cancelled.
- Contracted status: real contracts, real slippage. This is the single largest delivery risk in the story.
The rest of the bench
- SK ecoplant distributes Bloom systems in South Korea and runs a joint venture plant there.
- Equinix runs Bloom systems across many data centers. Hundreds of megawatts serve data centers across the AEP, Equinix, and Oracle relationships, per company materials.
- Ameren Missouri put 500 MW of fuel cells in a 20 year resource plan. The plan does not name Bloom as the supplier.
- Virginia wrote fuel cells into its 2026 energy plan as a preferred resource, with room for up to 5 GW by 2035. A state plan is a door, not an order.
What sits inside the backlog?
- Bloom put total backlog near $20B with its Q4 2025 results in February 2026.
- About $6B of that is product backlog.
- About $14B is service contracts and related commitments.
- Service backlog converts over 5 to 20 years. It is not next year revenue.
- Management said in July 2026 and again in October 2026 that backlog grows faster than revenue.
- No updated dollar backlog figure came with the Q3 2026 release.
- Management cited visibility to about 25 GW of deployments on the Q2 2026 call. That figure mixes contracts, frameworks, and active talks.
- Filed remaining performance obligations for product and installation were $442.4M at June 30, 2026, per the 10-Q as summarized from the filing.
- The two figures use different definitions. The $20B counts long service tails. The filed figure counts a narrower set of contracts.
The concentration inside the growth
One counterparty drove about 73% of Q2 2026 revenue, per the amended 10-Q. Bloom defines that counterparty as the contracting party. It can be a project finance affiliate rather than the end user. Three customers were 36%, 34%, and 17% of receivables at June 30, 2026. Growth this fast, through this few doors, carries single name risk on every quarter.
Can Bloom build fast enough?
- Fremont builds about 1 GW of systems a year today.
- The plan doubles Fremont to 2 GW by the end of 2026.
- Each added GW takes about six to nine months to install.
- Each added GW costs about $100M to $150M, per company statements as reported.
- Bloom has said the Fremont footprint can hold about 5 GW in time.
- In August 2026 Bloom leased a second Fremont site of about 158,400 square feet.
- The lease runs 150 months. It had not begun at September 30, 2026, per the 10-Q.
- Barclays read the second site as a path from 5 to 6 GW toward 10 to 12 GW. That is an analyst estimate, not a company target.
- On the Q3 call, Sridhar said Bloom prepares capacity beyond the 5 GW milestone.
- He gave no date. He said capacity follows demand in steps, not in one big jump.
- Capital spending hit $231.3M in the first nine months of 2026. The same span last year used $33.8M.
- Q3 alone used $153.5M, mostly machinery and production expansion, per the CFO.
What does a watt of Bloom power cost?
- Product gross margin was 37.9% in Q3 2026. Scale and cost cuts both helped.
- AEP's 1 GW commitment was reported near $2.65B. That is about $2.65 per watt of project value, as an outside estimate.
- Factory capacity is cheap next to product value. A GW of plant costs about $100M to $150M to add.
- The cost stack sits in supply, not in the factory. Bloom had $5.8B of supplier and contract manufacturer purchase commitments at September 30, 2026, per the 10-Q.
- About $2.6B of those commitments fall due in 2027. Some carry minimum purchase terms.
- Service is where unit economics compound. Each accepted GW adds a 5 to 20 year service tail.
- Installation loses money on early large sites by design. Bloom prices it to win the service tail.
- The watch item is stack life. Warranty accruals rose fast in 2026, and section 15 covers the cash side.
How much does policy matter?
- Fuel cell projects qualify for a 30% federal investment tax credit under current law, as reported through 2033.
- The credit flows to the project owner or its financiers. It cuts the customer net cost of a Bloom site.
- The One Big Beautiful Bill Act kept fuel cells inside the credit while it cut other clean energy support.
- State policy helps too. Virginia named fuel cells a preferred non combustion gas resource in its 2026 plan.
- Policy is a support, not a moat. A future Congress can rewrite the credit.
- Trade policy cuts the other way. Bloom paid import tariffs that it later recovered in part, per the 10-Q.
- The scandium dispute in section 13 shows how one input can turn into a legal and policy fight.
How does Bloom compare with turbines and rivals?
| Rival path | Scale proof | Wait for new supply | Cost signal |
|---|---|---|---|
| GE Vernova gas turbines | 116 GW of backlog and slot reservations at Jun 30, 2026 | Slots run into 2030 and 2031 | New combined cycle plants cost at least $2,400 per kW, per RMI |
| Siemens Energy gas turbines | 69 GW gas backlog | Multi year | Prices up hard across the industry |
| Mitsubishi Heavy gas turbines | 35 GW gas backlog | Multi year | Same queue problem |
| Reciprocating engine gensets | Caterpillar and Cummins fleets ship faster | Months to about a year | Lower efficiency, more local emissions |
| FuelCell Energy | A far smaller fuel cell rival | Plant scale is small | Trades near 10 times sales, per analyst coverage |
| Grid plus batteries | Interconnection queues run past five years | Years | Batteries shift hours, they make no firm power |
Sources: company reports and industry coverage as cited in the text. Backlog figures for turbine makers include slot reservations, which are deposits and not firm orders.
Bloom wins on time, because a site can run in months against years for a turbine slot or a grid upgrade. Bloom also wins on local air quality, because nothing burns at the site. On headline cost per kW, Bloom loses against a turbine plant at old prices.
The gap narrows as turbine prices climb, and GE Vernova output runs near 20 GW a year against that 116 GW book. Bloom's true rival is delay itself, because every rival that can ship firm power in 2027 takes the same urgent buyer.
Has Bloom delivered on its roadmap?
| Guidepost | Set when | Delivered by Oct 29, 2026 | Grade |
|---|---|---|---|
| FY2026 revenue guide | Feb 2026 at $3.1B to $3.3B | Raised three times to $4.4B to $4.6B | Beaten, final print pending |
| Fremont to 2 GW | Feb 2026 | Capex and hiring on plan, year not closed | On track |
| Brookfield framework | Aug 2025 at $5B | Expanded to $25B in Jun 2026 | Beaten on paper |
| Oracle program | 2025 at up to 2.8 GW | About 1.2 GW contracted, Jupiter delayed | Mixed |
| AEP program | Nov 2024 at up to 1 GW | 700 MW carbon capture project named | In progress |
| Capacity near 5 GW | Company statements | Second Fremont site leased, no date set | Pending |
| Self funding model | Management language in 2026 | Nine month free cash flow of $41.6M | Not yet proven |
The pattern is clear. Demand side promises land early or get raised, while delivery side promises land late or stay open. Guidance skill is now a strength, because Edwards raised the guide three times with delivery timing caveats each time.
The skeptic case rests on conversion, because frameworks and backlog must turn into accepted systems and collected cash. The segment that does the most work in any bull case is product volume at Oracle and Brookfield sites. Evidence that would break the base case is simple: a Jupiter cancellation, or two straight quarters of negative operating cash flow at this revenue scale.
How should investors grade Sridhar and the board?
- KR Sridhar founded Bloom and still runs it as chairman and chief executive.
- He called the on site power shift years before the AI buildout made it urgent.
- Delivery under him in 2026 is real. Three guidance raises in one year is rare.
- The finance chair is the weak seat. Daniel Berenbaum left the CFO role on May 1, 2025.
- Maciej Kurzymski acted as principal financial officer for about eleven months.
- Simon Edwards took the CFO seat on April 13, 2026. He came from Groq, where he was chief executive and before that CFO.
- Edwards owns the guidance record since April. It has been clean so far.
The hard part of the record:
- On July 8, 2026, Hunterbrook Media published a report titled Bloom's Big Lie.
- It alleged that Bloom sources scandium through intermediaries that buy from China.
- Bloom had told investors it was not dependent on China for scandium.
- Bloom denied the claims in an 8-K and called its supply chain diversified across countries.
- The stock fell 5.7% to $254.29 that day.
- A federal securities class action followed on July 30, 2026. It names Bloom, Sridhar, Edwards, Kurzymski, and Berenbaum.
- A second Hunterbrook report alleged fleet degradation and Oracle project delays. The stock fell 13% to $163.04 that day, as reported.
- The claims are allegations. No court has ruled on them.
- Insiders sold about $21.8M of stock in the quarter before Q3, per analyst coverage.
- Dilution is a habit. Shares outstanding rose from 229.1M at the end of 2024 to 295.5M at September 30, 2026.
- Partners take equity too. The balance sheet carries a $306.5M customer consideration asset, the cost of share based deal sweeteners.
Sridhar built the category and the company. The question for this pillar is no longer vision. It is whether disclosure and capital discipline match the operating delivery.
DalalBytes read of the record
How strong is the balance sheet?
| $M | Dec 31, 2025 | Sep 30, 2026 |
|---|---|---|
| Cash and equivalents | 2,454.1 | 2,486.7 |
| Accounts receivable | 371.8 | 634.7 |
| Contract assets, total | 241.2 | 858.6 |
| Inventories | 643.3 | 927.7 |
| Property, plant and equipment, net | 398.5 | 539.7 |
| Recourse debt | 2,613.7 | 2,473.5 |
| Financing obligations, total | 243.8 | 185.0 |
| Deferred revenue and customer deposits, total | 143.8 | 754.4 |
| Accrued warranty, current | 20.0 | 70.3 |
| Total equity | 793.0 | 1,963.1 |
| Accumulated deficit | (3,987.0) | (3,470.7) |
Source: Bloom Energy Q3 2026 earnings release balance sheet.
- The debt stack is simple now. Almost all of it is $2.5B of zero coupon convertible notes.
- The notes mature on November 15, 2030. They pay no interest.
- The conversion price is $194.97. The notes sit in the money at $222.30.
- Conversion would add about 12.8M shares.
- Bloom issued the notes in November 2025 at an upsized $2.2B plus a $300M option that buyers took.
- Proceeds repaid about $976M of older debt.
- A concurrent exchange issued 42.4M shares to holders of the old 2028 and 2029 green notes.
- That exchange cost a $66.2M inducement charge in FY2025.
- Small green note stubs remain, $0.8M due 2028 and $27.0M due 2029 at June 30, 2026.
- A $600M secured revolving credit line was signed in December 2025. It stood undrawn at June 30, 2026.
- Cash covers the converts at par today. No maturity wall stands before 2028, and that wall is now tiny.
The soft spots sit off the debt line
Contract assets of $858.6M are revenue booked ahead of billing. Supplier commitments of $5.8B come due ahead of customer cash on new projects. Accrued warranty rose from $20.0M to $70.3M in nine months, a rise the company ties to fleet degradation, as reported. None of these break the balance sheet today. All three grow with the ramp.
Where does the cash go?
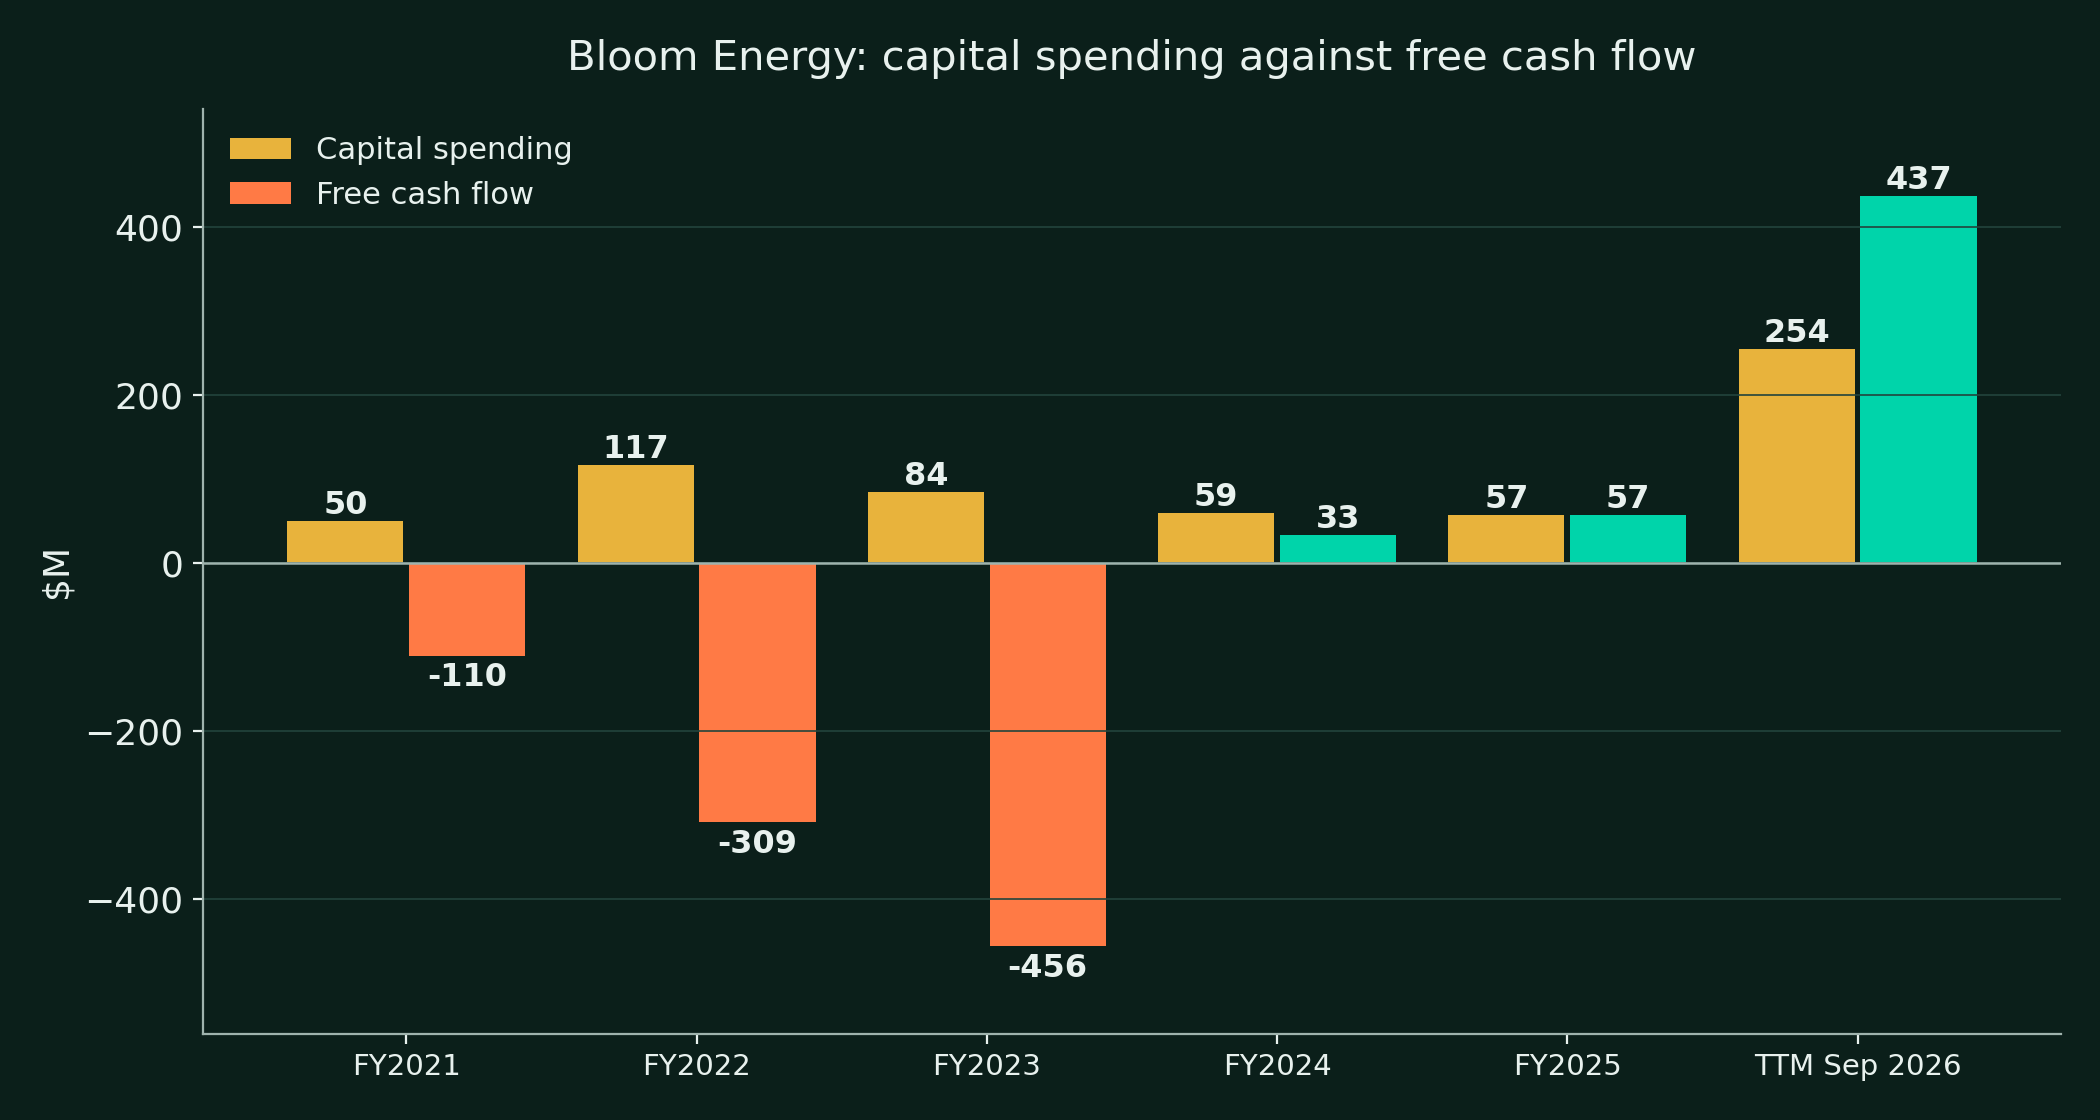
| $M | FY2023 | FY2024 | FY2025 | TTM Sep 2026 |
|---|---|---|---|---|
| Operating cash flow | (372.5) | 92.0 | 113.9 | 691.0 |
| Capital spending | 83.7 | 58.9 | 56.8 | 254.3 |
| Free cash flow | (456.3) | 33.1 | 57.2 | 436.7 |
Sources: Bloom Energy FY2025 10-K and Q3 2026 earnings release. Trailing figures are calculated from filed quarters.
- The trailing year looks strong. The build inside it is lumpy.
- Q4 2025 alone produced about $418.0M of operating cash flow, calculated from the filed year less the first nine months.
- The first nine months of 2026 produced $272.9M of operating cash flow and $41.6M of free cash flow.
- Q3 2026 used $27.1M of operating cash and $180.6M of free cash in the best revenue quarter on record.
- Working capital eats the growth. Receivables, contract assets, and inventory all climbed faster than revenue in Q3.
- Customers fund part of the ramp. Deferred revenue and customer deposits rose about $610.6M in nine months.
- Stock based compensation ran $60.1M in Q3 alone. It is a real cost that non-GAAP profit removes.
- There is no buyback. There is no common dividend.
- Capital returns are not the story. Survival of the ramp is the story, and it is funded so far.
What is Bloom worth at $222.30?
- The market cap is $65.7B on 295.5M shares at $222.30.
- The diluted share count was 324.3M in Q3 2026. The diluted value is about $72.1B.
- Cash of $2,486.7M roughly matches recourse debt of $2,473.5M.
- Enterprise value sits near $66.0B.
- The price is about 14.6 times FY2026 guided revenue at the $4.5B midpoint.
- The price is about 68 times the FY2026 non-GAAP EPS guide midpoint of $3.25.
- Trailing GAAP EPS is about $1.72 a share, per vendor data. The trailing price to earnings ratio sits above 125 times.
- Before the Q3 print, coverage put Bloom near 19 times forward revenue and 93 times forward EBITDA. A median electrical equipment peer sat near 6 times and 18 times on the same work.
- Analyst targets after the print run from $240 at Truist to $242 at Jefferies, $260 at BMO, and $308 to $351 at Barclays, Baird, and UBS.
- A target spread that wide is information. The street agrees on the growth and disagrees on what it is worth.
Our read, in short:
- The market pays for 2029 delivery at 2026 prices.
- Growth must stay extreme for years to make this price look low in hindsight.
- Any single project slip hits a stock with no valuation cushion.
What are the FY2029 bear, base, and bull targets?
Targets use GAAP diluted EPS times an exit multiple. The share count path assumes the converts convert and stock pay keeps adding shares.
| Case | FY2029 GAAP EPS | Multiple | Target | Core assumptions |
|---|---|---|---|---|
| Bear | $2.60 | 18x | $47 | Shipments stall near 2 GW, revenue near $7.0B, margins give back 2026 gains |
| Base | $4.75 | 28x | $133 | Shipments near 3.6 GW, revenue near $10.0B, GAAP operating margin near 18% |
| Bull | $8.55 | 32x | $275 | Shipments near 5.5 GW, revenue near $16.0B, pricing and service mix hold |
- Our FY2026 GAAP EPS estimate is about $2.50, against the non-GAAP guide of $3.10 to $3.40.
- The base EPS path runs about $3.60 in FY2027 and about $4.15 in FY2028 on our estimates.
- The base case still lands 40% under the reference price.
- The bull case lands only 24% above it. The stock needs the bull path just to earn a normal return.
- The bear case is not a disaster case. It is a stall case, and it cuts the price by about four fifths.
- That spread is the honest shape of this stock at $222.30.
What does the chart say?
- The close on October 29, 2026 was $222.30, down 2.53% on the day.
- The 50 day average sits near $248. The price trades about 10% under it.
- The 200 day average sits near $221. The price sits right on that line.
- A simple 14 day RSI calculation reads about 33. The stock nears oversold on that gauge.
- The peak close was $345.85 on June 22, 2026. The price sits 36% under it.
- The 52 week range is $75.70 to $351.28, per Finnhub.
- October shows the violence. The stock closed at $291.29 on October 7 and at $193.30 on October 23.
- Volume on October 29 was about 10.0M shares.
- Support sits first at the 200 day line near $221, then at the October low near $193, then at the July low near $163.
- Resistance sits at the 50 day line near $248, then near $291, then at the June peak.
- Averages and RSI are calculated from Finnhub daily closes through October 29, 2026.
What are the main risks?
Concentration risk. One counterparty drove about 73% of Q2 2026 revenue, and a slip at one door moves the whole year. Disclosure risk. The class action tests the scandium statements, and a ruling against Bloom would cost money and trust at once.
Warranty risk. Accrued warranty rose from $20.0M to $70.3M in nine months, and fleet degradation at scale would hit margin and the service story. Delivery risk. Project Jupiter already slipped on a pipeline and permits, and one force majeure notice has arrived.
Cash conversion risk. Q3 free cash flow was negative $180.6M in a record revenue quarter, and growth can outrun collections for a long time. Commitment risk. Supplier commitments of $5.8B fall due ahead of project cash, and about $2.6B lands in 2027 alone.
Valuation risk. Our base case value sits 40% under the price, and any de-rating lands on a stock with a beta above 3. Policy risk. The 30% tax credit supports project economics, and a rewrite in Washington cuts customer returns.
Input risk. Scandium supply is thin and concentrated, and any export control or supplier failure hits production directly. Dilution risk. The share count rose 29% in 21 months, and converts, warrants, and stock pay keep adding shares.
What should investors watch next?
- Q4 2026 results land early in 2026 reporting season. Bloom has not confirmed the date in the materials we reviewed.
- Watch Q4 collections. The guidance year and the cash story both close there.
- Watch contract assets. A fall from $858.6M would prove billing is catching up with revenue.
- Watch the Fremont second site. A start date turns the 5 GW talk into a dated plan.
- Watch Project Jupiter milestones and any new force majeure language.
- Watch the class action. A lead plaintiff ruling and any amended complaint come next.
- Watch warranty accruals each quarter. That line grades stack life in public.
- Watch for a dated backlog update. Management owes the market a fresh dollar figure.
The conclusion, in short:
- Bloom is the right product at the right moment in the power market.
- The filings back the growth. Revenue, margin, and backlog all moved the right way in 2026.
- The filings also show the strain. Cash conversion, concentration, and warranty all flash yellow.
- At $222.30 the price assumes the yellow lights turn green on schedule.
- Our score of 54/100 says the company earns a watchlist place, not a full price ticket.
Frequently asked questions
Is Bloom Energy stock cheap at $222.30?
On the FY2026 guide the price is about 68 times non-GAAP earnings and about 15 times revenue. Our base case value for FY2029 is $133 a share. The price pays today for delivery that lands years out. Early is the right word for this stock. Cheap is not.
What is the biggest risk in Bloom Energy?
Concentration and conversion. One counterparty drove about 73% of Q2 2026 revenue, and the largest project already slipped once on permits and a pipeline. The backlog is real paper. It turns into cash only when sites are ready and project financing closes on time.
When does free cash flow turn durable?
Trailing free cash flow is positive at about $436.7M, but one quarter made most of it. The first nine months of 2026 produced $41.6M. Durable means four straight positive quarters at this revenue scale, with contract assets falling. That test is still open.
Disclosures
- This report is research and opinion.
- It is not investment advice.
- DalalBytes Research. For educational purposes only. Not investment advice.
- Numbers come from company filings, company releases, and named press reports.
- Estimates are labeled as estimates where they appear.
- Management targets are labeled as targets. They are not results.
- The author holds no position in Bloom Energy at the time of publication.