
What is the verdict on Broadcom?
76/100. Positive. The design layer of the custom AI era, a software annuity under it, and a stock that has already paid a 34% doubt discount from its June 2026 high.
What would change the score. The score rises if fiscal 2027 AI revenue tracks the $115B guide with consolidated gross margin held at or above 72% and a seventh XPU customer reaches production volumes, and it falls if any top-three XPU customer moves a chip generation to a rival designer or in-house tooling, or if the fiscal 2028 AI guide is cut.
| 76/100 | DalalBytes score |
| $326.08 | Reference price. October 30 2026 close (Finnhub) |
| $1.55T | Market cap at about 4760M shares |
| $310 / $840 / $1170 | Fiscal 2029 bear / base / bull |
Broadcom today is two businesses welded together. The first designs the custom accelerators and the Ethernet fabric that six of the largest AI buyers now build their clusters around, and it is growing at a rate no company of this size has sustained before. The second is a software annuity built from VMware, CA and Symantec enterprise assets that converts at a 77% segment operating margin and funds the first business without drama.
The argument is not whether the AI guide is real. The argument is how much of it to pay for before it ships. Management has raised the fiscal 2027 AI guide twice and introduced a fiscal 2028 AI guide of about $230B with earnings per share above $30. At $326.08 the stock prices in a large part of the first guide and very little of the second, which is exactly the gap a Positive grade is meant to mark.
Our base case haircuts the fiscal 2028 guide and still lands far above the price. The bear case is not a collapse case. It says the gigawatt ramps slip, two customers pause to digest, and the stock is worth about what it costs today. That asymmetry, delivery evidence on one side and a doubt discount on the other, is the report in one paragraph.
The price basis of this report
This report uses the Friday October 30, 2026 Nasdaq close of $326.08 from Finnhub throughout. Broadcom has not yet announced the date of its fiscal Q4 2026 results as of November 1, 2026. Earnings calendars list December 9 or December 10, 2026, and management said on the fiscal Q3 call that it plans to report on December 9. Treat both dates as unconfirmed until the company issues its announcement release.
What is Broadcom in one page?
Broadcom Inc. is based in Palo Alto, California, and trades on Nasdaq as AVGO. Its semiconductor lineage runs from the Hewlett-Packard and Agilent chip businesses through Avago Technologies, which merged with the original Broadcom in 2016 in a $37B deal. The fiscal year ends on the Friday nearest October 31, so fiscal 2026 ends around October 30, 2026, and the latest reported quarter is Q3 fiscal 2026, which ended August 2, 2026.
The company that Hock Tan built runs a simple playbook. Buy or build franchise assets with pricing power, run them for cash at industry-leading margins, and redeploy the cash into the next franchise. The playbook produced a networking and broadband chip leader first, then a software arm through CA Technologies in 2018, the Symantec enterprise business in 2019, and VMware in November 2023 for about $61B of equity value plus about $8B of assumed debt.
That history matters because the AI business is the playbook at its largest scale yet. Broadcom does not sell a merchant AI chip. It co-designs custom accelerators, called XPUs, with a handful of hyperscalers, and it sells the Ethernet switching silicon that connects those accelerators into clusters. The companion DalalBytes landscape piece, The Compute Share Wars at dalalbytes.com/blog/compute-share-wars.html, maps how that design layer came to sit under the custom silicon era.
| Metric | FY2024 | FY2025 | Q3 FY2026 |
|---|---|---|---|
| Total revenue ($M) | 51,574 | 63,887 | 29,591 |
| Semiconductor solutions ($M) | 30,096 | 36,858 | 20,839 |
| Infrastructure software ($M) | 21,478 | 27,029 | 8,752 |
| GAAP operating income ($M) | 13,463 | 25,484 | 16,008 |
| GAAP diluted EPS | $1.23 | $4.77 | $2.68 |
| Free cash flow ($M) | 19,949 | 26,914 | 13,700 |
- Fiscal 2025 revenue grew 24% to $63.9B.
- The first nine months of fiscal 2026 already exceed all of fiscal 2025 revenue.
- Q3 fiscal 2026 revenue grew 86% year over year to $29.6B.
- Fiscal Q4 2026 revenue is guided to about $34.8B, up 93%.
- On that guide, fiscal 2026 revenue lands near $105.9B, up about 66%.
How does Broadcom make money?
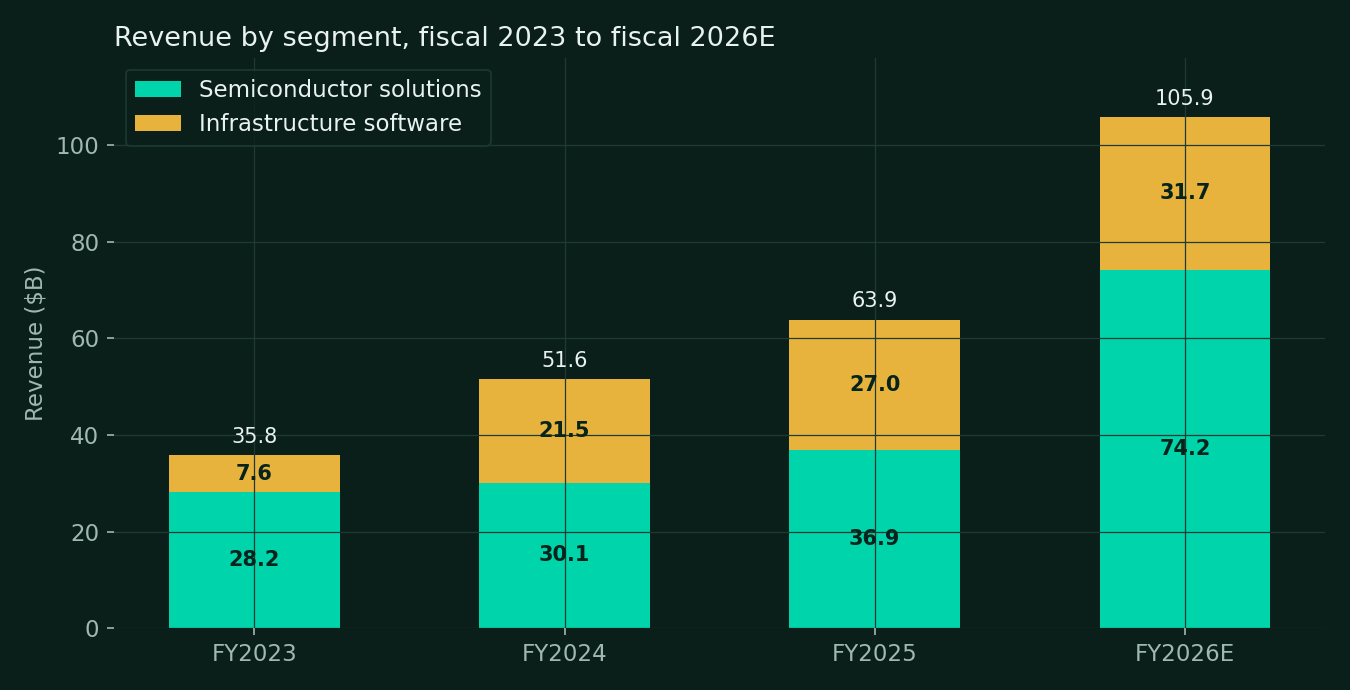
Broadcom reports two segments. Each segment carries its own economics, and the segment note in the filings is the cleanest window into the company.
| Segment ($M) | FY2023 | FY2024 | FY2025 | Q1 FY2026 | Q2 FY2026 | Q3 FY2026 |
|---|---|---|---|---|---|---|
| Semiconductor revenue | 28,182 | 30,096 | 36,858 | 12,515 | 15,009 | 20,839 |
| Semiconductor operating income | 16,486 | 16,759 | 21,232 | 7,503 | 9,281 | 12,770 |
| Semiconductor operating margin | 58.5% | 55.7% | 57.6% | 59.9% | 61.8% | 61.3% |
| Infrastructure software revenue | 7,637 | 21,478 | 27,029 | 6,796 | 7,178 | 8,752 |
| Software operating income | 5,639 | 13,977 | 20,765 | 5,323 | 5,647 | 7,325 |
| Software operating margin | 73.8% | 65.1% | 76.8% | 78.3% | 78.7% | 83.7% |
| Total revenue | 35,819 | 51,574 | 63,887 | 19,311 | 22,187 | 29,591 |
Inside semiconductor solutions
- Custom AI accelerators (XPU). Co-designed chips for six core customers, covered in section 4.
- AI networking. Tomahawk and Jericho Ethernet switch silicon, PCIe switches, retimers and network interface cards that connect accelerators inside and across data centers.
- Broadband. Set-top box and broadband access silicon, a mature cash line tied to cable and telecom spending.
- Server storage. RAID controllers, HBAs and storage silicon sold into enterprise servers.
- Wireless. RF filters, power amplifiers and Wi-Fi and Bluetooth combo chips for premium smartphones, with Apple the anchor customer.
- Industrial and other. Factory automation and resale lines, small and steady.
Inside infrastructure software
- VMware. The dominant piece, sold as the VMware Cloud Foundation full-stack subscription.
- CA Technologies. Mainframe and enterprise software, acquired in 2018, now folded into segment reporting.
- Symantec enterprise. Security software, acquired in 2019, also folded into segment reporting.
- Broadcom no longer breaks out the software pieces individually in its segment note.
- The segment's economics are covered in section 6.
Concentration, in the company's own words
- The fiscal 2025 Form 10-K states that the top five end customers accounted for about 40% of net revenue in fiscal 2025 and fiscal 2024.
- Distributors accounted for 48% of net revenue in both years.
- The same filing warns that the loss of any top five end customer could be material.
- Concentration is therefore a disclosed fact of the structure, not an analyst invention.
How big is the AI business and how fast is it growing?
AI semiconductor revenue is the fastest-growing large revenue line in the industry. The series below is built from company earnings releases, with guidance marked where the quarter has not yet reported.
| Quarter | AI revenue ($B) | Note |
|---|---|---|
| Q4 FY2024 | 3.7 | Reported |
| Q1 FY2025 | 4.1 | Reported |
| Q2 FY2025 | 4.4 | Reported |
| Q3 FY2025 | 5.2 | Reported |
| Q4 FY2025 | 6.5 | Reported, up 74% |
| Q1 FY2026 | 8.4 | Reported. The guide was $8.2B |
| Q2 FY2026 | 10.8 | Reported, up 143% |
| Q3 FY2026 | 16.7 | Reported, up 221% year over year |
| Q4 FY2026E | 21.7 | Guided, up 236% |
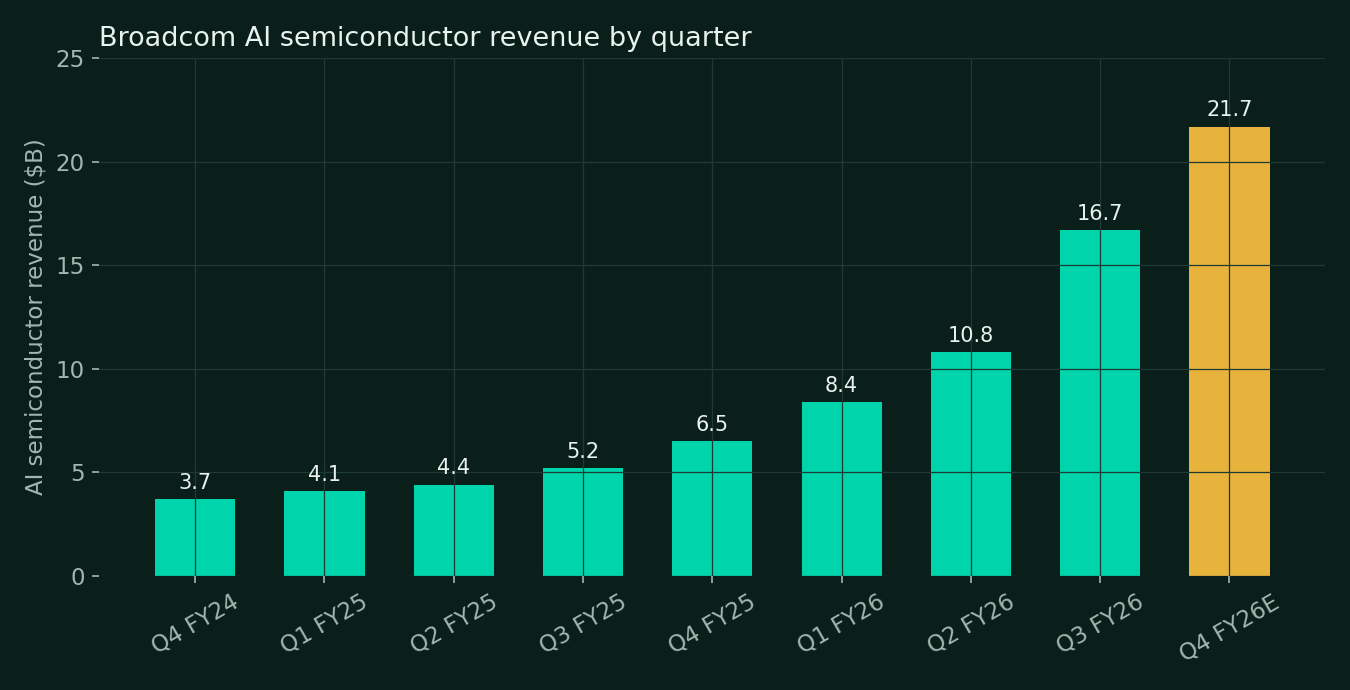
- Fiscal 2025 AI revenue summed to about $20.2B.
- The four fiscal 2026 quarters sum to about $57.6B at guidance.
- Management raised the fiscal 2026 AI guide to about $58B on the fiscal Q3 call.
- AI was 56% of total revenue in Q3 fiscal 2026.
- Custom XPUs were 73% of Q3 AI revenue, about $12.2B.
- AI networking was the other 27%, about $4.5B.
- XPU shipments grew more than 3.5 times year over year in Q3.
- Management stated that supply for the guided ramps is secured.
- The constraint management names is customer deployment timing, including power delivery to sites.
- AI backlog stood at about $73B on an 18-month delivery view when the fiscal Q1 2026 call was held.
- AI bookings in Q2 fiscal 2026 alone were above $30B.
- Consolidated gross margin is guided to about 73% in Q4 fiscal 2026, down from 78% a year earlier.
- The margin dilution comes from memory content inside XPUs, which Broadcom passes through at low markup.
- Management declined to update the AI guide quarterly from here, a style change worth noting in the roadmap audit.
The gigawatt arithmetic
- AI deployments are now contracted in gigawatts of data center capacity, not just in chips.
- Anthropic is guided at 1 GW of Ironwood capacity in 2026 and 5 GW in 2027.
- OpenAI is guided at 1.3 GW in 2027 and more than 5 GW in 2028.
- Meta is guided at 3 GW of custom chip deployments through the end of 2028.
- The XPV financing platform discussed in section 5 targets more than 20 GW for OpenAI and Anthropic combined by the end of 2028.
- Each gigawatt of deployed capacity carries an accelerator, networking and recurring replacement content that Broadcom supplies in part.
Who buys Broadcom's custom AI chips?
Six core XPU customers now carry the AI growth story. Each one is a different kind of evidence.
- The longest XPU relationship, running through successive Tensor Processing Unit generations.
- A long-term multi-generation TPU agreement was announced in April 2026.
- Broadcom also supplies Tomahawk switching into Google clusters.
- The diversification risk is real and quantified in section 8.
- Macquarie estimates Broadcom's share of Google TPU program revenue steps down as MediaTek takes parts of newer TPU generations.
Anthropic
- Named an XPU customer in September 2025, with a $10B order disclosed by management in December 2025.
- Anthropic runs on Google TPUs built with Broadcom, including the Ironwood generation.
- Guided deployments run 1 GW in 2026 and 5 GW in 2027, with line of sight to 10 GW more in 2028.
- Management expects Anthropic to be its largest XPU customer in fiscal 2027.
- Part of the Anthropic ramp is financed through the XPV platform described below.
OpenAI
- Announced as a custom chip partner in October 2025 with a 10 GW ambition.
- The first in-house design, code-named Jalapeno, is guided at 1.3 GW in 2027 and more than 5 GW in 2028.
- Management expects OpenAI to be its second-largest XPU customer by fiscal 2028.
- Part of the OpenAI ramp is also financed through XPV.
Meta
- The MTIA accelerator program is Broadcom's second-longest hyperscaler XPU relationship.
- Guided custom chip deployments reach 3 GW through the end of 2028.
- Meta also buys Broadcom networking silicon at scale.
Microsoft and Amazon, the contrast cases
- Microsoft runs its own Maia accelerator program.
- Design-partner roles on Maia sit mainly with Marvell per industry reporting, and Microsoft is not counted among Broadcom's six core XPU customers.
- Amazon designs Trainium with Marvell under a multi-year agreement announced in December 2024.
- The contrast matters. Two of the five largest AI buyers chose the number two design partner.
- Broadcom's answer is depth at the other three, plus Anthropic and OpenAI.
ByteDance and the two unnamed customers
- Press reporting since 2024 has linked ByteDance to Broadcom-designed AI chips, subject to export rules.
- Management counts six core XPU customers in fiscal 2026.
- Two of the six are unnamed, and management has cited $6B of orders connected to newer customer programs.
- Every additional named customer lowers the concentration risk priced into the bear case.
Apple, the wireless anchor
- Apple is the anchor customer of the wireless line, buying RF filters, front-end content and connectivity chips.
- Apple and Broadcom announced new multi-year supply agreements in June 2023 covering 5G radio frequency components and other connectivity parts.
- Apple is not named as a customer in the fiscal 2025 Form 10-K.
- Press reporting since 2024 describes Apple-designed Wi-Fi and Bluetooth silicon replacing Broadcom content in some devices.
- Wireless is a small and shrinking share of the story next to AI, but it is the clearest working example of a Broadcom customer insourcing a Broadcom socket.
The XPV financing platform
- Broadcom's AI XPV platform, built with Apollo and Blackstone, finances AI data center capacity for customers.
- The platform targets more than 20 GW of deployments for OpenAI and Anthropic by the end of 2028.
- A first tranche of $35B closed in June 2026.
- The structure turns Broadcom from a chip supplier into part of the financing stack behind its own demand.
- Two of the largest XPU customers are financed with Broadcom's involvement.
- That circularity is a named risk in section 13, not a footnote.
What does VMware contribute?
- Infrastructure software revenue was $7.6B in fiscal 2023, before VMware.
- The segment reached $21.5B in fiscal 2024 with VMware consolidated from November 22, 2023.
- Fiscal 2025 delivered $27.0B, and fiscal 2026 runs at about $32B on nine-month actuals plus a guided Q4.
- Segment operating margin recovered to 76.8% in fiscal 2025 and 83.7% in Q3 fiscal 2026.
- The fiscal 2024 margin dip to 65.1% marks the VMware integration year, and the recovery marks its completion.
| Software metric | FY2024 | FY2025 | 9M FY2026 |
|---|---|---|---|
| Segment revenue ($M) | 21,478 | 27,029 | 22,726 |
| Segment operating income ($M) | 13,977 | 20,765 | 18,295 |
| Segment operating margin | 65.1% | 76.8% | 80.5% |
| Share of total revenue | 41.6% | 42.3% | 32.0% |
- The product strategy is one stack. VMware Cloud Foundation bundles compute, storage, networking and management into a single subscription.
- Broadcom ended perpetual licenses and moved the base to subscription bundles, a change that drew public pushback from some customers and regulators in Europe.
- Company statements through 2025 describe the large majority of top VMware customers converting to the VCF subscription stack.
- Renewals run on multi-year terms, which is what makes the segment an annuity rather than a license business.
- The segment's share of revenue falls as AI grows, from 42% in fiscal 2025 to about 30% in fiscal 2026.
- Its share of segment operating profit remains near half, which is the point of owning it.
- Software cash flows are what let the semiconductor arm swing at six customers without balance-sheet strain.
How strong is the moat?
The moat is the distance between designing a chip and shipping one. A custom accelerator takes two to three years from architecture to production silicon, and Broadcom's value is that it has run that loop more times, for more of the largest buyers, than any rival design house. Each generation deepens the loop. The customer's architects work inside Broadcom's physical IP libraries, its SerDes, its packaging flows and its test programs, so switching designers means re-running years of co-development, not changing a vendor code.
The second wall is the fabric. AI clusters are networks first and chip collections second, and Broadcom's Tomahawk and Jericho lines set the Ethernet roadmap those clusters are built on. A customer can move an accelerator program and still buy Broadcom switching, which is why the networking 27% of AI revenue may prove more durable than the XPU 73%.
The third wall is the software annuity of section 6. VMware's installed base renews because the cost of leaving exceeds the cost of the bundle for the largest estates, and that cash funds the design wins of the next cycle.
- Counterpoint Research estimates Broadcom holds about 60% of the AI ASIC design-partner market by 2027, from about 64% in 2024.
- JPMorgan estimates Broadcom at 80 to 85% of the high-end custom design market, a different and narrower basis.
- No rival has shipped custom AI accelerators for as many hyperscalers at production scale.
- The design bench is also a queue. New customers wait for senior design teams, which rations supply in Broadcom's favor.
- The moat is narrowest at the customer boundary, where the buyers are the best-funded engineering organizations on earth.
- That boundary is tested in section 8 and section 13.
Who else designs custom AI chips?
| Player | Position | Evidence |
|---|---|---|
| Broadcom | Design leader | About 60% design-partner share by 2027 per Counterpoint |
| Marvell | Number two | About 12% share falling to about 8% by 2027 per Counterpoint |
| Alchip | Rising challenger | Share rising to about 18% by 2027 per Counterpoint |
| MediaTek | Google's second source | Takes parts of newer TPU generations per Macquarie estimates |
| NVIDIA | The merchant alternative | Owns the merchant GPU market the XPUs compete against |
| Customer-owned tooling | The structural rival | Hyperscalers internalize design work over time |
- Counterpoint projects top-ten ASIC vendor shipments triple between 2024 and 2027 and pass data center GPU shipments in 2028.
- The design layer grows even in the estimates that shrink Broadcom's share of it.
- Macquarie estimates Broadcom's share of Google TPU program revenue at about 95% in 2026, about 80% in 2027 and about 65% by 2028.
- That is a managed step-down inside a growing program, not a lost socket, and the dollars still grow.
- Marvell holds Amazon Trainium and works with Microsoft, the two hyperscalers Broadcom does not anchor.
- Marvell's own concentration is higher, with a small number of programs carrying its AI revenue.
- Alchip's rise shows the design market can support a third scaled player, fed largely by TSMC's ecosystem.
- TSMC fabricates nearly all top-ten ASIC vendor volume, so foundry access is a shared dependency, not a Broadcom edge.
- Customer-owned tooling is the slow risk. Each hyperscaler hires silicon staff every year, and design flows get easier to internalize at the margin.
- The Apple wireless case in section 5 shows what insourcing looks like when it arrives.
- The counter-evidence is the customer count. The bench grew from three XPU customers to six while the insourcing narrative ran.
What do the financial statements show?
| Fiscal year ($M) | FY2023 | FY2024 | FY2025 |
|---|---|---|---|
| Revenue | 35,819 | 51,574 | 63,887 |
| Of which products | 28,949 | 34,960 | 44,847 |
| Of which subscriptions and services | 6,870 | 16,614 | 19,040 |
| Gross profit | 24,690 | 32,509 | 43,294 |
| GAAP operating income | 16,207 | 13,463 | 25,484 |
| Net income | 14,082 | 5,895 | 23,126 |
| Operating cash flow | 18,085 | 20,572 | 27,537 |
| Capital expenditure | 486 | 623 | 623 |
| Free cash flow | 17,599 | 19,949 | 26,914 |
| Research and development | 5,253 | 9,310 | 10,977 |
| Stock-based compensation | 2,171 | 5,741 | 7,568 |
| Dividends paid | 9,032 | 10,751 | 11,142 |
| Buybacks | 0 | 0 | 2,450 |
| Diluted shares (M) | 4,272 | 4,778 | 4,853 |
| GAAP diluted EPS | $3.30 | $1.23 | $4.77 |
- Fiscal 2024 GAAP profit was depressed by VMware deal costs, restructuring and amortization, not by operations.
- Unallocated acquisition amortization ran $8.1B in fiscal 2025 and stock compensation $7.6B.
- Those two lines explain most of the gap between GAAP EPS of $4.77 and non-GAAP EPS of about $6.93 in fiscal 2025.
- Adjusted EBITDA was $43.0B in fiscal 2025, up 35%, per the fiscal Q4 2025 release.
- Capital intensity is tiny. Capex was 1.0% of fiscal 2025 revenue because TSMC and its packaging partners own the fabs.
- Free cash flow conversion is the financial signature of the model.
- Q3 fiscal 2026 free cash flow was $13.7B in a single quarter, 46% of revenue.
- Stock compensation at $7.6B in fiscal 2025 is 28% of free cash flow, the honest deduction from the fortress story.
- Diluted share count rose from 4,272M in fiscal 2023 to 4,853M in fiscal 2025 as VMware deal stock and equity awards landed.
- The buyback pace of fiscal 2026, covered in section 11, is the first serious attempt to reverse that drift.
Has management delivered what it promised?
The fair test of this management team is not whether its targets are large. It is whether the large targets it set in public have arrived. On AI, the record is unusually clean. The fiscal 2024 AI target set in December 2023 was about $10B, and the year delivered about $12.2B. Through fiscal 2025 the quarterly guides were raised more often than they were missed, and the pattern has held in fiscal 2026, where the Q1 guide of $8.2B delivered $8.4B and the Q2 guide of $10.7B delivered $10.8B.
The forward targets are a different category of claim. The fiscal 2027 guide moved from a $60B to $90B serviceable market framing in December 2024, to above $100B on the fiscal Q1 2026 call, to about $115B on the fiscal Q3 2026 call. The fiscal 2028 guide of about $230B with EPS above $30 is two months old and rests on gigawatt deployments that have not yet broken ground in full. The audit posture of this report is to bank the delivery record and discount the distance. Our base case pays for about 89% of the fiscal 2028 AI guide. The bear case pays for barely half of it.
VMware passes the same test on segment evidence. At the deal's announcement in May 2022, Broadcom guided to about $8.5B of added pro forma EBITDA within three years of close. The infrastructure software segment printed $20.8B of operating income in fiscal 2025, its second full year, on $27.0B of revenue. VMware alone is no longer broken out, so the audit grades the segment, not the asset, and the segment delivered.
| Commitment | Set when | Status at Nov 1, 2026 |
|---|---|---|
| Fiscal 2024 AI revenue of about $10B | December 2023 | Delivered about $12.2B. Beaten |
| Q1 FY2026 AI revenue of $8.2B | December 2025 | Delivered $8.4B. Beaten |
| Q2 FY2026 AI revenue of $10.7B | March 2026 | Delivered $10.8B. Beaten |
| Fiscal 2026 AI revenue of $56B, then $58B | June 2026, raised September 2026 | Tracking at $57.6B on the Q4 guide |
| VMware adds about $8.5B of pro forma EBITDA in three years | May 2022 | Segment operating income $20.8B in fiscal 2025. Delivered on segment evidence |
| Fiscal 2027 AI revenue above $100B, then about $115B | March 2026, raised September 2026 | Pending. Decomposed by gigawatt ramps in section 4 |
| Fiscal 2028 AI revenue of about $230B and EPS above $30 | September 2026 | Pending. The largest claim on the page |
| Tomahawk cadence, 51.2 Tbps to 102.4 Tbps | 2022 to 2025 | Tomahawk 6 in volume production per the fiscal Q3 2026 call |
| XPU customer count growth from three to six | 2023 to 2026 | Delivered, with two customers still unnamed |
| Fifteenth consecutive annual dividend increase | December 2025 | Delivered. $0.65 per quarter for fiscal 2026 |
- The delivery record buys credibility for the fiscal 2027 guide.
- It does not automatically buy the fiscal 2028 guide, which doubles the target again.
- Two style changes deserve weight. Management will no longer update the AI guide quarterly, and the newest guides are denominated in gigawatts and customer ramps rather than in orders.
- Both changes move the burden of proof from the order book to deployment execution at customer sites.
How is the balance sheet funded and what comes back to shareholders?
| Item | Value | As of |
|---|---|---|
| Cash and equivalents | $24.0B | August 2, 2026 |
| Current debt | $2.3B | August 2, 2026 |
| Long-term debt | $57.2B | August 2, 2026 |
| Gross debt | $59.4B | August 2, 2026 |
| Net debt | $35.4B | August 2, 2026 |
| Goodwill | $97.8B | August 2, 2026 |
| Intangible assets, net | $26.3B | August 2, 2026 |
| Total assets | $188.2B | August 2, 2026 |
- The debt stack is the residue of the VMware acquisition, which closed with about $61B of equity value and about $8B of assumed debt.
- Gross debt peaked above $70B after the deal and has been paid down every year since.
- In fiscal 2026 the company issued $4.5B of notes in January and repaid or redeemed $3.7B in Q1 and $1.25B in Q2.
- Net debt of $35.4B is about 0.8 times fiscal 2025 adjusted EBITDA of $43.0B, and falls fast on the fiscal 2026 cash run rate.
- The fortress deduction is asset quality. Goodwill and intangibles of $124B sit on $188B of total assets, the price of building the company by acquisition.
- The April 2025 buyback authorization of $10B was extended through December 2026 and raised to $11B.
- A further $10B program was authorized in March 2026 with the fiscal Q1 release.
- Execution was front-loaded. Repurchases were $7.85B in Q1 fiscal 2026 and $0.6B in Q2, then paused in Q3 as cash went to debt.
- Total program repurchases in the first nine months of fiscal 2026 were $8.45B against $9.28B of dividends paid.
- The dividend is $0.65 per quarter for fiscal 2026, up 10%, a $2.60 annual rate and the fifteenth consecutive annual increase.
- At $326.08 the dividend yield is about 0.8%. This is a compounding vehicle, not an income vehicle.
- Stock compensation of $7.6B in fiscal 2025 remains the quiet offset to the buyback, at about 28% of free cash flow.
What is Broadcom worth by fiscal 2029?
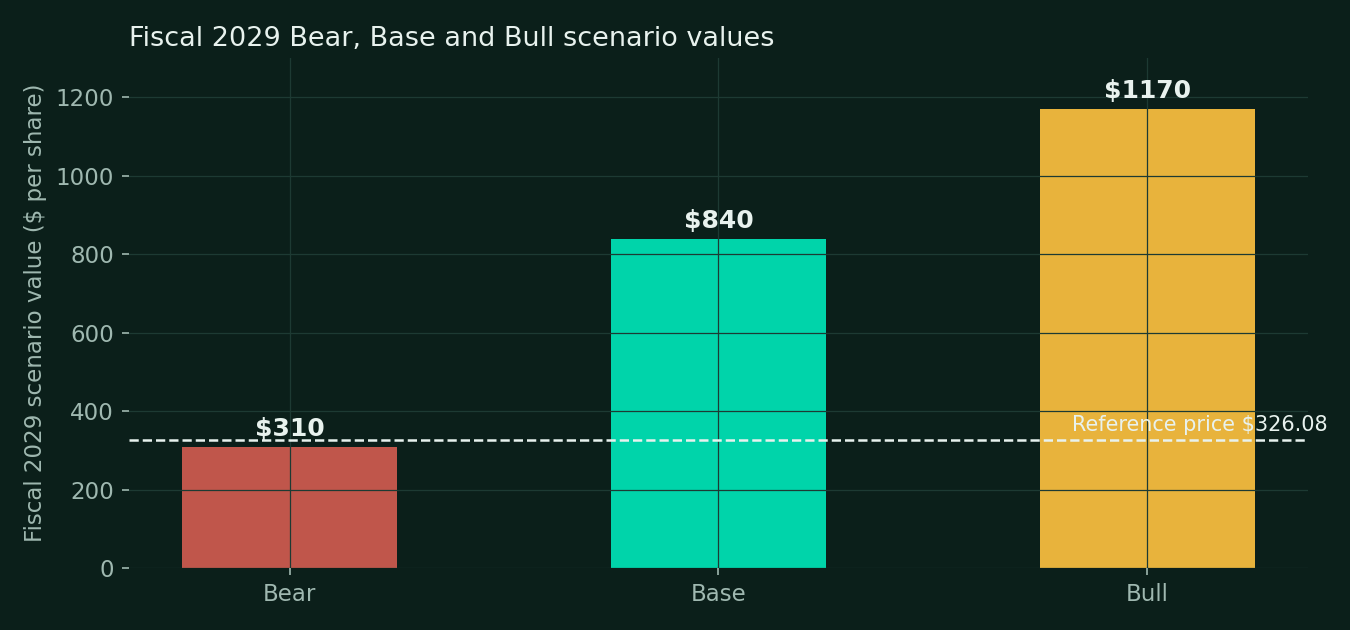
The reference price of $326.08 pays about 68 times trailing GAAP earnings, a number that says little because $8.1B of acquisition amortization runs through the GAAP lines. On non-GAAP earnings the same price pays about 27 times our fiscal 2026 estimate of about $12.20, about 18 times our fiscal 2027 base estimate of about $18, and about 11 times our fiscal 2028 base estimate of about $29. The stock is priced like a maybe on numbers management states like a schedule. The scenarios below price that gap three ways.
| Fiscal 2029 | Bear | Base | Bull |
|---|---|---|---|
| AI revenue ($B) | 140 | 262 | 330 |
| Non-AI semiconductor ($B) | 16 | 18.5 | 20 |
| Infrastructure software ($B) | 36 | 41 | 44 |
| Total revenue ($B) | 192 | 321.5 | 394 |
| Non-GAAP operating margin | 57% | 61% | 63% |
| Non-GAAP EPS | $19.40 | $35.00 | $45.00 |
| Exit multiple | 16x | 24x | 26x |
| Scenario value | $310 | $840 | $1170 |
The bear case, $310
- Gigawatt ramps slip on power and packaging, and fiscal 2027 AI lands near $85B instead of $115B.
- Two anchor customers pause in fiscal 2028 to digest capacity, and AI growth flattens near $140B by fiscal 2029.
- VMware renewals meet bundle resistance and software growth slows to low single digits.
- Gross margin dilution from memory-heavy XPUs does not reverse, and the exit multiple compresses to 16 times.
- The bear case is a delivery disappointment, not a broken business. It values the stock near today's price.
The base case, $840
- Fiscal 2027 AI revenue lands at $112B, a small haircut to the $115B guide.
- Fiscal 2028 AI revenue lands at $205B against the $230B guide, with deployment timing the stated reason for the gap.
- Fiscal 2029 AI growth decelerates to about 28% as the base gets large.
- Software compounds at high single digits on VCF renewals.
- Operating margin holds near 61% as networking mix offsets XPU memory dilution.
- The skeptic case stands beside this base. It says the fiscal 2028 guide is a marketing number, that two customers financed through XPV make reported demand partly circular, and that a single generation moved to MediaTek or in-house tooling breaks the compounding. Section 13 prices those claims.
- Our answer is the asymmetry. The base case can miss the fiscal 2028 guide by 11% and still clear the current price by a wide margin.
The bull case, $1170
- The fiscal 2027 and fiscal 2028 guides land whole, and XPV capacity above 20 GW converts into fiscal 2029 shipments.
- A seventh XPU customer reaches production and the customer count keeps climbing.
- AI revenue reaches $330B in fiscal 2029 with networking holding its share of the mix.
- Operating margin expands back toward 63% and the market keeps a 26 times multiple on $45 of EPS.
What could break the story?
The concentration risk is the report's central fact, and it runs in both directions. Six customers carry the AI guide, the top five end customers are about 40% of total revenue, and the two fastest ramps, Anthropic and OpenAI, are young companies whose deployments are partly financed through a platform Broadcom itself co-built. If one anchor customer slows, the guide does not bend. It breaks, because there is no long tail of smaller AI buyers underneath to absorb the gap.
The second risk is that the customers become the competitor. Every hyperscaler on the bench employs silicon teams whose job is to need Broadcom less each generation. Google's work with MediaTek on newer TPU generations is the visible leading edge, and Apple's in-house connectivity chips show the end state in a smaller socket. Customer-owned tooling does not need to win outright to hurt. It only needs to shave Broadcom's share of each program the way the Macquarie path in section 8 describes.
The third risk is arithmetic. A fiscal 2028 AI guide of $230B requires power, packaging and construction to arrive on a schedule Broadcom does not control, a point management itself makes when it names customer deployment timing as the constraint. Gross margin is already guided down from 78% to about 73% on memory content. A digestion year, of the kind every infrastructure cycle eventually produces, lands directly on the most crowded trade in the market.
- Export controls on advanced accelerators into China can remove reported ByteDance-linked demand and tighten supply chains.
- Key-man risk is real. The strategy, the deals and the customer relationships run through Hock Tan personally.
- The balance sheet carries $59.4B of gross debt into any downturn, with $124B of goodwill and intangibles above it.
- European regulatory scrutiny of VMware licensing has already produced complaints and could produce remedies.
- The stock's beta near 1.5 and its October 30 fall of 5.5% in one session describe the volatility a holder must underwrite.
Where does the stock sit today?
- Reference price is the Friday October 30, 2026 close of $326.08, sourced from Finnhub.
- The stock fell 5.48% that day from a prior close of $345.00, on sector-wide AI selling.
- The 52-week range runs from $289.96 on March 30, 2026 to an intraday $495 in June 2026.
- The reference price sits about 34% below the June 2026 high.
- The price trades below its 50-day average near $352.81 and its 200-day average near $367.67.
- Finnhub lists a trailing P/E near 40 on its non-GAAP-based EPS series and a beta near 1.49.
- Reported consensus targets sit far above the price, with a MarketBeat average near $530.
- The technical picture is a de-rating in progress. The fundamental picture in sections 4 and 10 is a guide being raised into that de-rating.
- Fiscal Q4 2026 results are the next hard checkpoint. The date is not yet company-announced, as flagged in the verdict note.
Frequently asked questions
What exactly does Broadcom sell into AI data centers?
Broadcom sells two things into AI clusters. Custom XPU accelerators designed with six core customers delivered about $12.2B of the $16.7B AI revenue in Q3 fiscal 2026, and Ethernet switching and interconnect led by Tomahawk delivered the rest. AI revenue guides to $21.7B in Q4.
How big is VMware inside Broadcom now?
Infrastructure software delivered $27B of revenue in fiscal 2025 at a segment operating margin of about 77%, and it runs at about $32B in fiscal 2026. The segment is mostly VMware, sold as the VMware Cloud Foundation subscription stack to the largest enterprise customers on multi-year renewals.
What has to go right for the fiscal 2028 guide?
The fiscal 2028 guide needs AI revenue of about $230B and EPS above $30. That needs Anthropic and OpenAI deployments above 20 GW combined to ship on time, Google and Meta ramps to hold, and gross margin near 73% while memory-heavy XPUs grow as a share of mix.
Sources and disclosures
- Broadcom Form 10-K for fiscal 2025, filed December 18, 2025, for segment history, concentration disclosures and the consolidated statements.
- Broadcom Forms 10-Q for fiscal Q1, Q2 and Q3 2026, for quarterly segment detail, the balance sheet and buyback authorizations.
- Broadcom earnings releases for fiscal Q4 2025, Q1 2026, Q2 2026 and Q3 2026, furnished on Form 8-K, for the AI revenue series and guidance.
- Broadcom earnings call reporting for the fiscal Q3 2026 call of September 2, 2026, for the fiscal 2027 and fiscal 2028 AI guides, the customer gigawatt ramps and the XPV platform.
- Counterpoint Research design-partner share estimates and JPMorgan and Macquarie estimates as cited in the DalalBytes landscape piece, The Compute Share Wars, published November 1, 2026 at https://dalalbytes.com/blog/compute-share-wars.html.
- Finnhub market data for the October 30, 2026 close and the 52-week range.
- Disclosures. DalalBytes holds no position in Broadcom (AVGO) at publication. This report is research and opinion for educational purposes only and is not investment advice, a recommendation, or a solicitation. Prices and estimates are as of November 1, 2026, and will age. Verify figures against company filings before acting on them.