
Frequently asked questions
Is Asian Paints (ASIANPAINT) a buy at current prices?
DalalBytes rates Asian Paints Selective Positive at 65/100. FY26 revenue rose 4.95% to Rs 35,584 crore, PAT after minority rose 17.9% to Rs 4,325 crore, free cash flow was a record Rs 5,604 crore, and the balance sheet carries an IND AAA / Stable rating. The deductions are a Q2 FY27 PBDIT margin of 15.6% against an 18 to 20% guide band, decorative share down from about 59% to about 52% on Elara estimates, and a price of 45.3 times earnings at Rs 2,302.
What are Asian Paints' FY2029 price targets?
DalalBytes' FY2029 targets (year ending March 2029) are bear Rs 1,450, base Rs 2,600 and bull Rs 3,800, from a Rs 2,302 reference price (NSE close, October 29, 2026). Bear: 6% revenue CAGR, 11.0% PAT margin, EPS Rs 48.6 at 30 times. Base: 11% CAGR, 13.5% margin, EPS Rs 68.5 at 38 times. Bull: 15% CAGR, 15.0% margin, EPS Rs 84.6 at 45 times.
What is the verdict on Asian Paints?
Asian Paints is still the best business in Indian paints, and it is no longer growing like one. FY26 revenue rose 4.95% to Rs 35,584 crore and PAT after minority interest rose 17.9% to Rs 4,325 crore, a recovery year after FY25, when sales fell 4.5% and profit fell by a third. On a three year view, sales compounded at 1% and profit at 2%. The defence is real: roughly half of the organised decorative market, about 1.7 lakh retail touchpoints, free cash flow of Rs 5,604 crore in FY26 at 129% conversion, a 61% payout, and an IND AAA / Stable rating.
The selective part arrived on the day of this report. Q2 FY27, published October 29, 2026, printed a consolidated PBDIT margin of 15.6%, down 202 basis points, below the 18 to 20% guidance band, as roughly 25% raw material inflation met the limits of pricing. Birla Opus now owns the second largest decorative capacity in India at 1,332 million litres, JSW has bought Dulux, and decorative share has eased from about 59% to about 52% on Elara estimates. At Rs 2,302, 45.3 times earnings, the base case offers about 13% over three years.
How did Asian Paints start?
The company began on February 1, 1942 in a garage in Gaiwadi, Girgaon, Mumbai, as The Asian Oil and Paint Company, founded by four friends: Champaklal H. Choksey, Chimanlal N. Choksi, Suryakant C. Dani and Arvind R. Vakil. War and the Quit India movement had triggered a temporary ban on paint imports, leaving Shalimar and expensive foreign brands. The founding insight was distribution: small packs, small towns, and the dealer at the centre of the system. It became India's largest paint maker by 1967, a public limited company in 1973, and listed in 1982. The Choksey family sold its 13.7% stake and exited in 1997; three founding families remain promoters at 52.65%, with professional management running the company since the late 1960s.
What does Asian Paints sell, technically?
Decorative paint is a formulated chemical system: a polymer binder (acrylic or vinyl acetate ethylene emulsion), titanium dioxide for opacity, extenders, water or solvents, and additives for flow, drying and durability. Material cost runs at 55 to 58% of sales, which is why input inflation dominates the P and L. The price ladder runs Royale at the premium end, Apex and Ultima in the exterior and mid tiers, Apcolite at the core, and Tractor and Utsav at the economy end. New products contributed about 17% of revenue in Q4 FY26.
The dealer tinting machine is the quiet technology: bases and colourants at the counter mix thousands of shades on the spot, cutting inventory and locking the dealer into the system, which is why Birla Opus gives tinting machines free. Beautiful Homes sells finished rooms rather than cans. Backward integration is the newest layer: VAE emulsion at Dahej (150,000 tonnes per annum, live from September 17, 2026, with the VAM plant still under construction) and white cement at Fujairah (265,000 tonnes per annum, live from October 12, 2025) attack the two biggest bought in cost lines.
How do the segments split?
| Segment (disclosed sales, Rs cr) | Q1 FY27 | YoY | Q2 FY27 | YoY |
|---|---|---|---|---|
| International business | 936.5 | +27.2% | 1,095.6 | +29.5% |
| PPG Asian Paints (industrial JV) | 651.9 | +13.5% | 794.8 | +33.7% |
| Asian Paints PPG (industrial JV) | 372.9 | +21.3% | 374.5 | +28.0% |
| Bath fittings | 84.9 | -4.3% | 94.0 | +18.5% |
| Kitchen business | 108.0 | +10.1% | 110.3 | +13.0% |
| White Teak (lighting) | 18.7 | -7.4% | 23.3 | -11.8% |
| Weatherseal (windows) | 16.9 | +11.2% | 20.3 | -1.8% |
Decorative is about 84% of FY26 revenue on the third party summary used in the full report; the PPG joint venture sales are disclosed but equity accounted, not consolidated. Industrial value grew 31.8% in Q2 FY27, the fastest disclosed line, and the PPG joint ventures were renewed in FY26 for a further 15 years. International sales grew 29.5% in Q2 FY27 while its PBT fell 31% to Rs 52.7 crore. Home decor disclosed about Rs 248 crore of sales in the quarter against consolidated net sales of Rs 9,954 crore, with kitchen still loss making.
How did the 2026 cost shock hit margins?
| Period | Gross margin (consol) | PBDIT margin (consol) | What happened |
|---|---|---|---|
| Q2 FY26 | 43.2% | 17.7% | Raw material deflation of 1.6% |
| Q4 FY26 | 44.8% | 19.4% | Peak deflation quarter; channel upstocking ahead of hikes |
| Q1 FY27 | 43.6% | 20.6% | About 25% material inflation, offset by low cost inventory, pricing and mix |
| Q2 FY27 | Not in release summaries | 15.6% | Full inflation impact lands; margin down 202 bps, below the guide band |
The company implemented about 12% of calibrated price hikes in Q1 FY27, realising a weighted average increase of about 7 to 8%, absorbed part of the inflation to protect demand, and announced a further staggered round on October 29, 2026. H1 FY27 PBDIT margin was 18.2%, inside the band, because Q1 still carried low cost inventory. Q2 is the first clean print of the new cost base.
What do the financials show?
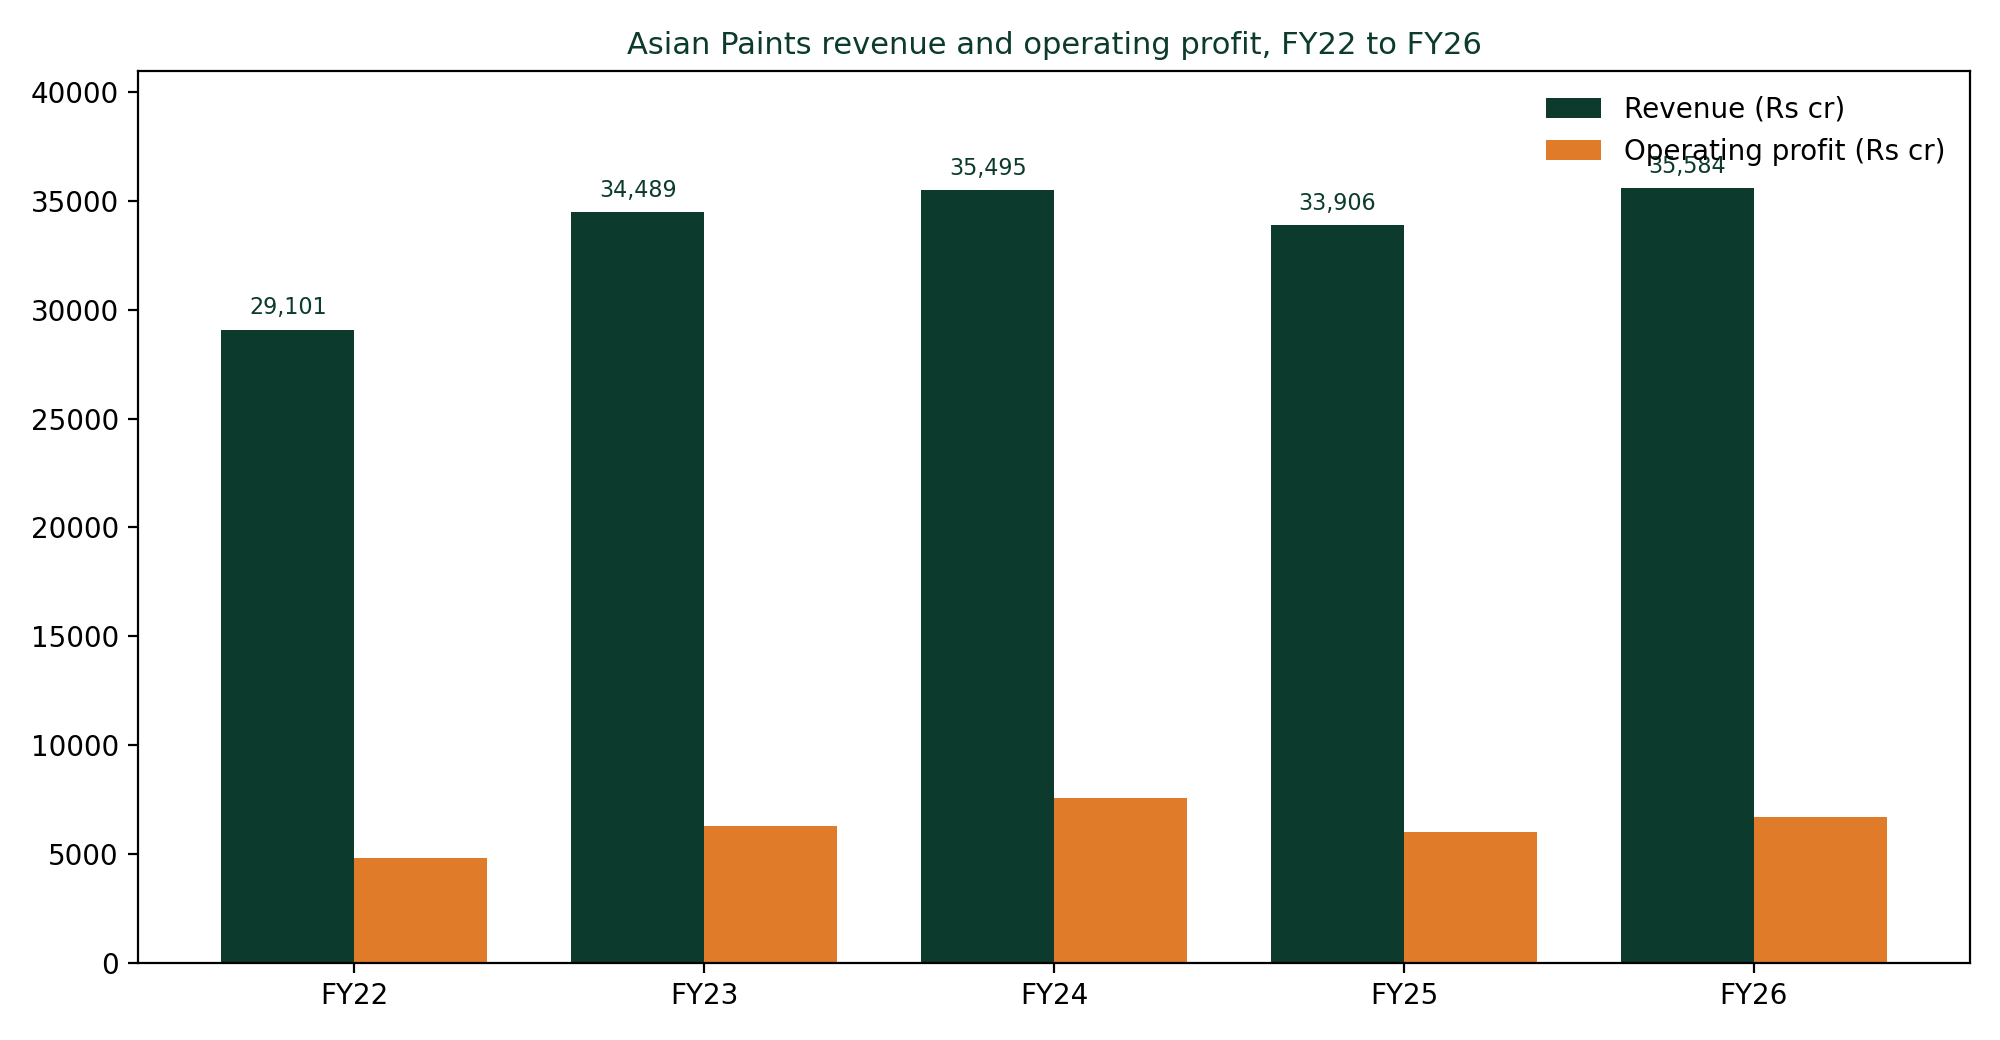
| Fiscal year (ends March) | Revenue (Rs cr) | YoY | Operating profit (Rs cr) | Operating margin | PAT (Rs cr, pre minority) | EPS (Rs) | Operating cash flow (Rs cr) | Free cash flow (Rs cr) |
|---|---|---|---|---|---|---|---|---|
| FY22 | 29,101 | +34.0% | 4,804 | 17% | 3,085 | 31.59 | 986 | 475 |
| FY23 | 34,489 | +18.5% | 6,260 | 18% | 4,195 | 42.81 | 4,193 | 2,774 |
| FY24 | 35,495 | +2.9% | 7,585 | 21% | 5,558 | 56.92 | 6,104 | 3,613 |
| FY25 | 33,906 | -4.5% | 6,006 | 18% | 3,710 | 38.23 | 4,424 | 2,604 |
| FY26 | 35,584 | +4.95% | 6,700 | 19% | 4,395 | 45.09 | 7,088 | 5,604 |
Consolidated figures, Screener.in series, October 2026. PAT after minority interest for FY26 was Rs 4,325 crore, up 17.9%. Revenue in FY26 is barely above FY24, and EPS is still 21% below FY24. ROCE ran 29, 34, 38, 26 and 26 percent across FY22 to FY26, with ROE near 22%.
How strong are the balance sheet and cash flow?
| Metric | FY22 | FY23 | FY24 | FY25 | FY26 |
|---|---|---|---|---|---|
| Cash from operations (Rs cr) | 986 | 4,193 | 6,104 | 4,424 | 7,088 |
| Free cash flow (Rs cr) | 475 | 2,774 | 3,613 | 2,604 | 5,604 |
| CFO to EBITDA conversion | 45% | 91% | 105% | 97% | 129% |
| Dividend per share (Rs) | 19.15 | 25.65 | 33.30 | 24.80 | 27.50 |
| Dividend payout | 61% | 60% | 58% | 65% | 61% |
India Ratings describes a net cash record of over a decade and rates the facilities IND AAA / Stable. Inventory days fell to 118 from 142 in FY26 and the cash cycle to 84 days from 107. The qualifications: borrowings rose from Rs 2,290 crore to Rs 3,929 crore in FY26 funding Dahej, and depreciation rose from Rs 853 crore in FY24 to Rs 1,229 crore in FY26. FY22 is the warning exhibit, when operating cash flow collapsed to Rs 986 crore in the last input shock even as profit held up. Capital allocation runs dividend first, then backward integration capex, then small home decor acquisitions; no buyback was found in the sources searched for FY22 to October 2026.
Has management delivered on its roadmap?
| Commitment | Stated | Delivered | Grade |
|---|---|---|---|
| FY27 volume and margin guide | Volume growth 8 to 10%, EBITDA margin 18 to 20% | H1 margin 18.2% inside band; Q2 volume 6.4% and margin 15.6% below it | Partial, Q2 missed both |
| Dahej VAE plant | 150,000 TPA VAE, total project Rs 3,250 cr after a Rs 690 cr increase | VAE Phase 1 live from Sep 17, 2026; VAM still under construction | Delivered late and over budget, Phase 1 |
| White cement, Fujairah | 265,000 TPA, about Rs 550 cr, 60:40 JV | Commercial production from Oct 12, 2025 | Delivered |
| PPG joint ventures | Renewal of the 15 year terms | Renewed in FY26 for a further 15 years | Delivered |
| Home decor scale | 8 to 10% of decorative revenue within three years, from about 4% | About Rs 248 cr of disclosed sales in Q2 FY27; kitchen loss making | Not on track |
Costed, dated engineering promises get delivered; market promises slip. On governance: Amit Syngle is MD and CEO since 2020, promoters held 52.65% in September 2026 with no pledging disclosed, the board had 12 directors with six independent at March 2026, and Sudhir Sitapati joined as an independent director in May 2026. No named CEO successor appears in the sources reviewed.
Who competes with Asian Paints?
| Player | FY26 sales (Rs cr) | Position in Oct 2026 |
|---|---|---|
| Asian Paints | 35,584 | Leader, roughly half of organised decorative; share down from high 50s |
| Berger Paints | 11,880 | Listed number two; promoters 74.98% |
| Kansai Nerolac | 8,052 | Industrial coatings leader |
| Birla Opus (Grasim) | Not separately listed | Launched Feb 2024; 1,332 MLPA capacity, second largest; share est. 5 to 10% plus |
| JSW Dulux (ex Akzo Nobel India) | About 3,591 TTM | Dulux under JSW from Dec 2025; combined target about 10% share |
| Indigo Paints | 1,405 | Decorative challenger, premium niches |
Grasim launched Birla Opus in February 2024 behind a Rs 10,000 crore programme, 97.3% spent by November 2025, with free tinting machines, higher dealer margins and about 300,000 contractors onboarded before launch. Its CEO Rakshit Hargave resigned effective December 5, 2025, a move Reuters called a negative surprise. JSW Paints completed its Akzo Nobel India acquisition on December 10, 2025 at an enterprise value of about EUR 1.4 billion, renamed JSW Dulux in March 2026. Paint share moves slowly and then sticks, which is why the dealer and capacity war matters more than any single quarter.
What is Asian Paints worth against peers?
At Rs 2,302 (October 29, 2026): P/E 45.3 times, P/B 10.3 times, dividend yield 1.19%, book value Rs 223 a share.
| Company | Price (Rs, Oct 29, 2026) | P/E | ROE | ROCE | Note |
|---|---|---|---|---|---|
| Asian Paints | 2,302 | 45.3x | 21.8% | 26.3% | Leader; premium over Berger has largely closed |
| Berger Paints | 467 | 44.2x | 17.3% | 21.6% | Near identical multiple, lower returns |
| Kansai Nerolac | 179 | 22 to 25x | 8.8% | 12.0% | Industrial heavy; profit base distorted by other income |
| Indigo Paints | 1,012 | 29.3x | 13.7% | 18.6% | Small, decorative only |
For two decades Asian Paints traded at a large premium to Berger and earned it with a wide ROE gap. In October 2026 the two trade at almost the same multiple while the returns gap persists. FY2029 scenarios: bear Rs 1,450 (6% CAGR, 11.0% margin, EPS Rs 48.6 at 30x), base Rs 2,600 (11% CAGR, 13.5% margin, EPS Rs 68.5 at 38x), bull Rs 3,800 (15% CAGR, 15.0% margin, EPS Rs 84.6 at 45x). The base case is a bond like return from a great franchise, which is the definition of a selective rating.
What are the key risks?
Share loss first: decorative share eased from about 59% to about 52% in the year to March 2025 on Elara estimates, and every point lost in a repaint market compounds for a decade. Raw materials second: material cost at 55 to 58% of sales, about 25% inflation in Q1 FY27, and management guiding to little relief. Then capacity overhang (industry organised capacity set to nearly double by FY27 on broker estimates), price hike elasticity against a challenger that can choose not to follow, home decor execution, and valuation: 45.3 times earnings, below the 50 and 200 day averages, with the 52 week high 23% above the price. Q3 FY27, the festive quarter at the new prices, is the next checkpoint.
Sources: company results and releases (Q2 FY27, October 29, 2026; Q1 FY27, July 29, 2026; FY26 results, May 2026; Dahej VAE commissioning filing, September 2026; white cement start, October 2025); Screener.in consolidated page, crawled October 29, 2026; broker and agency material labelled as estimates (Axis Securities, Motilal Oswal, JM Financial, Elara Securities, India Ratings); Grasim and Reuters Birla Opus coverage; AkzoNobel completion release and JSW Dulux rename; Hindu BusinessLine company history. Share and capacity figures attributed to broker estimates are estimates, not company audited numbers.
© 2026 DalalBytes Research · For educational purposes only. Not investment advice.