

What is the verdict on Amazon?
74/100. Positive. The largest cloud is re-accelerating into a guided two-year run above 40% growth, the commerce engine compounds underneath, and the stock just paid a doubt discount for a free cash flow hole that management chose to dig.
What would change the score. The score rises if AWS growth holds at or above 40% through 2027 while trailing free cash flow turns positive and management puts a number on 2027 capex near the 2026 level, and it falls if AWS growth slips below 30%, if gross debt climbs past $225B without a dated free cash flow inflection, or if the Anthropic stake converts into listed equity worth materially less than its $238.7B carrying value.
| 74/100 | DalalBytes score |
| $240.35 | Reference price. October 30 2026 close |
| $2.6T | Market cap at about 10800M shares |
| $125 / $305 / $455 | Fiscal 2029 bear / base / bull |
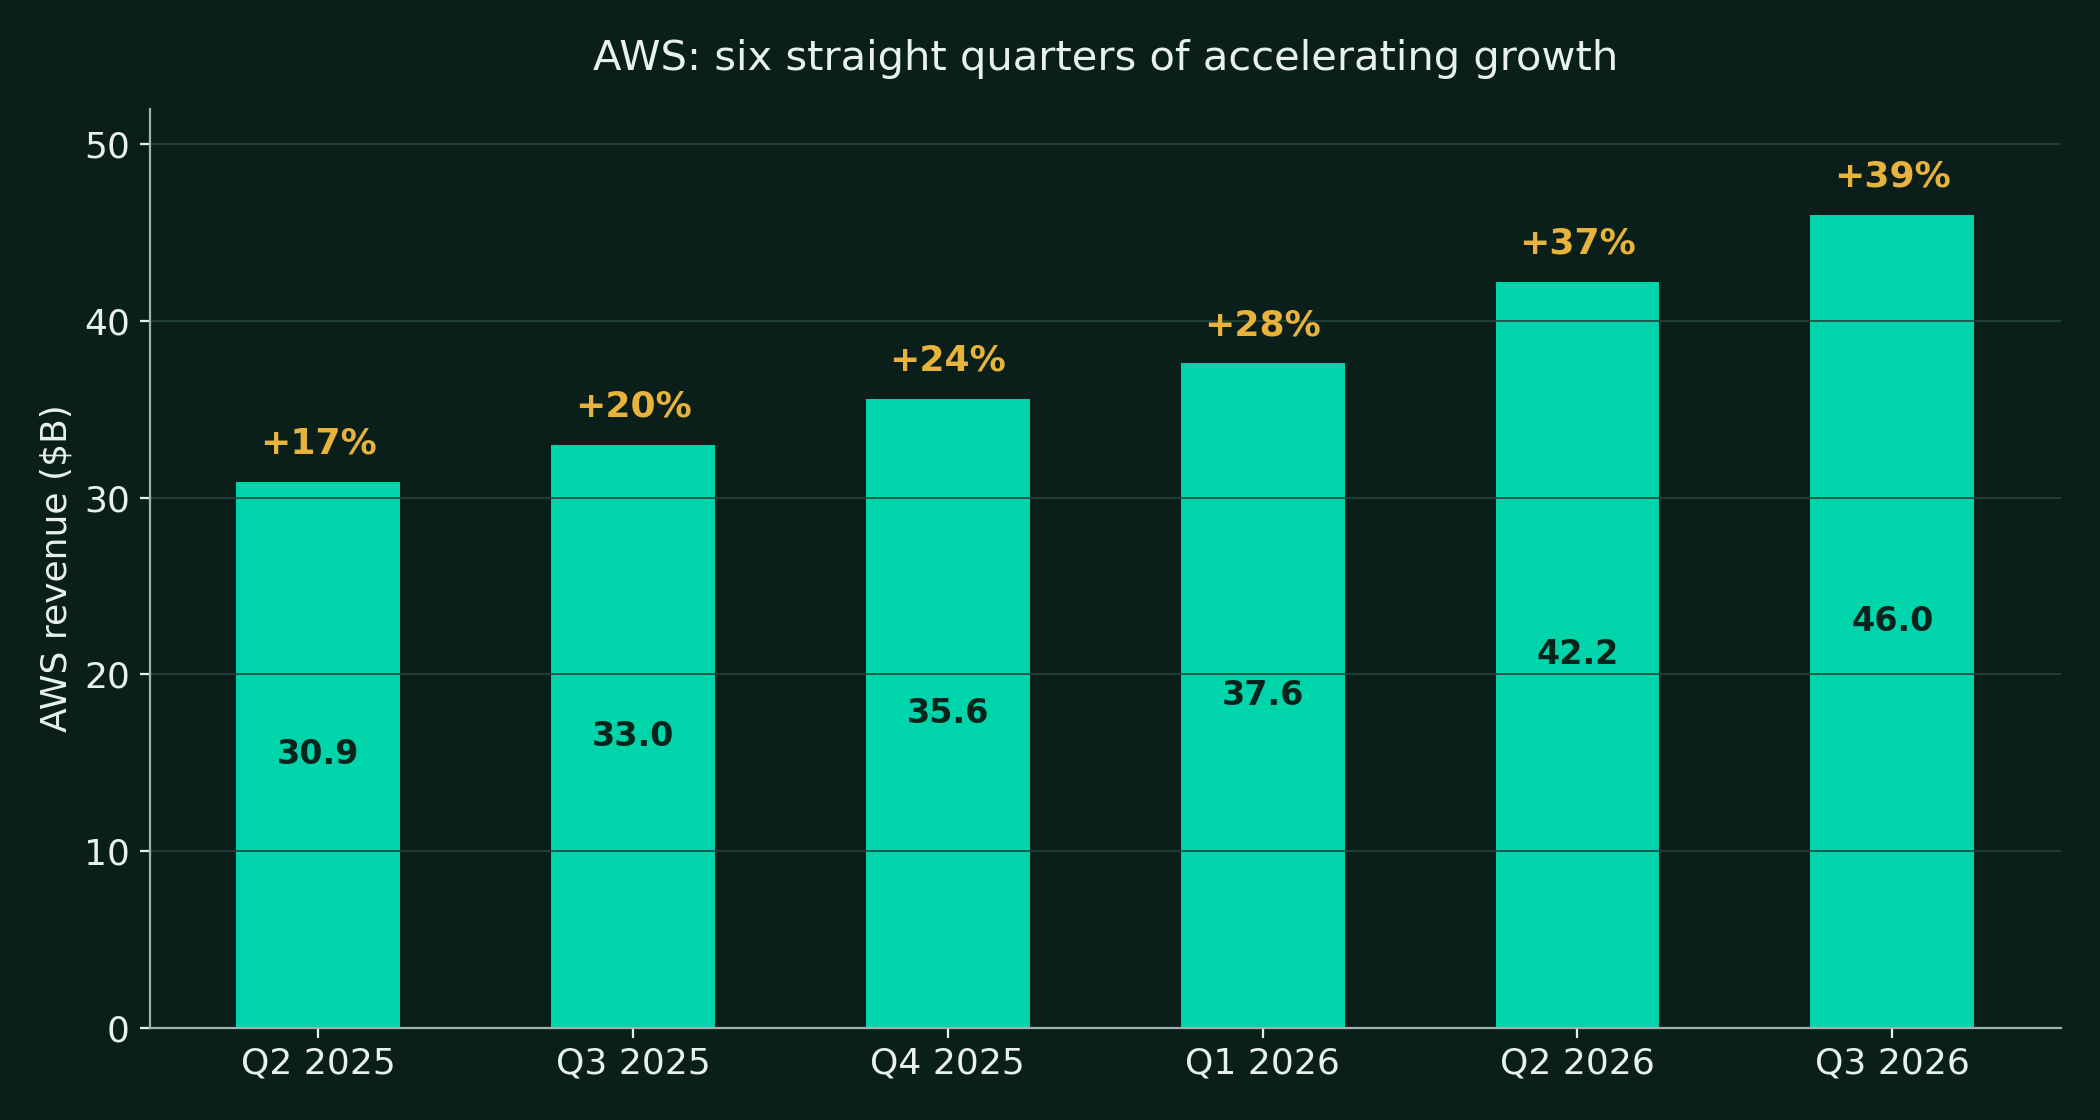
Amazon today is three businesses at three different speeds. AWS is the profit engine, growing 39.3% in the third quarter of 2026 with a $578B backlog and a management guide that points above 40% growth for two more years. The stores engine is the cash flywheel, where North America margins have ground from 4.2% in 2023 to 7.7% in the latest quarter on logistics density and a $76B advertising business. The third business is the balance sheet itself, which now carries a $238.7B Anthropic position and $180.9B of gross debt face value, two numbers that would have been unthinkable for this company three years ago.
The argument is not whether the buildout is large. It is whether the returns arrive before the financing does. Operating cash flow set a record at $168.3B over the twelve months to September 2026, and Amazon spent about $210.7B of it on property and equipment, funding the gap with $135.8B of debt proceeds in nine months. The bet management is making, in plain terms, is that contracted AI demand converts to high-margin revenue faster than the debt stack needs refinancing. The backlog says the demand is real. The unquantified 2027 capex guide says the spending is not done.
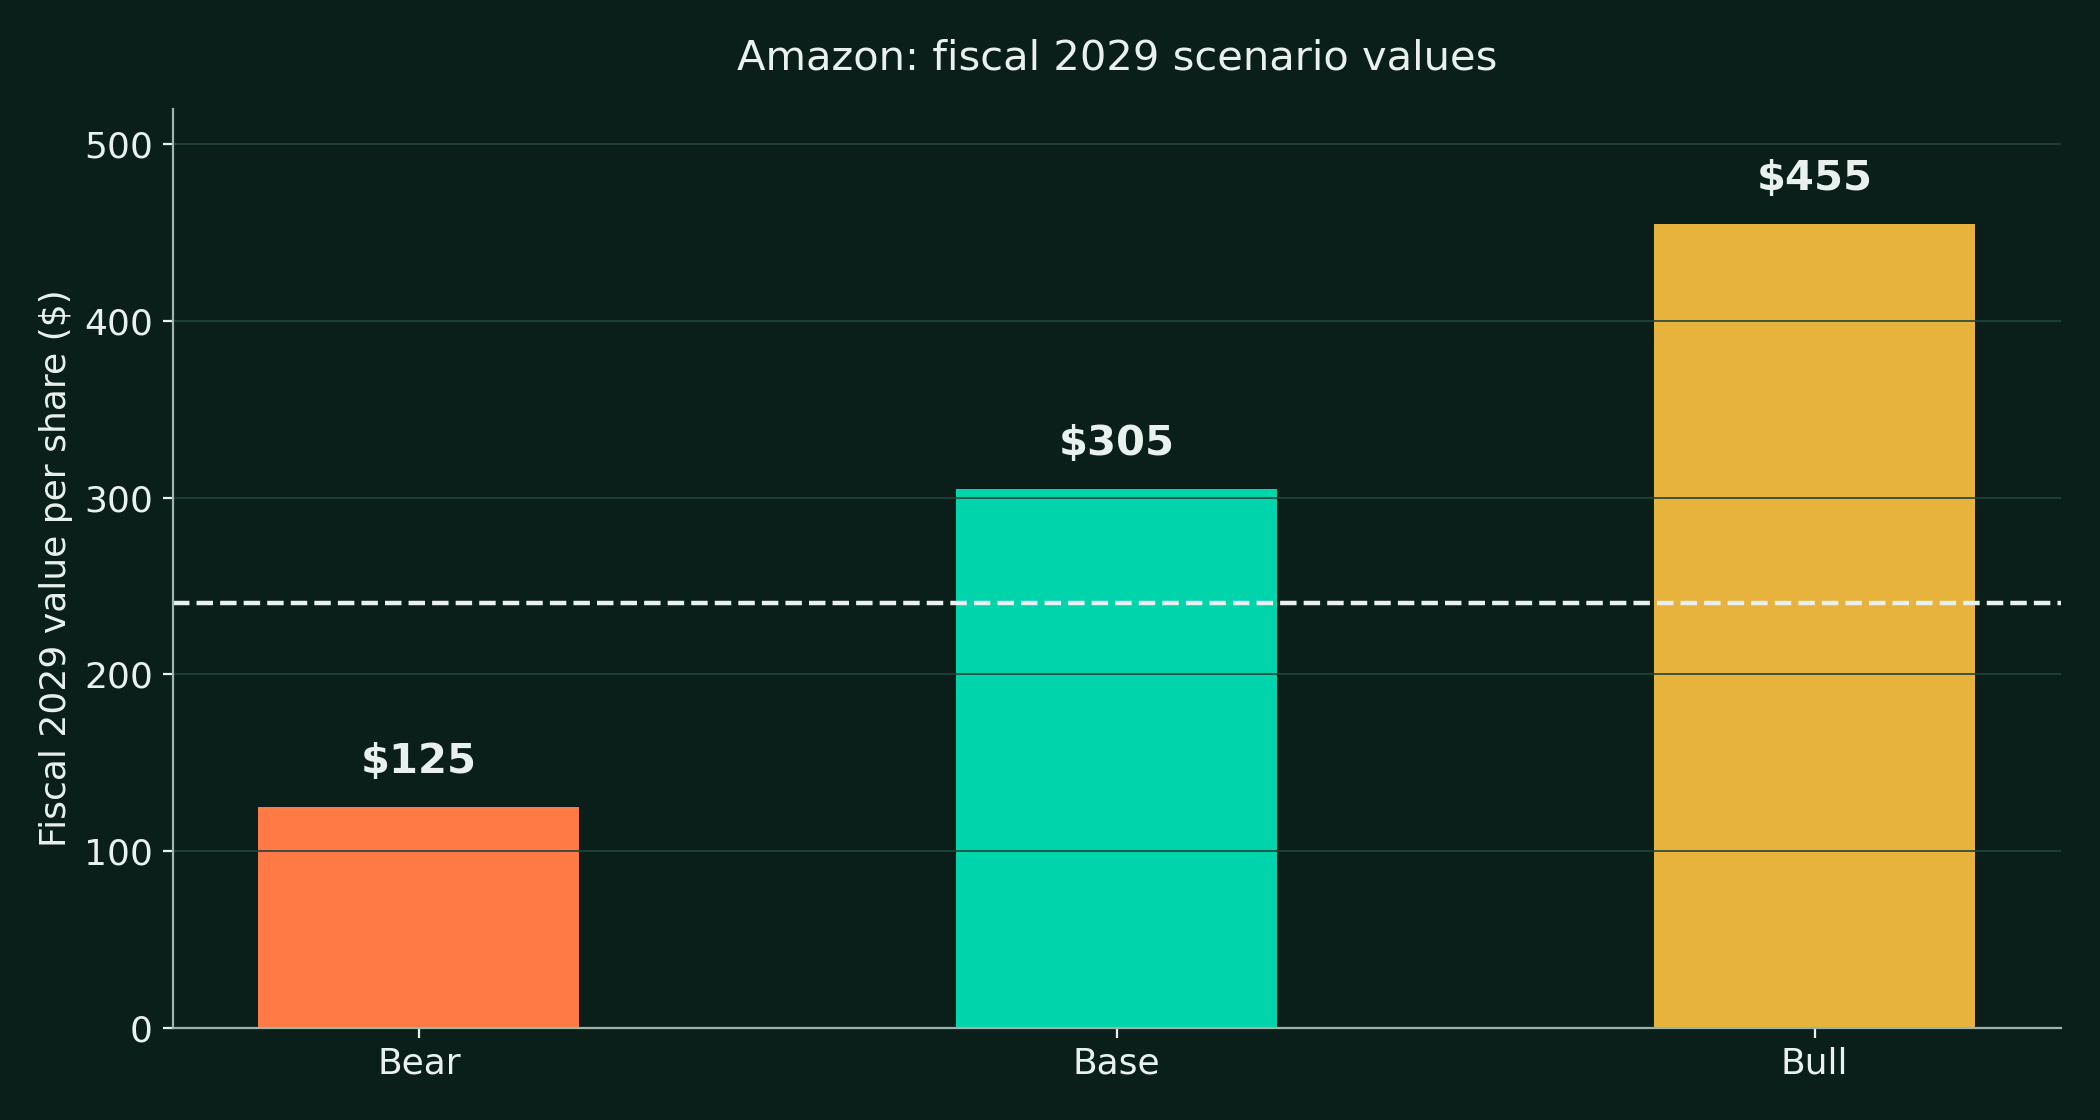
Our base case pays the AWS guide in full for 2027 and 2028, lets growth decelerate in 2029, and still lands at $305, about 27% above the reference price. The bear case is a digestion case, not a collapse case. It values the stock near $125 if AWS growth halves and margins dilute on AI mix. That spread, delivered acceleration on one side and a financing overhang on the other, is the report in one paragraph.
The price basis of this report
This report uses the Friday October 30, 2026 Nasdaq close of $240.35 throughout. Amazon has not yet announced the date of its fourth quarter 2026 results as of November 2, 2026. The company's pattern is late January to early February, but no date is company-confirmed, so none is printed here as settled.
What is Amazon in one page?
Amazon.com, Inc. is based in Seattle, Washington, and trades on Nasdaq as AMZN. It reports on a calendar fiscal year. The company Bezos founded as an online bookstore now runs the largest cloud platform in the world, the largest online marketplace in the United States, the third force in digital advertising, a subscription bundle anchored by Prime, and a satellite business, Amazon Leo, that has not yet taken commercial revenue.
The modern Amazon runs on a flywheel with three heavy spokes. The marketplace draws sellers because the buyers are there, and third-party sellers now supply 61% of units sold. Prime converts buyers into subscribers who spend more and churn less. AWS converts the company's own infrastructure expertise into a rented utility that produces most of the profit. Advertising monetizes purchase intent at the exact point of decision, at margins the company does not disclose but every rival envies.
Andy Jassy, who ran AWS from its founding era, became CEO in July 2021. His tenure is defined by two moves. The first was a margin rebuild across the stores businesses, regionalizing the fulfillment network and pushing advertising and seller services up the mix. The second is the AI buildout now consuming the cash flow statement, the largest capital program in the company's history by a wide margin.
| Metric | FY2024 | FY2025 | Q3 2026 |
|---|---|---|---|
| Total net sales ($B) | 638.0 | 716.9 | 201.9 |
| AWS net sales ($B) | 107.6 | 128.7 | 46.0 |
| Operating income ($B) | 68.6 | 80.0 | 28.1 |
| Diluted EPS | $5.53 | $7.17 | $1.89 |
| Operating cash flow, trailing ($B) | 115.9 | 139.5 | 168.3 |
| Free cash flow, trailing ($B) | 38.2 | 11.2 | -42.4 |
- Fiscal 2025 net sales grew 12% to $716.9B, edging past Walmart's latest fiscal year total of $713.2B.
- Trailing twelve month net sales reached $797.4B at September 30, 2026.
- Trailing operating income reached $104.4B over the same twelve months.
- The United States produced $489.7B of the $638.0B of fiscal 2024 net sales, about 77%, per the Form 10-K geographic note.
- Headcount stood at 1,638,000 at September 30, 2026, up 4% year over year.
How does Amazon make money?
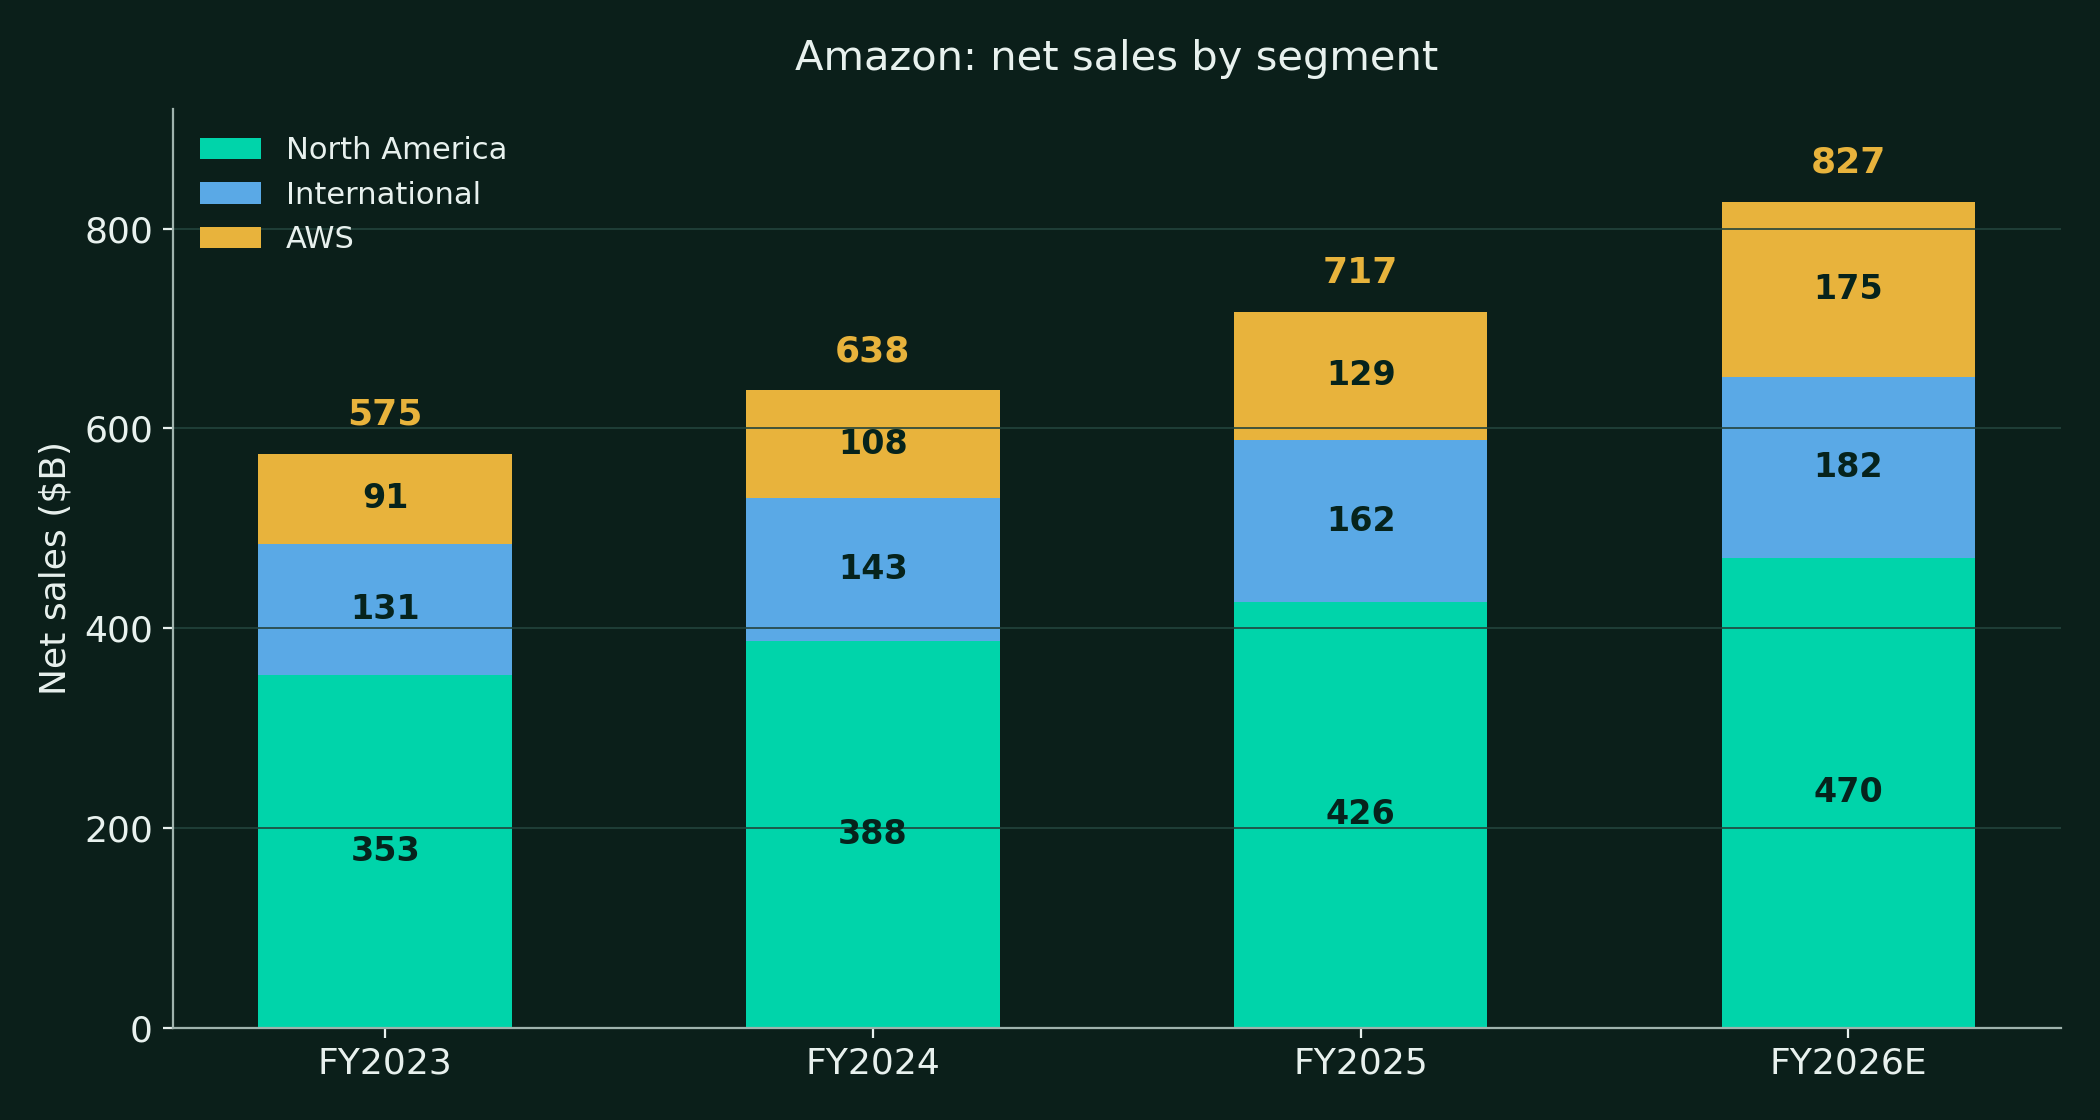
Amazon reports three segments. North America and International split the stores businesses by geography, and each contains retail, marketplace services, subscriptions and advertising for its region. AWS is reported whole. The segment note is the cleanest window into where the profit actually sits.
| Segment ($B) | FY2023 | FY2024 | FY2025 | Q1 2026 | Q2 2026 | Q3 2026 |
|---|---|---|---|---|---|---|
| North America sales | 352.8 | 387.5 | 426.3 | 104.1 | 116.2 | 112.9 |
| North America operating income | 14.9 | 25.0 | 29.6 | 8.3 | 9.1 | 8.7 |
| North America operating margin | 4.2% | 6.5% | 6.9% | 7.9% | 7.9% | 7.7% |
| International sales | 131.2 | 142.9 | 161.9 | 39.8 | 42.2 | 43.1 |
| International operating income | -2.7 | 3.8 | 4.7 | 1.4 | 1.7 | 1.6 |
| International operating margin | -2.1% | 2.7% | 2.9% | 3.6% | 4.1% | 3.7% |
| AWS sales | 90.8 | 107.6 | 128.7 | 37.6 | 42.2 | 46.0 |
| AWS operating income | 24.6 | 39.8 | 45.6 | 14.2 | 16.6 | 17.8 |
| AWS operating margin | 27.1% | 37.0% | 35.4% | 37.7% | 39.4% | 38.7% |
| Total net sales | 574.8 | 638.0 | 716.9 | 181.5 | 200.6 | 201.9 |
| Total operating income | 36.9 | 68.6 | 80.0 | 23.9 | 27.5 | 28.1 |
The seven revenue lines
| Revenue line ($B) | FY2025 | Share of sales |
|---|---|---|
| Online stores | 269.3 | 37.6% |
| Third-party seller services | 172.2 | 24.0% |
| AWS | 128.7 | 18.0% |
| Advertising services | 68.6 | 9.6% |
| Subscription services | 49.6 | 6.9% |
| Physical stores | 22.6 | 3.1% |
| Other | 5.9 | 0.8% |
- First-party retail is now the minority engine. Online and physical stores together are about 41% of sales.
- Seller services, subscriptions and advertising together are about 40% of sales and carry the mix shift that lifted company margins.
- Third-party sellers supplied 61% of units sold in Q3 2026, so the marketplace take rate applies to most of the catalog.
- Advertising grew 22% in fiscal 2025 to $68.6B, ahead of AWS growth of 20% that year.
- Advertising reached $76.1B on a trailing basis by Q2 2026.
- Subscription services of $49.6B are mostly Prime, with media subscriptions inside the same line.
The margin walk
- North America margin rose from 4.2% in fiscal 2023 to 6.9% in fiscal 2025 and 7.8% across the first nine months of 2026.
- The drivers are regionalized fulfillment, faster delivery on a denser network, and advertising mix.
- International swung from a $2.7B operating loss in fiscal 2023 to a $4.7B profit in fiscal 2025.
- International margin is still only about half the North America level, which is headroom and risk at once.
- AWS margin expanded from 27.1% in fiscal 2023 to the high thirties in 2026, even as AI services with structurally lower margins grew inside the mix.
- Management declined to guide the AWS margin on the Q3 2026 call, citing mix shift toward AI and component pricing.
What sits inside AWS?
AWS is 23% of company sales and 63% of company operating income in Q3 2026, on a $184B annualized run rate. Amazon does not split AWS revenue by service in its filings, so the decomposition below is built from company disclosures, earnings call statements and the pricing record, with each claim labeled by its source type.
Compute
- EC2 remains the core rental business, now split between merchant GPUs, Amazon's own Graviton CPUs and Trainium accelerators.
- Graviton is the default CPU story. The Q4 2025 release states that over 90% of the top 1,000 AWS customers use Graviton, at up to 40% better price performance than leading x86 processors.
- Graviton5 was introduced in the Q4 2025 release cycle.
- On the Q3 2026 call, management said revenue commitments for Graviton and for Trainium each grew more than 20 times year over year, and that customers saved over $2B in the quarter running workloads on Amazon silicon.
- AWS installs an AI accelerator about every 14 seconds, per the Q3 2026 call.
- Capacity is being reserved by customers in chunks that reach into 2027, 2028 and even 2029, with visibility eight to ten quarters out, per the same call.
The custom silicon business
- Trainium and Graviton together passed a $10B annual revenue run rate with triple-digit growth, per the Q4 2025 earnings release of February 5, 2026.
- Trainium2 is fully subscribed, with 1.4 million chips landed.
- Project Rainier, the anchor Trainium cluster, runs more than 500,000 Trainium2 chips and is described by the company as the world's largest operational AI compute cluster.
- Anthropic trains and serves Claude on Rainier and runs on more than one million Trainium2 chips in total, per Anthropic's S-1 disclosures.
- Trainium3 is delivering production workloads, and the company expected nearly all Trainium3 supply to be committed by mid-2026.
- Trainium4 is expected to start delivering in 2027, with 6 times the FP4 compute, 4 times the memory bandwidth and 2 times the HBM capacity of Trainium3.
- Inferentia is the inference line, sold as Inf1 and Inf2 instances for cost-sensitive serving.
| Chip | Role | Public price evidence |
|---|---|---|
| Trainium1 | Training, first generation | On-demand at $1.34 per chip-hour. Capacity Blocks near $0.60 |
| Trainium2 | Training and inference, current volume chip | Capacity Blocks only at about $2.235 per chip-hour. No on-demand list price |
| Trainium3 | Training, ramping | No public list price. Supply largely committed |
| Inferentia2 | Inference | $0.758 per hour for one chip. About $1.08 per chip at twelve chips |
- The pricing pattern is the signal. Trainium2 has no public on-demand price because Amazon allocates the capacity to committed customers rather than selling it by the hour.
- The day a Trainium on-demand list price appears, the capacity shortage inside AWS is over. That marker is named in the roadmap audit.
- Management said on the Q3 2026 call that most Trainium capacity stays internal to AWS, with external chip sales beginning from late 2027.
- External sales recognize revenue faster, while internal use produces more absolute revenue and free cash flow over a five to six year chip life, per the same call.
Storage and the quiet base
- S3 and the database fleet are the least visible and most durable part of AWS, sold on durability and switching costs rather than on AI headlines.
- Amazon does not disclose storage revenue, and no estimate is printed here.
- The strategic role is gravity. Data stored in AWS pulls compute toward it, which is why rivals price egress and migration credits the way they do.
AI services and Bedrock
- Bedrock is the model marketplace. The Q4 2025 release lists more than 20 fully managed models, including Nova, Anthropic, Google, OpenAI, NVIDIA, Qwen, Mistral AI, Stability AI, Cohere, MiniMax AI and Moonshot AI.
- More than 100,000 companies use Bedrock, per the Q4 2025 release.
- Bedrock token volume grew nearly 17 times year over year in Q3 2026, per the earnings call.
- Inference is well over half of AWS AI revenue, per the same call.
- Most large AI training and inference workloads on Bedrock already run on Trainium, per management.
- Jassy has said Bedrock could become as large as EC2 over time. That is a management ambition, labeled as such, not a forecast this report adopts.
- Nova 2 Lite and Nova 2 Pro are Amazon's own frontier-class models, with Nova Forge for customer fine-tuning and Nova Act for agents.
- Bedrock AgentCore, with Policy, Evaluations and Memory, is the agent runtime layer, and frontier agents for coding, security and DevOps shipped in the Q4 2025 cycle.
- Amazon Connect, the contact center product, runs at a $1B annualized rate growing over 30%, per the Q4 2025 release.
- AWS AI Factories, announced in the same cycle, take the AWS stack into customer and sovereign data centers.
How do Anthropic and OpenAI cut both ways?
The strangest structure in modern technology sits on Amazon's balance sheet. Amazon is simultaneously the landlord, the chip supplier and a major owner of the two leading independent AI labs, and each role pulls on the others.
The Anthropic position
- Amazon has invested $18.0B of cash in Anthropic.
- The first $8.0B went in as convertible notes across five tranches from Q3 2023 to Q4 2025.
- A further $10.0B bought nonvoting preferred stock in 2026, $5.0B of Series G-2 in April and $5.0B of Series H in May.
- Amazon holds 164 million nonvoting preferred shares, per the Q3 2026 Form 10-Q.
- The carrying value reached $238.7B at September 30, 2026, split between convertible notes at $146.2B and preferred stock at $92.5B.
- That carrying value equals about $22.11 per Amazon share.
- The unrealized gain sitting in accumulated other comprehensive income reached $140.3B at September 30, 2026.
- Gains booked through earnings from the position totaled about $80.1B from Q1 2025 to Q2 2026, including $53.4B of pre-tax non-operating income in Q2 2026 alone.
- Up to $15B more is available under a compute-linked financing facility, plus an option to invest up to $5B in future rounds.
The conversion cap, the open question
- The preferred stock converts into about 1.64B Anthropic shares at the IPO, roughly 10 to 11% of the company.
- The convertible notes carry $6.2B of principal and convert at fixed prices of $2.0928 and $5.0478 per share into about 1.84B more shares.
- The cap is the catch. No portion of the notes converts if Amazon would then hold more than 12% of Anthropic's capitalization, unless Amazon waives the cap.
- Blocked amounts are reissued as rollover notes marked to fair value, with conversion attempted again at each quarter end.
- At the $965B Series H valuation, the $238.7B carrying value implies economic exposure of about 19.7%, well above the 12% the cap allows in equity form.
- Amazon has never disclosed a percentage stake, holds no board seat and no observer seat.
- Anthropic lists on Nasdaq as ANT, with pricing targeted for the week of November 16, 2026, per its S-1.
- The converted stake is locked up until the earlier of the second trading day after Anthropic's Q3 2027 results or 365 days after the prospectus date.
- The waiver decision is therefore the single largest open item on Amazon's balance sheet. Waive, and Amazon holds a listed stake closer to its carrying value. Hold the cap, and a large part of the position stays in note form, marked to a value the equity market has not ratified.
The operating door runs the other way
- Anthropic's contractual compute obligations to Amazon total at least $110.0B payable between May 2026 and April 2036, non-cancelable, per its S-1.
- Anthropic sits inside the AWS backlog of $578B at September 30, 2026.
- Anthropic revenue reached $16.8B in Q3 2026 alone by the company's own statement to investors, from $4.6B in all of fiscal 2025.
- About 48% of Anthropic's first-half 2026 revenue flowed through the three hyperscaler marketplaces combined, with no Amazon-only split disclosed.
- The circularity is real and should be stated plainly. Amazon funds Anthropic, Anthropic contracts to buy Amazon compute, and the compute revenue lands in the AWS growth rate this report grades.
- The mitigant is that Anthropic's end demand is independently visible in its revenue line, which grew from $386M in fiscal 2024 to a run rate near $65B annualized by July 2026.
OpenAI, the second lab
- Amazon invested $50.0B in OpenAI Series C preferred stock during the first nine months of 2026, $21.3B of it in Q3.
- Up to $35.0B more is committed on contingent terms.
- OpenAI also appears in the Q4 2025 release highlights as a new AWS agreement counterparty.
- Combined, Amazon has committed about $103B of cash and commitments to two AI labs.
- The strategy reads as a hedge on the model layer. Whichever lab wins the frontier, Amazon sells the compute and clips an equity claim.
How healthy is the stores engine?
North America
- North America sales were $426.3B in fiscal 2025 and $333.2B across the first nine months of 2026.
- Segment operating margin reached 7.9% in both Q1 and Q2 2026 before a 7.7% print in Q3.
- The Q3 2026 comparison carries a distortion. Prime Day ran in Q2 2026 in most large countries and entirely in Q3 2025, and management estimates the shift cost about 400 basis points of year-over-year sales growth.
- On a like-for-like basis, management framed underlying sales growth nearer 17% than the reported 13% company-wide.
- Same-day and next-day delivery density is the operational moat input. The regionalized network put more inventory closer to more customers, cutting cost to serve while speeds rose.
International
- International sales were $161.9B in fiscal 2025 and $125.1B across the first nine months of 2026.
- The segment earned $4.7B in fiscal 2025 after losing $2.7B in fiscal 2023.
- Q3 2026 margin of 3.7% carried wage pressure in Europe and Japan, per management.
- Established markets carry the profit. Emerging markets still run at investment intensity.
Advertising, the hidden segment
- Advertising services revenue was $68.6B in fiscal 2025, $76.1B trailing by Q2 2026.
- Quarterly growth ran 24% in Q1 2026 and 26% in Q2 2026, then 12% excluding currency in Q3 2026.
- Management attributed about 850 basis points of the sequential slowdown to the Prime Day shift, plus lapping a Q3 2025 search marketing program change.
- Management guided advertising back to high-teens growth in Q4 2026 on a clean comparison.
- Advertising sits inside the North America and International segments, so its profit contribution is blended into segment margins and never broken out.
- Alexa for Shopping reached over 400 million customers in twelve months, with interactions up 570% year over year, and its shoppers spend about 50% more per order, per the Q3 2026 call.
- Management also said AI shopping agents are not yet driving meaningful shopping volume. Both claims are management statements from the same call, and the tension between them is the honest state of the art.
Amazon Leo and Globalstar
- Amazon Leo, the satellite business formerly called Kuiper, has launched more than 300 satellites since April 2025 and targets initial commercial service in 2026.
- Leo costs run through operating expense in Q4 2026 because capitalization starts in Q1 2027, one reason the Q4 operating income guide is wide.
- In April 2026 Amazon agreed to acquire Globalstar at an implied value of about $10.9B including debt, per the Q3 2026 Form 10-Q.
- The FCC approved the acquisition on October 27, 2026, and closing is expected in 2027.
- The deal adds mobile satellite spectrum, a direct-to-device path, and Apple's 20% stake in Globalstar, which Amazon plans to acquire while keeping Apple's satellite services running.
- Leo's costs sit inside the North America segment's economics, another drag the segment margin absorbs without disclosure.
How strong is the moat?
The moat is scale that compounds in three places at once. In commerce, the logistics network is the wall. Amazon delivers at speeds rivals cannot match profitably because its volume density per route is higher, and every year of density makes the next year cheaper to serve. Prime locks the demand side of that loop, and the marketplace locks the supply side, because sellers go where the buyers already are and 61% of units now come from third parties who pay Amazon for the privilege.
In cloud, the wall is switching cost measured in years. Workloads, data gravity and staff skills accumulate inside AWS, and the custom silicon program deepens the lock by making the cheapest capacity the capacity only AWS sells. A customer can rent NVIDIA GPUs from a dozen providers. It can rent Trainium only from Amazon, and Anthropic's $110.0B commitment shows what that exclusivity is worth when a frontier lab standardizes on it.
The third wall is the purchase-intent graph. Advertising rivals sell attention. Amazon sells the moment before a transaction, with the transaction data to prove the ad worked. That position cannot be bought with capex by a rival, because it is a byproduct of being the store.
- AWS holds the largest cloud revenue base at $46.0B in Q3 2026 and the highest cloud operating margin of the three hyperscalers at 38.7%.
- The moat is contested on growth rate, not on scale. Azure grew 48% and Google Cloud grew 103% in the same quarter, both off smaller bases.
- The silicon wall is the newest part of the moat and the least tested. Trainium has one anchor tenant at full scale.
- The commerce wall is the oldest part and the most durable. No rival has replicated the fulfillment density at national scale.
Who is gaining on Amazon, and where?
| Cloud, quarter ended Sep 30, 2026 | Revenue ($B) | Growth | Backlog ($B) |
|---|---|---|---|
| AWS | 46.0 | +39.3% | 578 |
| Microsoft Azure | 33.2 | +48% | 677 RPO |
| Google Cloud | 30.7 | +103% | 561 |
- Backlog definitions differ across the three companies and the figures are not directly comparable. Azure reports commercial remaining performance obligations, and Google includes commitments not yet recognized under its own definition.
- AWS holds the highest cloud operating margin of the three at 38.7% in Q3 2026.
- Capital spending runs the other way. Amazon guides to about $220B of cash capex in calendar 2026, against about $170B for Microsoft and a $195B to $205B fiscal 2026 guide for Alphabet. Capex definitions also differ, with some rivals including finance leases.
- Google Cloud's 103% growth is the quarter's shock number, driven by AI demand against a smaller base and a capacity ramp.
- Azure's first dollar disclosure of cloud revenue, $33.2B, puts the gap to AWS at about $12.8B a quarter and closing on growth rate.
- The neoclouds compete at the margin for overflow and price-sensitive AI work, at prices set partly by auction and spot markets rather than by list.
The merchant silicon alternative
- NVIDIA remains the default accelerator vendor, and every hyperscaler ASIC program is partly a negotiation against NVIDIA pricing.
- AMD holds the number two merchant GPU position and design wins at Meta and OpenAI.
- Broadcom and Marvell design custom chips for rivals. Amazon designs Trainium with Marvell under a multi-year agreement, which makes Marvell both a partner and a vendor to competitors.
- The custom share of accelerator shipments is the fastest-growing slice of the market, per the DalalBytes landscape piece, The Compute Share Wars.
Commerce and advertising rivals
- Walmart reported $713.2B of revenue for its latest fiscal year, just below Amazon's calendar 2025 total of $716.9B, with a fraction of Amazon's margin structure.
- Walmart, Target and Costco compete on price and proximity, not on delivery speed or selection depth.
- In advertising, Google and Meta are the two larger platforms. Amazon's pitch is closed-loop attribution on actual purchases.
- TikTok Shop and Temu compete for the value end of the catalog and for seller attention, at price points Amazon has chosen not to chase at a loss.
What do the financial statements show?
| Fiscal year ($B) | FY2023 | FY2024 | FY2025 |
|---|---|---|---|
| Net sales | 574.8 | 638.0 | 716.9 |
| Operating income | 36.9 | 68.6 | 80.0 |
| Net income | 30.4 | 59.2 | 77.7 |
| Diluted EPS | $2.90 | $5.53 | $7.17 |
| Operating cash flow | 84.9 | 115.9 | 139.5 |
| Purchases of property and equipment, net | 48.1 | 77.7 | 128.3 |
| Free cash flow | 36.8 | 38.2 | 11.2 |
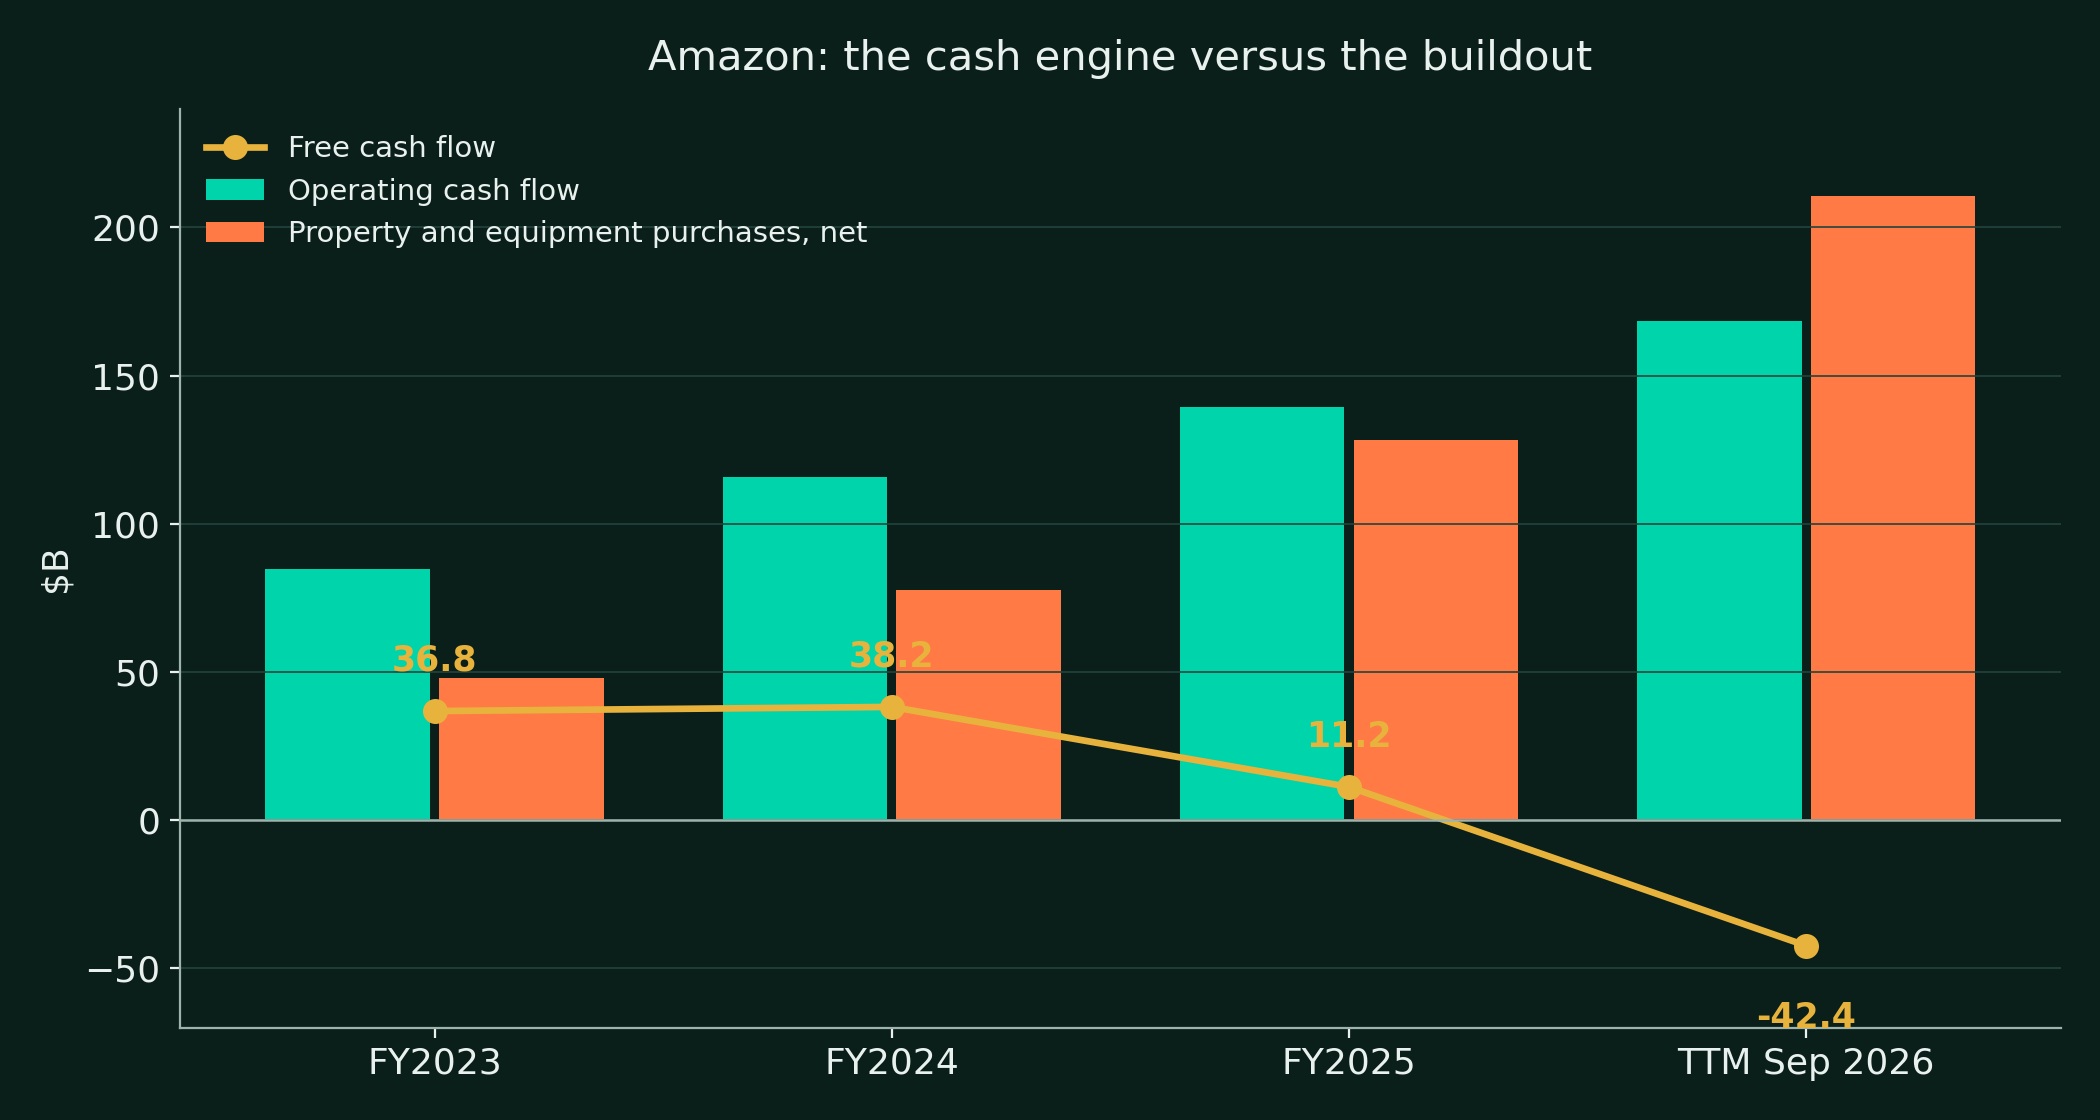
- Operating cash flow has compounded from $84.9B in fiscal 2023 to a trailing $168.3B at September 2026, up 29% year over year.
- Net purchases of property and equipment reached about $210.7B on the same trailing basis, the difference that prints free cash flow at negative $42.4B.
- The trailing free cash flow swing against a year earlier is about $57B, from an inflow of $14.8B to an outflow of $42.4B.
- Reported net income is no longer a clean read on operations. Gains on the Anthropic position added about $80.1B of pre-tax income from Q1 2025 through Q2 2026.
- Q3 2026 net income of $20.7B actually fell year over year because Q3 2025 carried a $9.5B pre-tax Anthropic gain.
- Stock-based compensation of $19.5B in fiscal 2025 and $15.5B in the first nine months of 2026 is the honest deduction from the cash story, and no buyback offsets it.
- Depreciation will follow the capex with a lag. Property and equipment, net, rose from $357.0B at the end of 2025 to $508.9B at September 30, 2026.
Has management delivered what it promised?
The fair test of this management team splits in two, and the two halves grade very differently. On operations, the record is close to flawless. Guidance for the first three quarters of 2026 was beaten on both sales and operating income, with Q3 operating income of $28.1B above the top of the guide range. The AWS re-acceleration that management framed as an inflection at 24% growth in Q4 2025 has delivered six straight quarters of acceleration to 39.3%. On capital, the record is a moving target. The 2026 capex guide began at about $200B in February, rose to about $220B by mid-year, and the 2027 figure is guided only as meaningfully more, with no number attached and no date offered for the free cash flow inflection the spending implies.
The Trainium audit is the most interesting line on the page. The silicon roadmap has delivered ahead of its own claims, with Trainium2 fully subscribed at 1.4 million chips and Trainium3 in production while its supply was still being committed. What has not been delivered is a price. Trainium2 sells only through capacity blocks to committed customers, and the absence of a public on-demand price is itself information. Amazon is allocating scarcity, not clearing a market. The Anthropic audit is genuinely open. The partnership has delivered the compute relationship in full, $110.0B of contracted payments and a million chips of deployment. The equity side resolves only at the IPO, when the 12% conversion cap meets a listed price and Amazon has to choose between waiving the cap and holding rollover notes.
| Commitment | Set when | Status at Nov 2, 2026 |
|---|---|---|
| AWS re-acceleration from the 24% Q4 2025 print | February 2026 | Delivered. Six straight quarters of acceleration to 39.3% |
| AWS growth above 40% in 2027 and 2028 | October 2026 | Pending. The largest claim on the page |
| 2026 capex of about $200B | February 2026 | Raised to about $220B by mid-2026. Tracking to the raised figure |
| Q1 to Q3 2026 quarterly guidance | Through 2026 | Beaten on sales and operating income in all three quarters |
| Trainium2 fully subscribed, 1.4M chips landed | February 2026 | Delivered. Rainier runs over 500,000 chips |
| Trainium3 supply committed by mid-2026 | February 2026 | Delivered on company statements. Production workloads running |
| Trainium4 delivery from 2027 | February 2026 | Pending |
| A public Trainium on-demand price | Never promised | Absent. Capacity allocated, not priced |
| Advertising back to high-teens growth in Q4 2026 | October 2026 | Pending. Q4 is the test after the 12% ex-FX Q3 print |
| Free cash flow inflection | Implied, never dated | Missed to date. Trailing print is negative $42.4B |
| Anthropic conversion and the 12% cap | S-1, October 2026 | Pending. Resolves around the November 2026 listing |
| Amazon Leo initial commercial service in 2026 | Company statements | Tracking. Globalstar FCC approval landed October 27, 2026 |
- The delivery record buys credibility for the 2027 leg of the AWS guide.
- It does not buy 2028, which requires another year above 40% on a base approaching $250B.
- Management declined to quantify 2027 capex and declined to guide the AWS margin. Two refusals in one call mark where the burden of proof now sits.
- Break-even timelines on new capacity are moving left, per management, but the company has not quantified the claim.
How is the balance sheet funded and what comes back to shareholders?
| Item | Value | As of |
|---|---|---|
| Cash and cash equivalents | $55.8B | September 30, 2026 |
| Marketable securities | $58.4B | September 30, 2026 |
| Cash and securities | $114.2B | September 30, 2026 |
| Long-term debt, carrying value | $173.1B | September 30, 2026 |
| Gross debt, face value | $180.9B | September 30, 2026 |
| Gross debt, face value | $68.8B | December 31, 2025 |
| Property and equipment, net | $508.9B | September 30, 2026 |
| Other assets, mostly investments | $358.8B | September 30, 2026 |
| Total assets | $1,243.4B | September 30, 2026 |
| Total contractual commitments | $883.6B | September 30, 2026 |
- The balance sheet changed character in nine months. Gross debt face value rose from $68.8B to $180.9B while cash and securities fell from $123.0B to $114.2B.
- Debt proceeds were $135.8B across the first nine months of 2026, including $53.4B in Q3 alone.
- The stack includes a $17.5B term loan drawn in June 2026 and due September 2029, plus $20B of revolving credit lines with nothing drawn.
- A secured supplier financing facility of up to about $80B, available from Q1 2027 through Q3 2028 against pledged equipment, was disclosed in the Q3 2026 Form 10-Q and was undrawn at September 30.
- Commitments of $883.6B include $294.3B of debt principal and interest, $164.9B of leases not yet commenced and $159.6B of property and equipment obligations.
- Management stated it expects to undertake additional financing activities before the end of 2026.
- Interest expense was $1.7B in Q3 2026, up from $538M a year earlier. Trailing operating income of $104.4B still covers the annualized interest bill many times over.
- The fortress deduction is not solvency. It is optionality. A company that carried net cash for a decade now carries net debt of about $66.7B on a face value basis, and its next financing decision is a need, not a choice.
- Shareholder returns are zero by policy. There is no dividend, and the $10B repurchase program authorized in March 2022 has $6.1B remaining with no repurchases since 2022, per the Form 10-Q.
- Stock-based compensation runs the other way, $19.5B in fiscal 2025 and $15.5B in the first nine months of 2026.
- Common shares outstanding plus shares underlying awards totaled 11.0B at September 30, 2026, so dilution of about 1% a year is the standing assumption in the scenarios below.
What is Amazon worth by fiscal 2029?
The reference price of $240.35 pays about 3.3 times trailing sales of $797.4B and about 25 times trailing operating income of $104.4B. Trailing GAAP earnings multiples are not usable, because about $80.1B of Anthropic gains run through the recent income statements. The cleaner question is what the operating business earns in fiscal 2029 under three readings of the AWS guide, and what multiple that earnings stream deserves. The scenarios are built segment by segment from a fiscal 2026 estimate of $827B of sales, split $470B North America, $182B International and $175B AWS, using nine months of actuals plus a fourth quarter at the guidance range.
| Fiscal 2029 | Bear | Base | Bull |
|---|---|---|---|
| AWS revenue ($B) | 289 | 440 | 487 |
| AWS operating margin | 30% | 33% | 36% |
| North America revenue ($B) | 544 | 592 | 626 |
| North America operating margin | 7.0% | 8.5% | 9.5% |
| International revenue ($B) | 223 | 242 | 256 |
| International operating margin | 3.5% | 5.0% | 6.5% |
| Total revenue ($B) | 1056 | 1274 | 1369 |
| Operating income ($B) | 133 | 207 | 251 |
| EPS | $8.40 | $13.88 | $17.48 |
| Exit multiple | 15x | 22x | 26x |
| Scenario value | $125 | $305 | $455 |
The bear case, $125
- AWS growth halves from the guide path, running 25%, 18% and 12% as digestion follows the 2026 capacity rush.
- AI mix dilutes the AWS margin to 30%, and the legacy margin never fully offsets it.
- Stores growth slows to 5% in North America and 7% in International, with margins stalling near current levels.
- The Anthropic listing disappoints and the stake converts at values well below carrying value, removing the balance sheet ballast.
- Capex stays high into 2028 because the commitments are already signed, so free cash flow stays negative longer than the market expects.
- The bear case is a digestion and dilution case. The business still earns $133B of operating income in fiscal 2029.
The base case, $305
- The AWS guide is paid in full. Growth runs above 40% in 2027 and 2028, then decelerates to about 28% in 2029 as the base approaches $450B.
- AWS margin settles at 33%, below the current 38.7%, as AI services take a larger share of the mix.
- North America compounds at 8% with margin grinding to 8.5% on advertising mix and logistics density.
- International compounds at 10% and reaches a 5.0% margin.
- Advertising returns to high-teens growth in Q4 2026 as guided and compounds in the mid-teens inside the segment numbers.
- Capex growth slows after 2027, free cash flow inflects during 2028, and the debt stack stops growing.
- The skeptic case stands beside this base. It says the guide above 40% is a capacity statement dressed as a demand forecast, that a large share of the $578B backlog is one counterparty whose funding is partly circular with Amazon's own investment, and that the free cash flow inflection has been promised by implication for three years while the trailing print went from positive $38.2B to negative $42.4B.
- Our answer is the delivery record in section 10 and the asymmetry. The base case can miss the guide's second year and still clear the current price.
The bull case, $455
- AWS growth beats the guide, running 45%, 42% and 35%, as inference demand compounds faster than capacity.
- Trainium external sales from late 2027 open a merchant silicon line the market currently prices at zero.
- AWS margin holds at 36% because Trainium mix offsets the AI services dilution.
- North America reaches a 9.5% margin as advertising passes $120B of revenue.
- The Anthropic stake converts near carrying value and is re-rated as a listed asset.
- Free cash flow inflects hard in 2028 and the buyback restarts, holding the share count near 11.0B.
What could break the story?
The central risk is the arithmetic of the buildout itself. Amazon has committed $883.6B of contractual spending into a technology cycle whose demand it measures partly through customers it finances. If AI demand digests for even a year, the company owns the largest fixed cost base in its history, a debt stack that tripled in nine months, and a free cash flow line that has already printed negative $42.4B on a trailing basis. None of that threatens solvency. All of it threatens the multiple, because the stock's case rests on the inflection arriving on schedule.
The second risk is concentration wearing a partnership's clothes. Anthropic is at once the anchor Trainium tenant, a large share of the AWS backlog, the reason Bedrock's token volume grew 17 times, and a $238.7B balance sheet asset whose equity conversion is capped at 12% unless Amazon waives the cap. A single counterparty should not be able to move the growth rate, the margin and the asset side at the same time. This one can. OpenAI adds a second, smaller version of the same exposure, with $50.0B invested and $35.0B more committed.
The third risk is that the rivals are not standing still. Google Cloud grew 103% in Q3 2026, Azure grew 48%, and both are spending at rates that close the capacity gap AWS's backlog assumes away. Amazon's defense is margin and scale, and its margin is the one management declined to guide. If the AI capacity race ends in overcapacity, the highest-cost builder with the newest debt feels it first.
- Regulatory pressure on the marketplace model continues in the United States and Europe, with the Italy tax settlement inside the Q4 2025 charges a reminder of the running cost.
- Amazon Leo is a pre-revenue satellite program absorbing operating expense, with the Globalstar acquisition adding about $10.9B of commitments on top.
- Key-person and succession questions are modest but real. The strategy runs through Jassy and a small group of long-tenured operators.
- The stock's path into this report, down about 7% after hours on the Q3 print before recovering part of the fall, describes the volatility a holder must underwrite while the inflection is unproven.
Where does the stock sit today?
- Reference price is the Friday October 30, 2026 close of $240.35.
- The stock closed at $253.10 on Tuesday October 27, up 9.3% year to date at that point.
- It fell 4.25% in the regular session on October 29 to $243.79, and traded near $226 after hours following the Q3 release before recovering part of the fall on October 30.
- The 52-week range runs from $196.00 to $287.20.
- The reference price sits about 16% below the 52-week high and about halfway through the range.
- Market capitalization at the reference price is about $2.6T.
- The valuation markers that matter are operating ones, about 3.3 times trailing sales and about 25 times trailing operating income.
- The technical picture is a stock that was forgiven its capex all year and stopped being forgiven in earnings week. The fundamental picture in sections 4 and 10 is a cloud re-acceleration being delivered into that doubt.
- Fourth quarter 2026 results are the next hard checkpoint. The date is not yet company-announced, as flagged in the verdict note.
Frequently asked questions
Why is free cash flow negative if the business is booming?
Operating cash flow set a record at $168.3B over the twelve months to September 2026. Amazon spent more than that on property and equipment, about $210.7B net, building AI capacity ahead of demand. Debt proceeds of $135.8B in nine months funded the gap. The deficit is a spending choice, not an earnings shortfall.
What is the Anthropic stake worth to Amazon shareholders?
The stake carries at $238.7B on the September 30, 2026 balance sheet, about $22.11 per Amazon share, split between convertible notes at $146.2B and preferred stock at $92.5B. Conversion into listed shares is capped at 12% of Anthropic unless Amazon waives the cap, so the equity Amazon can actually hold may be worth less than the carrying value implies.
What has to go right for the base case?
AWS growth has to hold near the guided path, above 40% in 2027 and 2028, with segment margin near 33% as AI mix dilutes the legacy margin. Stores margins keep grinding up, advertising returns to high-teens growth, and capex growth slows after 2027 so free cash flow inflects before the debt stack needs refinancing.
Sources and disclosures
- Amazon Form 10-K for fiscal 2025, filed February 6, 2026, for segment history, geographic sales, cash flow and the consolidated statements.
- Amazon Forms 10-Q for Q1, Q2 and Q3 2026, for quarterly segment detail, the September 30, 2026 balance sheet, the Anthropic and OpenAI positions, stock compensation and the repurchase program.
- Amazon earnings releases for Q4 2025, Q1 2026, Q2 2026 and Q3 2026, furnished on Form 8-K, for segment results, guidance and the silicon disclosures.
- Amazon earnings call reporting for the Q3 2026 call of October 29, 2026, for the AWS growth guide, the backlog, Bedrock volumes and the Trainium statements.
- Anthropic's Form S-1, filed publicly October 26, 2026, for the conversion cap, the compute commitments and Anthropic's own financials, as analyzed in the DalalBytes Amazon and Anthropic article of October 28, 2026.
- FCC approval reporting of October 27, 2026 for the Globalstar acquisition status.
- DalalBytes earnings coverage of Alphabet, Microsoft and Meta for the quarter ended September 30, 2026, for the competitive figures in section 8.
- Disclosures. The author is long Amazon.com, Inc. (AMZN) at publication. This report is research and opinion for educational purposes only and is not investment advice, a recommendation, or a solicitation. Prices and estimates are as of November 2, 2026, and will age. Verify figures against company filings before acting on them.