
What are the three gauges saying?
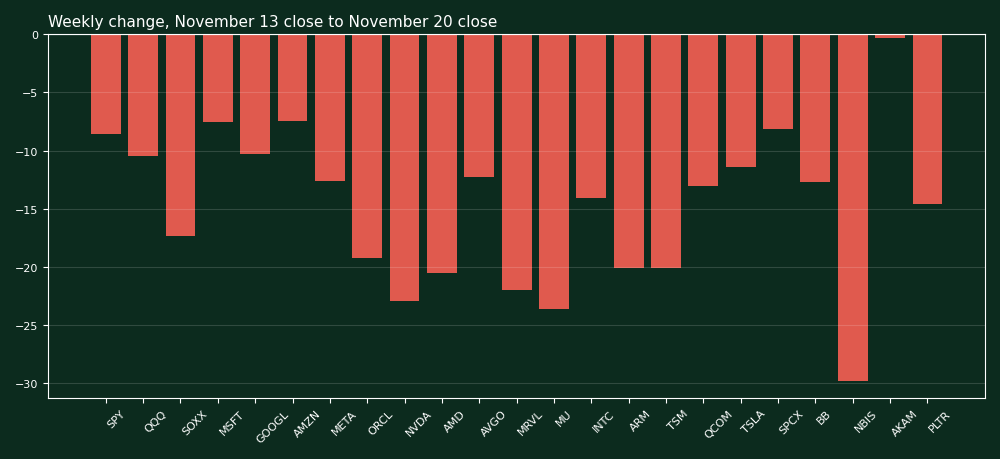
SPY closed Friday, November 20, 2026 at $689.81 and fell 8.56 percent on the week. QQQ closed at $608.45 and fell 10.51 percent. SOXX closed at $123.40 and fell 17.35 percent. All numbers in this edition are as of the close of Friday, November 20, 2026.
SPY broke its $731.53 downside target and closed well below it. QQQ broke its $647.05 downside target the same way. SOXX broke its $130.75 support shelf and now sits above a $115.54 downside target. The gauges say the prior rebound has failed. They do not yet say where this leg ends.
How did the November 13 targets grade?
The prior edition was drawn from the November 13, 2026 close. Every downside and bounce target from that map is graded below against daily bars from November 16 through November 20. No prior target was moved. Grades use the standing labels. Downside grades run from Untested through Hit and broke below. Bounce grades mirror them. Struck is a status and not a grade. No target in this grading earned a struck status this week.
| Name | Nov 13 downside target | Grade | Nov 13 bounce target | Grade |
|---|---|---|---|---|
| SPY | $731.53 | Hit and broke below | $775.64 | Untested |
| QQQ | $647.05 | Hit and broke below | $695.57 | Untested |
| SOXX | $130.75 | Hit and broke below | $160.39 | Untested |
| MSFT | $504.96 | Hit and broke below | $559.15 | Untested |
| GOOGL | $272.11 | Hit and broke below | $314.90 | Untested |
| AMZN | $244.51 | Untested | $287.20 | Untested |
| META | $588.20 | Hit and broke below | $679.81 | Untested |
| ORCL | $109.21 | Hit and broke below | $148.48 | Untested |
| NVDA | Open air | Open air (no target) | $193.65 | Untested |
| AMD | $461.71 | Hit and broke below | $658.52 | Untested |
| AVGO | $321.42 | Hit and broke below | $378.71 | Untested |
| MRVL | $132.54 | Hit and broke below | $187.00 | Untested |
| MU | $651.11 | Hit and broke below | $838.00 | Untested |
| INTC | $42.28 | Untested | $68.50 | Untested |
| ARM | $125.17 | Untested | $208.30 | Untested |
| TSM | $372.72 | Hit and broke below | $436.04 | Untested |
| QCOM | $157.54 | Hit and broke below | $184.49 | Untested |
| TSLA | $366.31 | Hit and broke below | $434.60 | Untested |
| SPCX | $120.39 | Untested | $155.00 | Untested |
| BB | $7.99 | Hit and broke below | $9.64 | Untested |
| NBIS | $95.30 | Hit and broke below | $168.71 | Untested |
| AKAM | $77.37 | Untested | $99.94 | Untested |
| PLTR | $152.60 | Hit and broke below | $188.37 | Untested |
The tally is plain. Downside targets carried a numeric level in 22 names. Seventeen were Hit and broke below. Five were Untested. NVDA carried open air instead of a numeric downside target. It fell from $162.85 to $125.53 inside that open air.
Bounce targets tell the other half of the week. All 23 were Untested. No name reached its bounce line. The highest weekly high in the group still fell short of its target in every case.
What did the tape teach this week?
A break that arrives everywhere at once is systemic. Last week one downside target broke and the break read as single-name. This week seventeen broke in five sessions. The lesson from last week reverses. Breadth is the difference between a stock problem and a market problem.
Open air stayed open. NVDA had no clustered support shelf under its price last week. It fell 22.92 percent anyway. Open air means no clustered support shelf remains under the price on the past year of daily bars. Price discovery in open air is fast because no marked shelf slows it.
The five holds matter. AMZN never reached its downside target. INTC never did. ARM never did. SPCX never did. AKAM never did. Each fell hard and still held its marked line. Those five lines are now the most tested shelves on the new map.
Oversold is a condition and not a low. SPY closed at an RSI of 24.9. NVDA closed at an RSI of 15.0. Readings that low mark speed. They have marked both lows and waypoints in past declines. The map grades lines. It does not call bottoms.
Where does every name stand on one page?
Every level below is drawn from daily bars through the close of Friday, November 20, 2026. The method is unchanged. Clustered swing highs and lows from the past year are merged with any moving average on the same shelf. Where a name has fallen through its last shelf the table says open air. Open air means there is no such shelf left under the price.
| Name | Close | RSI | From high | Support 1 | Support 2 | Resistance 1 | Downside target | Bounce target | Bias |
|---|---|---|---|---|---|---|---|---|---|
| SPY | $689.81 | 24.9 | -11.7% | $685.89 | $629.28 | $732.76 | $629.28 | $754.40 | Oversold after a downside break |
| QQQ | $608.45 | 26.6 | -20.2% | $555.60 | Open air | $615.21 | Open air | $661.14 | Breakdown with open air below |
| SOXX | $123.40 | 29.1 | -43.6% | $122.00 | $115.54 | $130.75 | $115.54 | $150.02 | Oversold after a downside break |
| MSFT | $484.52 | 34.8 | -13.3% | $480.71 | $443.63 | $512.16 | $443.63 | $522.96 | Downside target broke this week |
| GOOGL | $265.29 | 27.8 | -35.1% | Open air | Open air | $274.51 | Open air | $289.45 | Breakdown with open air below |
| AMZN | $246.82 | 42.3 | -14.1% | $238.97 | $224.87 | $257.59 | $224.87 | $266.45 | Downside target held this week |
| META | $560.84 | 30.3 | -28.1% | $556.56 | $538.72 | $595.22 | $538.72 | $618.56 | Downside target broke this week |
| ORCL | $101.19 | 31.8 | -59.6% | Open air | Open air | $109.21 | Open air | $114.50 | Breakdown with open air below |
| NVDA | $125.53 | 15.0 | -48.4% | Open air | Open air | $164.27 | Open air | $170.67 | Breakdown with open air below |
| AMD | $424.39 | 38.4 | -35.6% | $402.10 | $393.36 | $438.87 | $393.36 | $451.00 | Downside target broke this week |
| AVGO | $304.41 | 40.8 | -38.5% | $291.68 | Open air | $309.94 | Open air | $321.42 | Breakdown with open air below |
| MRVL | $122.28 | 27.9 | -62.9% | $102.77 | $94.62 | $132.54 | $94.62 | $146.85 | Oversold after a downside break |
| MU | $594.51 | 29.5 | -52.6% | $471.34 | $455.50 | $651.11 | $455.50 | $737.88 | Oversold after a downside break |
| INTC | $51.28 | 28.0 | -64.0% | $49.17 | $46.97 | $54.60 | $46.97 | $64.06 | Oversold after a downside break |
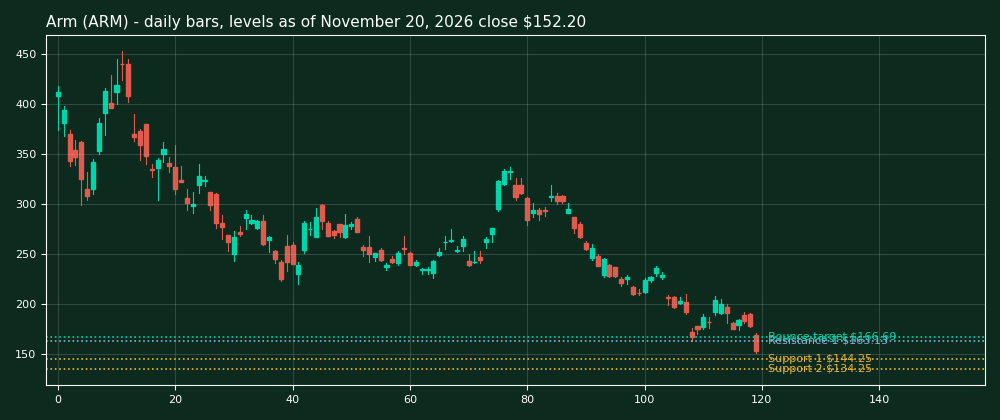
| ARM | $152.20 | 31.8 | -66.4% | $144.25 | $134.25 | $163.13 | $134.25 | $166.69 | Downside target held this week |
| TSM | $318.71 | 28.3 | -34.6% | $275.08 | Open air | $331.92 | Open air | $350.99 | Breakdown with open air below |
| QCOM | $149.94 | 35.1 | -42.3% | $147.59 | $142.89 | $156.23 | $142.89 | $164.77 | Downside target broke this week |
| TSLA | $345.82 | 37.8 | -30.7% | $337.69 | $297.38 | $349.75 | $297.38 | $366.37 | Downside target broke this week |
| SPCX | $127.79 | 38.5 | -43.4% | $120.39 | $104.83 | $130.39 | $104.83 | $139.18 | Downside target held this week |
| BB | $7.77 | 40.4 | -42.8% | $7.46 | $7.23 | $7.83 | $7.23 | $8.21 | Downside target broke this week |
| NBIS | $81.31 | 28.5 | -72.9% | $75.25 | $73.52 | $83.22 | $73.52 | $89.65 | Oversold after a downside break |
| AKAM | $85.11 | 43.3 | -48.6% | $82.70 | $77.37 | $88.50 | $77.37 | $91.44 | Downside target held this week |
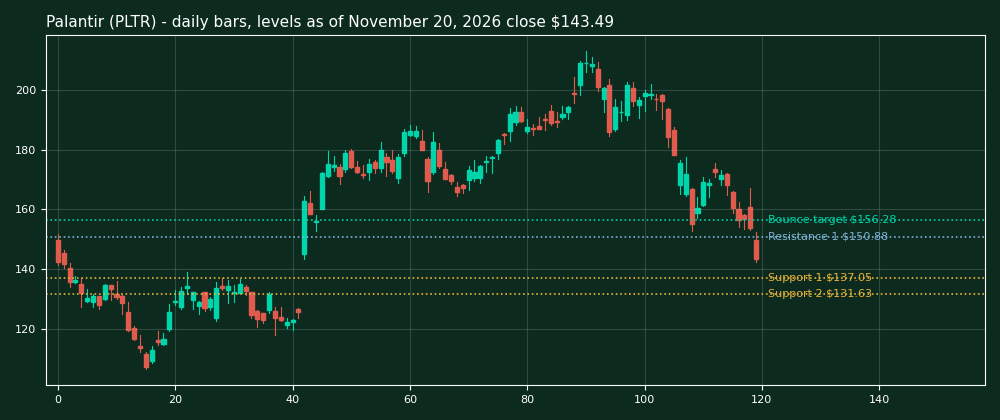
| PLTR | $143.49 | 26.4 | -32.6% | $137.05 | $131.63 | $150.88 | $131.63 | $156.28 | Oversold after a downside break |
What do the three gauges charts say now?
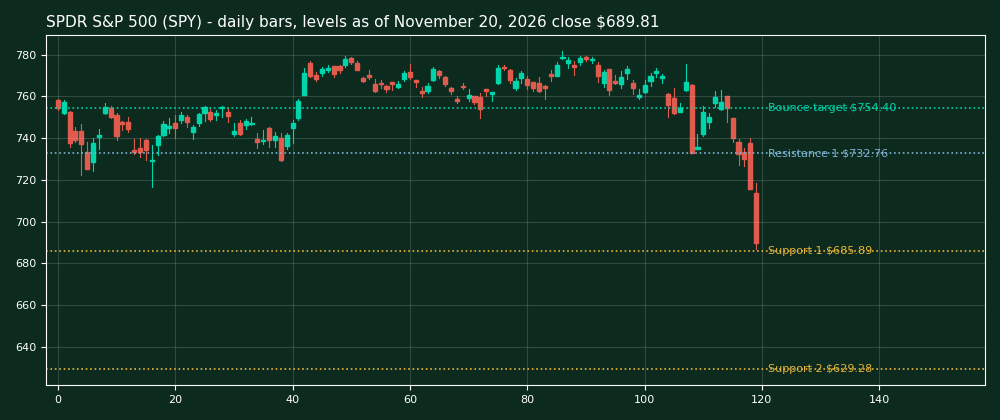
SPDR S&P 500 (SPY). Bias. Oversold after a downside break.
The tape. Close $689.81. Week -8.56%. RSI 24.9. ATR $13.59. 20 DMA $747.81. 50 DMA $760.18. 200 DMA $732.76. From the 52-week high -11.7%.
The levels. Support at $685.89 and $629.28. Resistance at $732.76. Downside target $629.28. Bounce target $754.40.
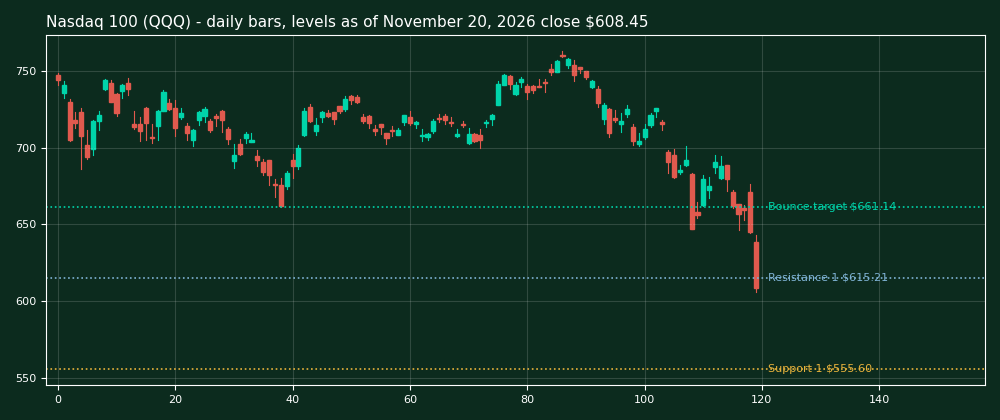
Nasdaq 100 (QQQ). Bias. Breakdown with open air below.
The tape. Close $608.45. Week -10.51%. RSI 26.6. ATR $18.77. 20 DMA $678.53. 50 DMA $710.96. 200 DMA $683.06. From the 52-week high -20.2%.
The levels. Support at $555.60 and Open air. Resistance at $615.21. Downside target Open air. Bounce target $661.14.
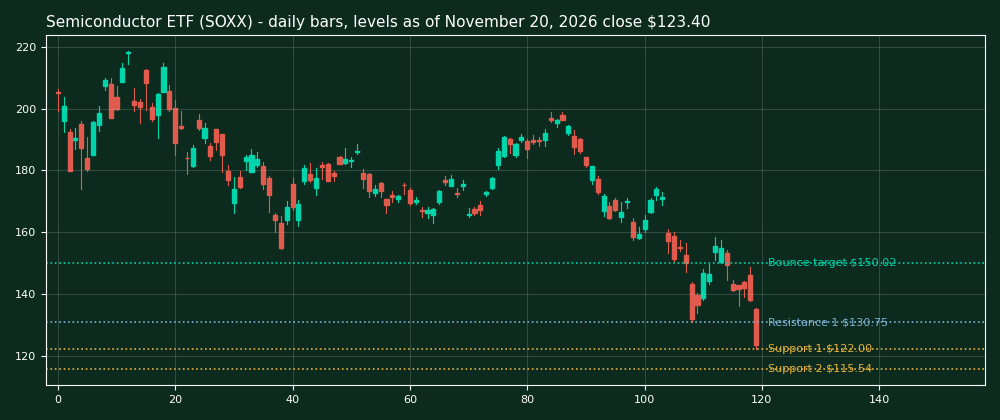
Semiconductor ETF (SOXX). Bias. Oversold after a downside break.
The tape. Close $123.40. Week -17.35%. RSI 29.1. ATR $8.90. 20 DMA $150.02. 50 DMA $168.12. 200 DMA $160.97. From the 52-week high -43.6%.
The levels. Support at $122.00 and $115.54. Resistance at $130.75. Downside target $115.54. Bounce target $150.02.
How do the hyperscalers stand?
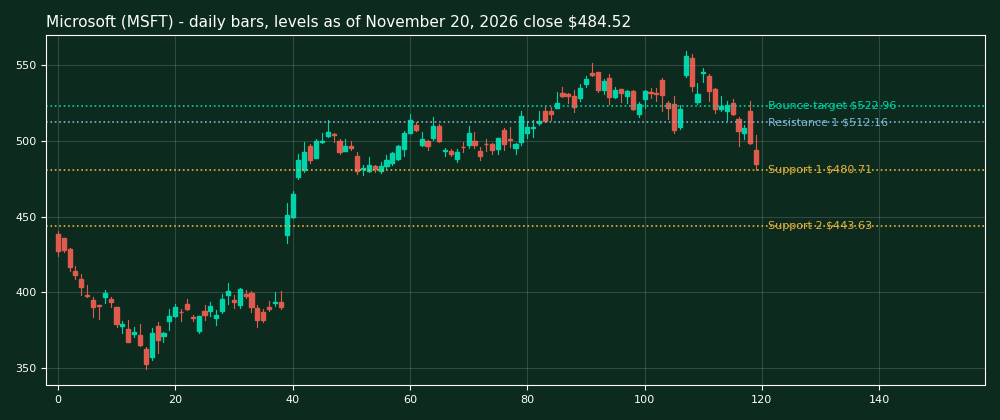
Microsoft (MSFT). Bias. Downside target broke this week.
The tape. Close $484.52. Week -7.51%. RSI 34.8. ATR $16.41. 20 DMA $522.96. 50 DMA $519.84. 200 DMA $443.63. From the 52-week high -13.3%.
The levels. Support at $480.71 and $443.63. Resistance at $512.16. Downside target $443.63. Bounce target $522.96.
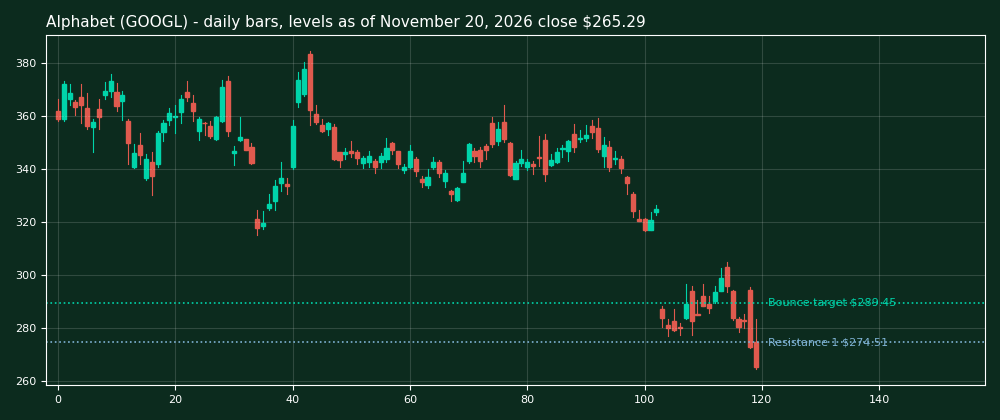
Alphabet (GOOGL). Bias. Breakdown with open air below.
The tape. Close $265.29. Week -10.31%. RSI 27.8. ATR $11.31. 20 DMA $289.45. 50 DMA $322.30. 200 DMA $336.97. From the 52-week high -35.1%.
The levels. Support at Open air and Open air. Resistance at $274.51. Downside target Open air. Bounce target $289.45.
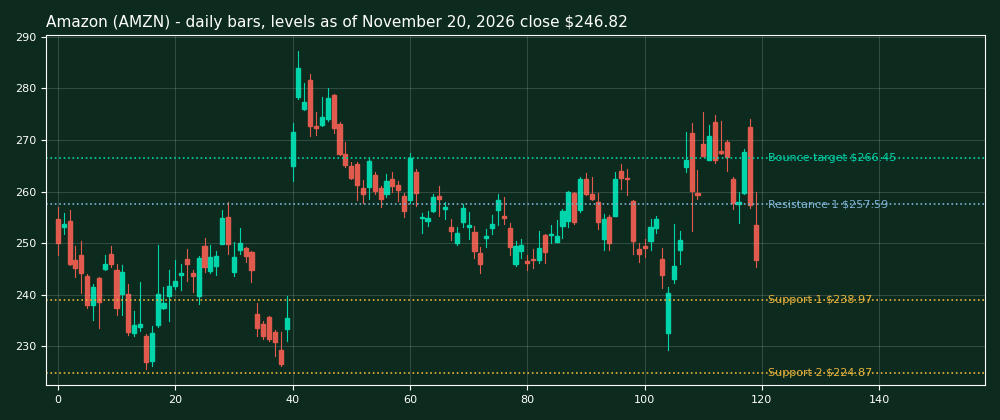
Amazon (AMZN). Bias. Downside target held this week.
The tape. Close $246.82. Week -7.44%. RSI 42.3. ATR $9.97. 20 DMA $257.42. 50 DMA $255.03. 200 DMA $245.15. From the 52-week high -14.1%.
The levels. Support at $238.97 and $224.87. Resistance at $257.59. Downside target $224.87. Bounce target $266.45.
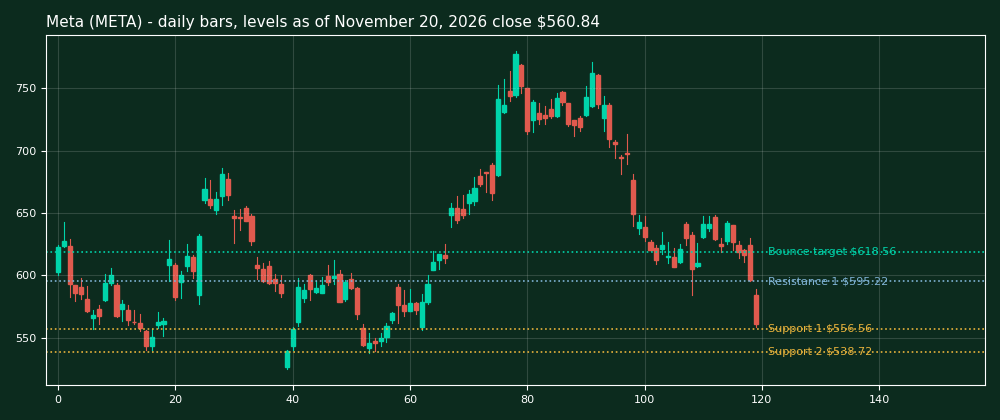
Meta (META). Bias. Downside target broke this week.
The tape. Close $560.84. Week -12.60%. RSI 30.3. ATR $23.27. 20 DMA $618.56. 50 DMA $676.65. 200 DMA $628.59. From the 52-week high -28.1%.
The levels. Support at $556.56 and $538.72. Resistance at $595.22. Downside target $538.72. Bounce target $618.56.
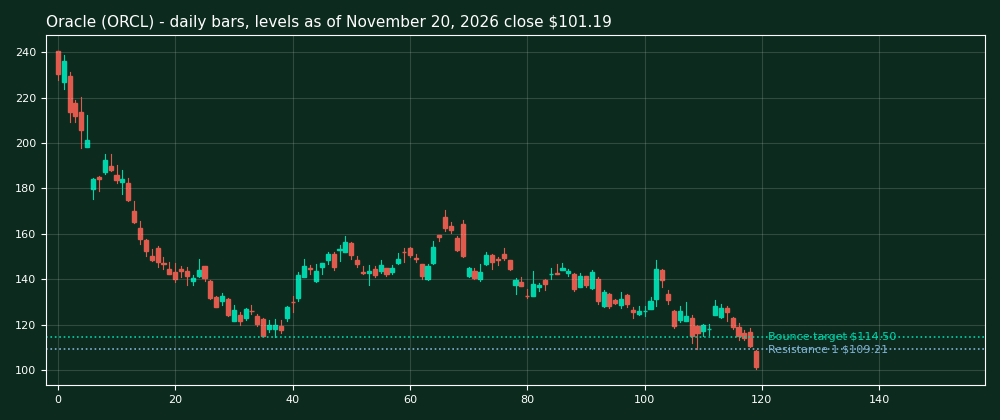
Oracle (ORCL). Bias. Breakdown with open air below.
The tape. Close $101.19. Week -19.27%. RSI 31.8. ATR $7.93. 20 DMA $122.51. 50 DMA $132.14. 200 DMA $153.10. From the 52-week high -59.6%.
The levels. Support at Open air and Open air. Resistance at $109.21. Downside target Open air. Bounce target $114.50.
How do the semiconductors stand?
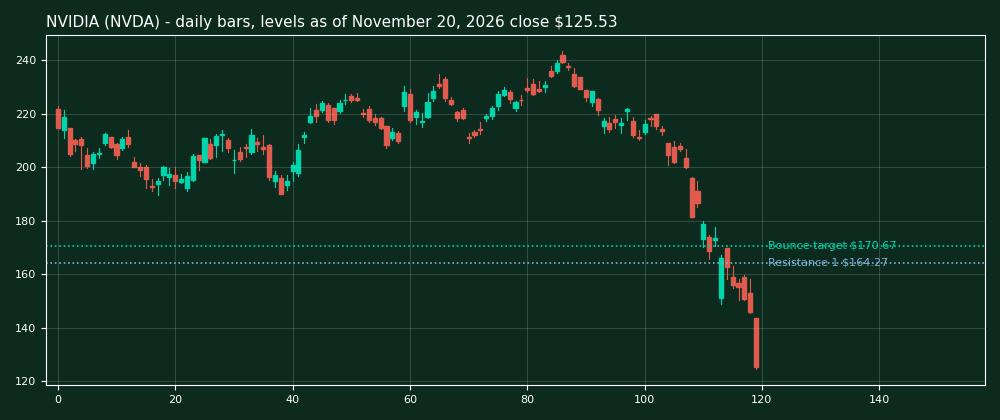
NVIDIA (NVDA). Bias. Breakdown with open air below.
The tape. Close $125.53. Week -22.92%. RSI 15.0. ATR $10.71. 20 DMA $181.46. 50 DMA $207.00. 200 DMA $203.35. From the 52-week high -48.4%.
The levels. Support at Open air and Open air. Resistance at $164.27. Downside target Open air. Bounce target $170.67.
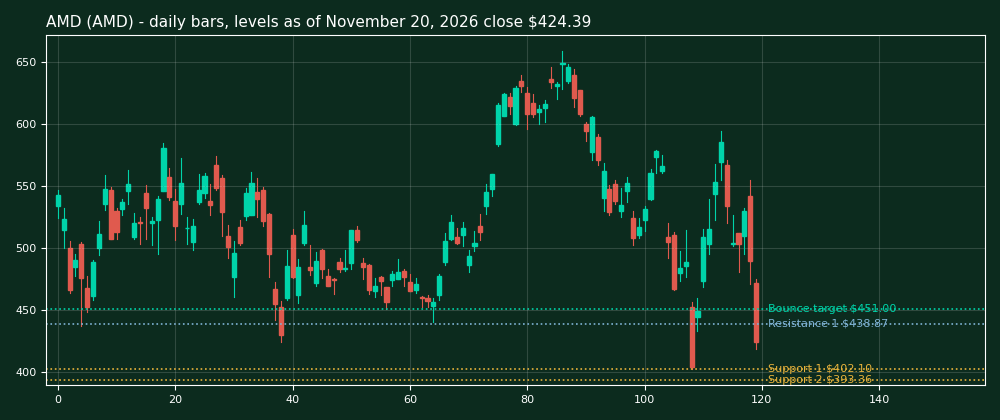
AMD (AMD). Bias. Downside target broke this week.
The tape. Close $424.39. Week -20.54%. RSI 38.4. ATR $45.41. 20 DMA $509.08. 50 DMA $553.10. 200 DMA $429.79. From the 52-week high -35.6%.
The levels. Support at $402.10 and $393.36. Resistance at $438.87. Downside target $393.36. Bounce target $451.00.
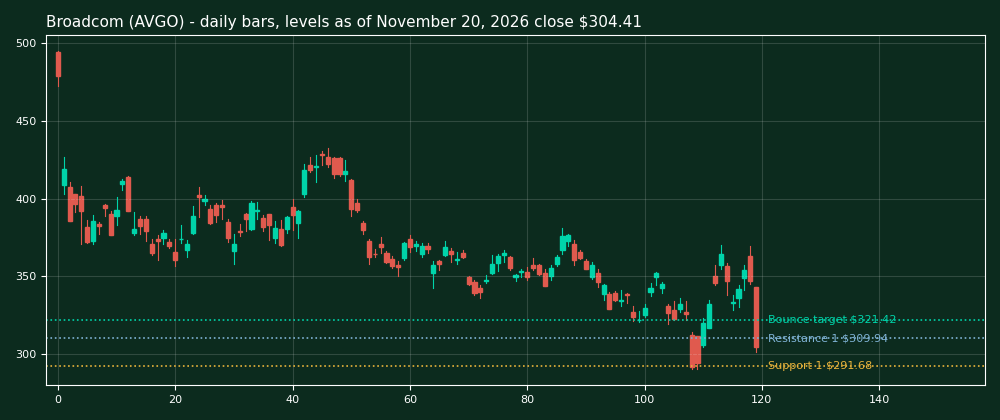
Broadcom (AVGO). Bias. Breakdown with open air below.
The tape. Close $304.41. Week -12.28%. RSI 40.8. ATR $20.02. 20 DMA $332.38. 50 DMA $342.71. 200 DMA $367.82. From the 52-week high -38.5%.
The levels. Support at $291.68 and Open air. Resistance at $309.94. Downside target Open air. Bounce target $321.42.
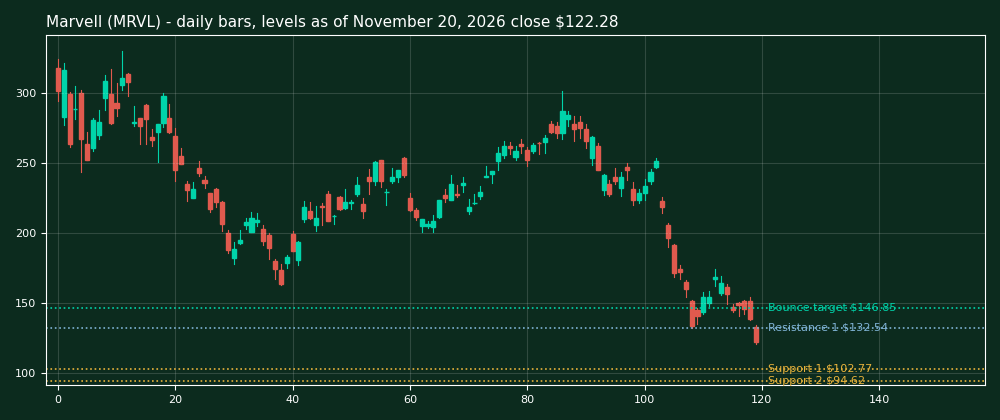
Marvell (MRVL). Bias. Oversold after a downside break.
The tape. Close $122.28. Week -22.00%. RSI 27.9. ATR $16.06. 20 DMA $171.05. 50 DMA $220.27. 200 DMA $188.60. From the 52-week high -62.9%.
The levels. Support at $102.77 and $94.62. Resistance at $132.54. Downside target $94.62. Bounce target $146.85.
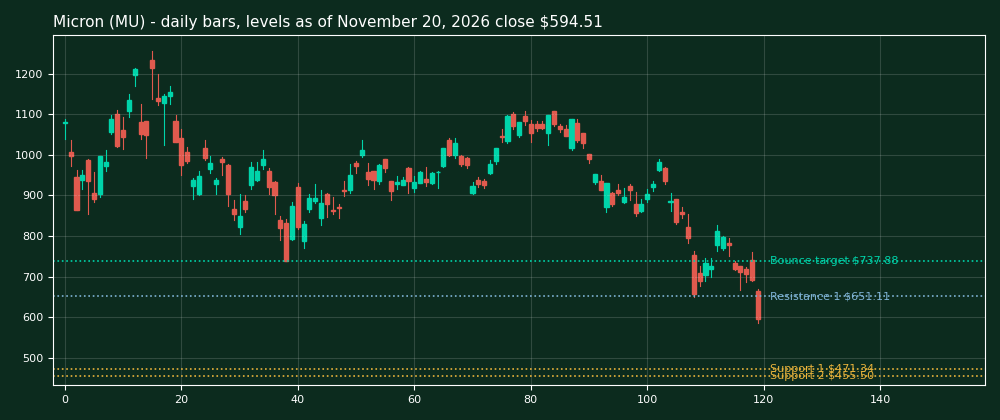
Micron (MU). Bias. Oversold after a downside break.
The tape. Close $594.51. Week -23.62%. RSI 29.5. ATR $61.84. 20 DMA $786.65. 50 DMA $912.26. 200 DMA $772.54. From the 52-week high -52.6%.
The levels. Support at $471.34 and $455.50. Resistance at $651.11. Downside target $455.50. Bounce target $737.88.
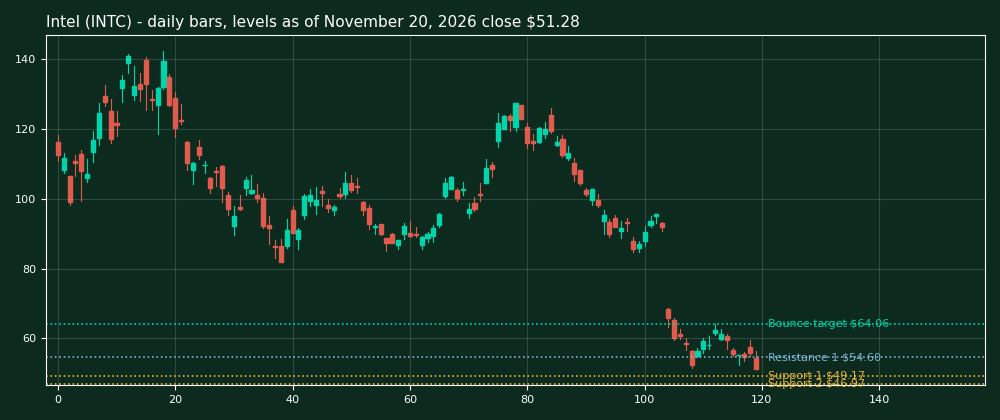
Intel (INTC). Bias. Oversold after a downside break.
The tape. Close $51.28. Week -14.05%. RSI 28.0. ATR $5.24. 20 DMA $64.90. 50 DMA $90.22. 200 DMA $87.55. From the 52-week high -64.0%.
The levels. Support at $49.17 and $46.97. Resistance at $54.60. Downside target $46.97. Bounce target $64.06.
Arm (ARM). Bias. Downside target held this week.
The tape. Close $152.20. Week -20.12%. RSI 31.8. ATR $16.23. 20 DMA $194.25. 50 DMA $239.62. 200 DMA $234.51. From the 52-week high -66.4%.
The levels. Support at $144.25 and $134.25. Resistance at $163.13. Downside target $134.25. Bounce target $166.69.
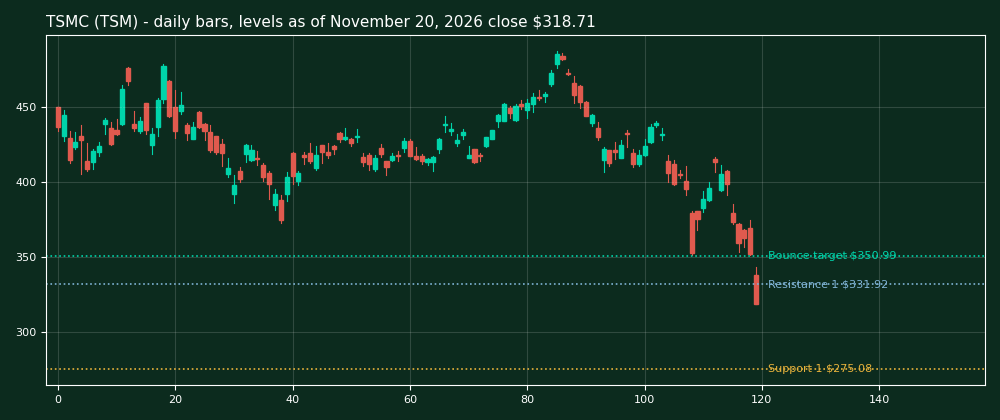
TSMC (TSM). Bias. Breakdown with open air below.
The tape. Close $318.71. Week -20.07%. RSI 28.3. ATR $19.06. 20 DMA $391.78. 50 DMA $422.15. 200 DMA $403.56. From the 52-week high -34.6%.
The levels. Support at $275.08 and Open air. Resistance at $331.92. Downside target Open air. Bounce target $350.99.
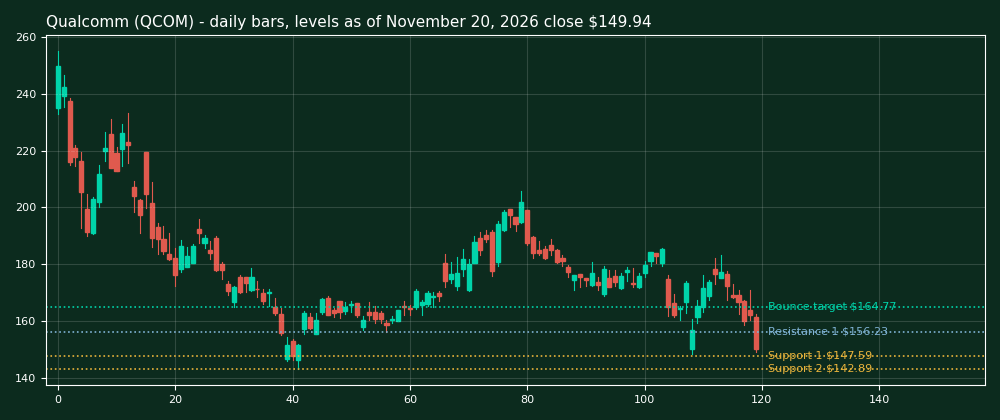
Qualcomm (QCOM). Bias. Downside target broke this week.
The tape. Close $149.94. Week -13.06%. RSI 35.1. ATR $9.34. 20 DMA $169.85. 50 DMA $177.31. 200 DMA $170.55. From the 52-week high -42.3%.
The levels. Support at $147.59 and $142.89. Resistance at $156.23. Downside target $142.89. Bounce target $164.77.
How do Tesla and SPCX stand?
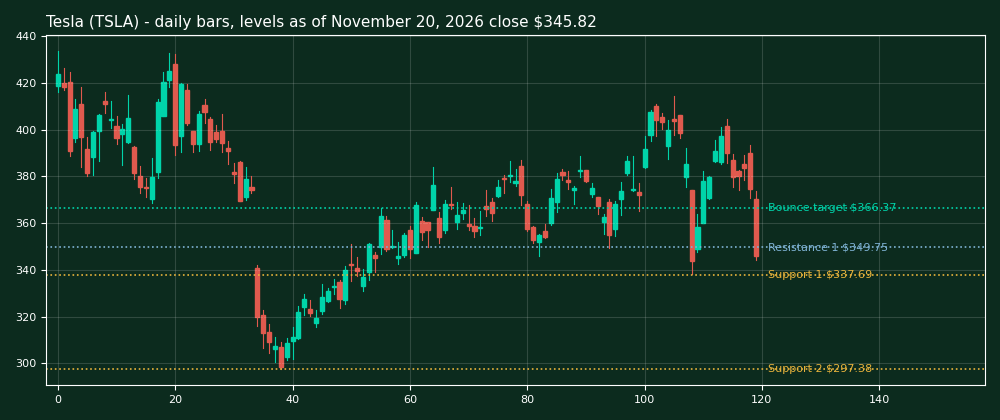
Tesla (TSLA). Bias. Downside target broke this week.
The tape. Close $345.82. Week -11.38%. RSI 37.8. ATR $17.14. 20 DMA $384.80. 50 DMA $375.64. 200 DMA $381.66. From the 52-week high -30.7%.
The levels. Support at $337.69 and $297.38. Resistance at $349.75. Downside target $297.38. Bounce target $366.37.
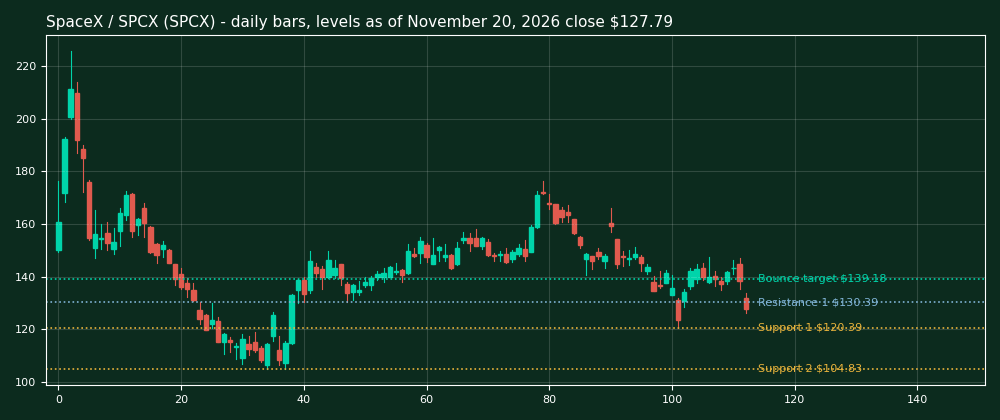
SpaceX (SPCX). Bias. Downside target held this week.
The tape. Close $127.79. Week -8.14%. RSI 38.5. ATR $8.08. 20 DMA $139.18. 50 DMA $147.71. 200 DMA Not available yet. From the 52-week high -43.4%.
The levels. Support at $120.39 and $104.83. Resistance at $130.39. Downside target $104.83. Bounce target $139.18.
How do the crowd names stand?
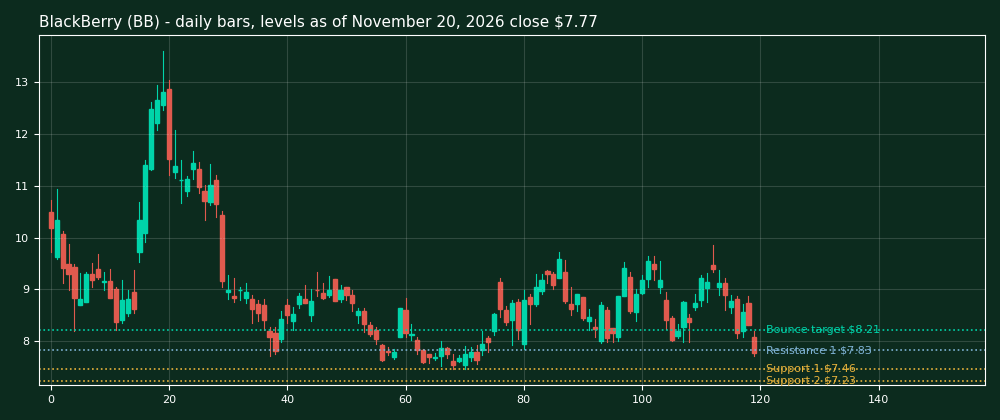
BlackBerry (BB). Bias. Downside target broke this week.
The tape. Close $7.77. Week -12.70%. RSI 40.4. ATR $0.59. 20 DMA $8.76. 50 DMA $8.65. 200 DMA $7.23. From the 52-week high -42.8%.
The levels. Support at $7.46 and $7.23. Resistance at $7.83. Downside target $7.23. Bounce target $8.21.
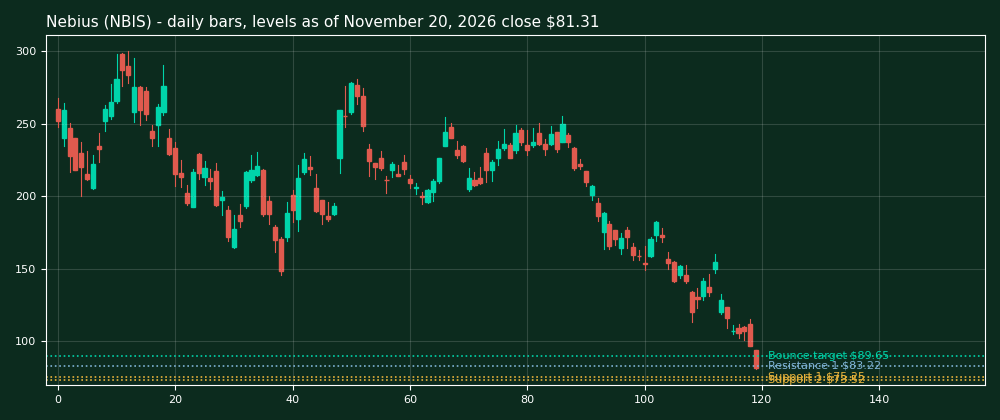
Nebius (NBIS). Bias. Oversold after a downside break.
The tape. Close $81.31. Week -29.83%. RSI 28.5. ATR $16.85. 20 DMA $134.48. 50 DMA $181.30. 200 DMA $179.75. From the 52-week high -72.9%.
The levels. Support at $75.25 and $73.52. Resistance at $83.22. Downside target $73.52. Bounce target $89.65.
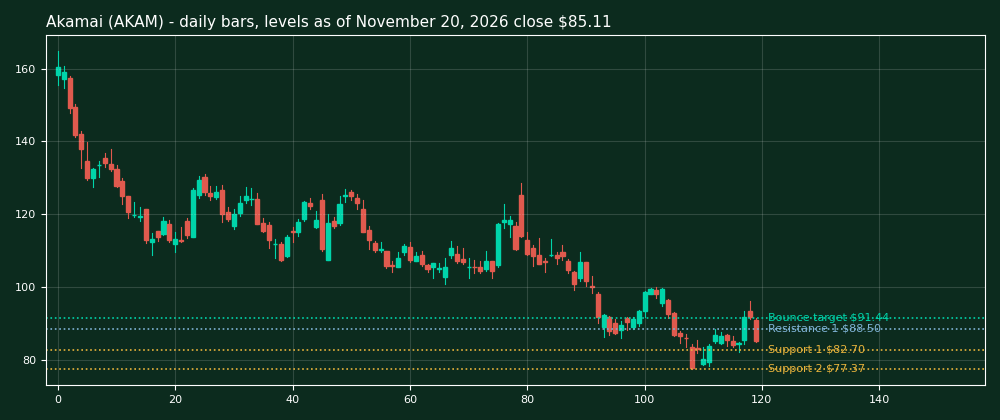
Akamai (AKAM). Bias. Downside target held this week.
The tape. Close $85.11. Week -0.34%. RSI 43.3. ATR $5.30. 20 DMA $88.42. 50 DMA $97.36. 200 DMA $111.80. From the 52-week high -48.6%.
The levels. Support at $82.70 and $77.37. Resistance at $88.50. Downside target $77.37. Bounce target $91.44.
Palantir (PLTR). Bias. Oversold after a downside break.
The tape. Close $143.49. Week -14.58%. RSI 26.4. ATR $9.13. 20 DMA $171.82. 50 DMA $183.26. 200 DMA $153.97. From the 52-week high -32.6%.
The levels. Support at $137.05 and $131.63. Resistance at $150.88. Downside target $131.63. Bounce target $156.28.
Frequently asked questions
How did the November 13 technical targets grade this week?
Downside targets broke below in 17 of the 22 names that carried a numeric target. Five downside targets were Untested. Amazon held its line. Intel held. Arm held. SPCX held. Akamai held. NVIDIA carried open air instead of a numeric downside target and fell further into it. Every one of the 23 bounce targets was Untested. No bounce line was reached in a week when every name fell.
What price levels matter most in the week ahead?
SPY closed Friday at $689.81 after breaking its $731.53 downside target. QQQ closed at $608.45 after breaking its $647.05 downside target. SOXX closed at $123.40 and sits above its $115.54 downside target. NVIDIA closed at $125.53 with open air below it. Open air means no clustered support shelf remains under the price on the past year of daily bars.
Was this week a capitulation low?
The data do not prove that yet. SPY closed with an RSI of 24.9 and QQQ with an RSI of 26.6. Those readings are oversold. Oversold describes how fast price fell. It does not by itself mark a low. Confirmation needs a higher low on a retest and closes that hold above a reclaimed line.
Are these price targets fundamental valuations?
No. Every target in this edition is a technical level. It is the next marked support below the price or the first marked resistance above it. Levels are measured on daily bars through the close of November 20, 2026. They describe where buying and selling interest has appeared before. They are not valuations and they are not recommendations.
This map is educational material. It is not investment advice and it is not a recommendation to buy or sell any security. Levels are drawn from public price data as of the November 20, 2026 close.