
What are the three gauges saying?
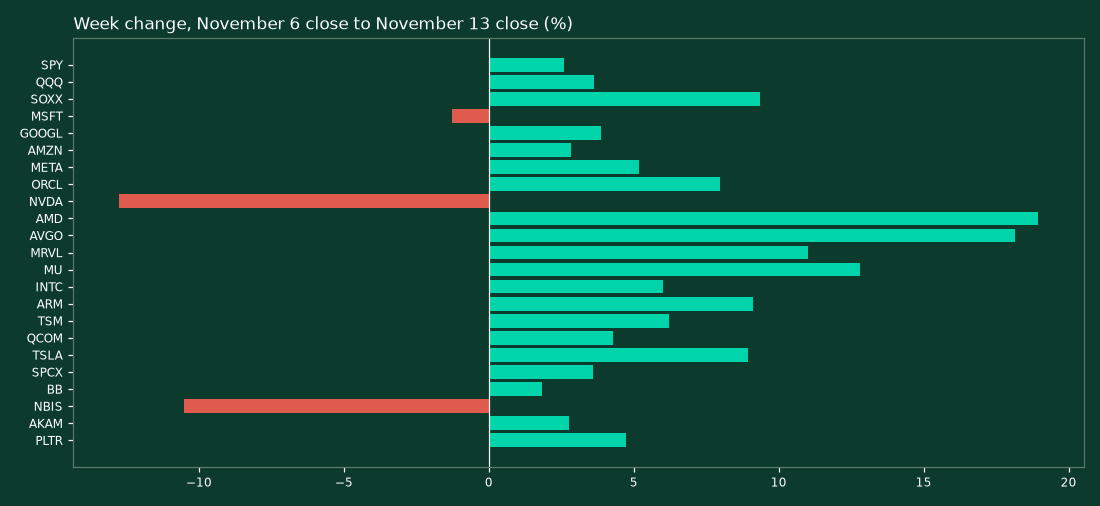
SPY closed Friday, November 13, 2026 at $754.37 and rose 2.59 percent on the week. QQQ closed at $679.89 and rose 3.63 percent. SOXX closed at $149.30 and rose 9.35 percent. All numbers in this edition are as of the close of Friday, November 13, 2026.
SPY holds above its 200-day average at $731.92. QQQ lost its 200-day average again on Friday. SOXX remains below every major average. The gauges say the rebound is real and unfinished at the same time.
How did the November 6 targets grade?
The prior edition was drawn from the November 6, 2026 close and published as After the Rout. Every downside and bounce target from that map is graded below against daily bars from November 9 through November 13. No prior target was moved. Grades use the standing labels. Downside grades run from Untested through Hit and broke below. Bounce grades mirror them. Struck is a status and not a grade. No target in this grading earned a struck status this week.
| Name | Nov 6 downside target | Grade | Nov 6 bounce target | Grade |
|---|---|---|---|---|
| SPY | $724.95 | Untested | $758.68 | Hit, broke above, then lost |
| QQQ | $599.49 | Untested | $680.89 | Hit, broke above, then lost |
| SOXX | $115.11 | Untested | $159.56 | Touched intraday only |
| MSFT | $504.96 | Untested | $559.15 | Untested |
| GOOGL | $267.67 | Untested | $314.90 | Untested |
| AMZN | $243.94 | Untested | $274.75 | Hit and rejected |
| META | $556.56 | Untested | $642.70 | Hit and rejected |
| ORCL | $100.00 | Untested | $131.58 | Touched intraday only |
| NVDA | $170.30 | Hit and broke below | $204.67 | Untested |
| AMD | $393.36 | Untested | $498.70 | Hit and broke above |
| AVGO | Open air (no target) | No target (open air) | $335.81 | Hit and broke above |
| MRVL | $132.54 | Untested | $185.05 | Untested |
| MU | Open air (no target) | No target (open air) | $756.73 | Hit and broke above |
| INTC | $42.27 | Untested | $68.50 | Untested |
| ARM | $125.17 | Untested | $208.30 | Touched intraday only |
| TSM | $331.92 | Untested | $401.48 | Hit, broke above, then lost |
| QCOM | $148.25 | Untested | $184.49 | Touched intraday only |
| TSLA | $337.24 | Untested | $383.87 | Hit and broke above |
| SPCX | $120.39 | Untested | $149.68 | Untested |
| BB | $7.99 | Untested | $9.64 | Hit and rejected |
| NBIS | $95.30 | Untested | $167.43 | Untested |
| AKAM | Open air (no target) | No target (open air) | $99.94 | Untested |
| PLTR | $149.09 | Untested | $185.88 | Untested |
The tally is plain. Downside targets carried a numeric level in 20 names. Nineteen were Untested. One was Hit and broke below. That one was NVIDIA. AVGO, MU and AKAM carried open air instead of a numeric downside target. None of the three fell through its last shelf.
Bounce targets tell the other half of the week. Four were Hit and broke above. Those were AMD, AVGO, MU and TSLA. Three were Hit, broke above, then lost. Those were SPY, QQQ and TSM. Three were Hit and rejected. Those were AMZN, META and BB. Four were Touched intraday only. Those were SOXX, ORCL, ARM and QCOM. Nine were Untested.
What did the tape teach this week?
A rebound that loses its reclaimed lines has not confirmed. SPY and QQQ both closed above their bounce targets in midweek. Both closed back below them on Friday. A close that does not hold is information. It is not confirmation.
The break was single-name and not systemic. NVIDIA broke while 19 other downside targets went untested. Its fall came on very heavy volume and left open air underneath. Open air means no clustered support shelf remains under the price on the past year of daily bars. A systemic break looks like the prior week. This one did not.
Marked lines drew real reactions. AMZN, META and BB each probed a bounce target and were rejected. SOXX, ORCL, ARM and QCOM each stopped just short of one. Seven of 23 bounce lines shaped the week even where price never closed through them.
SOXX never visited the monthly shelf. The roughly $125 monthly 20-period average stayed well below the week's $137.97 low. Price rebounded before that shelf was tested. That is recorded here as a learning input for a future method review. It changes no graded target.
Where does every name stand on one page?
Every level below is drawn from daily bars through the close of Friday, November 13, 2026. The method is unchanged. Clustered swing highs and lows from the past year are merged with any moving average on the same shelf. Where a name has fallen through its last shelf the table says open air. Open air means there is no such shelf left under the price.
| Name | Close | RSI | From high | Support 1 | Support 2 | Resistance 1 | Downside target | Bounce target | Bias |
|---|---|---|---|---|---|---|---|---|---|
| SPY | $754.37 | 47.1 | -3.5% | $741.03 | $731.53 | $763.04 | $731.53 | $775.64 | Rebound stalled under the 20-day average |
| QQQ | $679.89 | 42.8 | -10.9% | $662.02 | $647.05 | $682.24 | $647.05 | $695.57 | Rebound lost the 200-day line on Friday |
| SOXX | $149.30 | 42.1 | -31.7% | $137.97 | $130.75 | $156.83 | $130.75 | $160.39 | Strong rebound still below every major average |
| MSFT | $523.88 | 48.8 | -6.3% | $513.82 | $504.96 | $548.28 | $504.96 | $559.15 | Range with a lower high this week |
| GOOGL | $295.77 | 40.6 | -27.6% | $285.68 | $278.50 | $303.42 | $272.11 | $314.90 | Base building below the 20-day average |
| AMZN | $266.66 | 57.4 | -7.2% | $263.91 | $255.19 | $274.75 | $244.51 | $287.20 | Uptrend intact and rejected at the old bounce line |
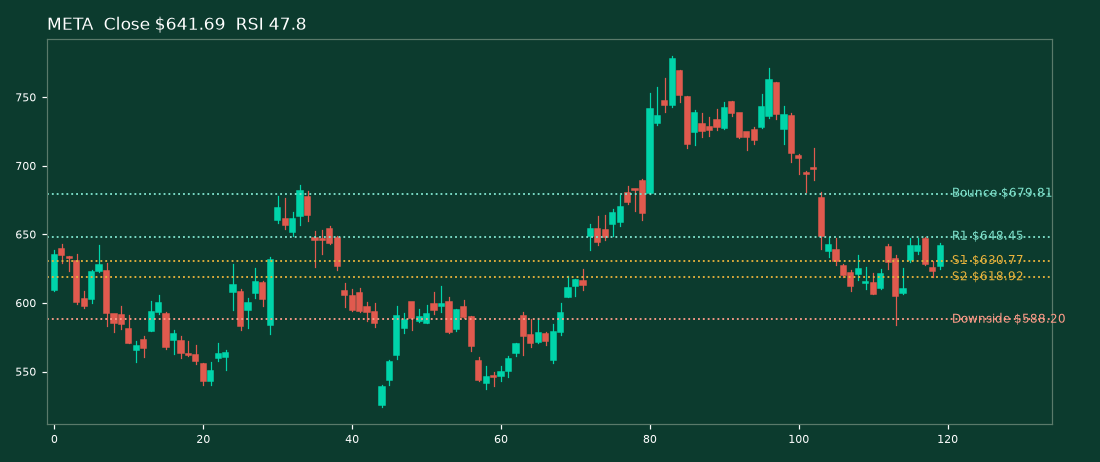
| META | $641.69 | 47.8 | -17.7% | $630.77 | $618.92 | $648.45 | $588.20 | $679.81 | Rebound rejected at the old bounce line |
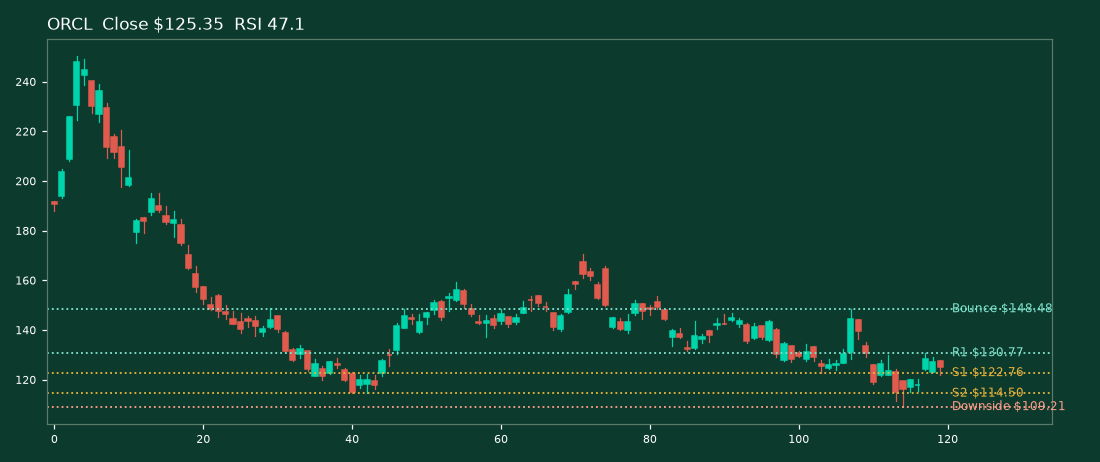
| ORCL | $125.35 | 47.1 | -49.9% | $122.76 | $114.50 | $130.77 | $109.21 | $148.48 | Bounce attempt inside a downtrend |
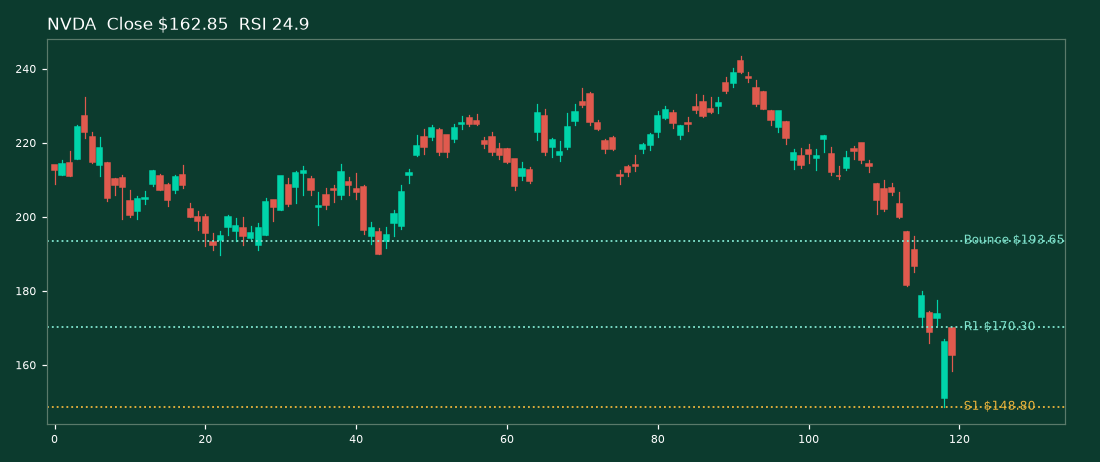
| NVDA | $162.85 | 24.9 | -33.1% | $148.80 | Open air | $170.30 | Open air | $193.65 | Breakdown ahead of earnings on November 17 |
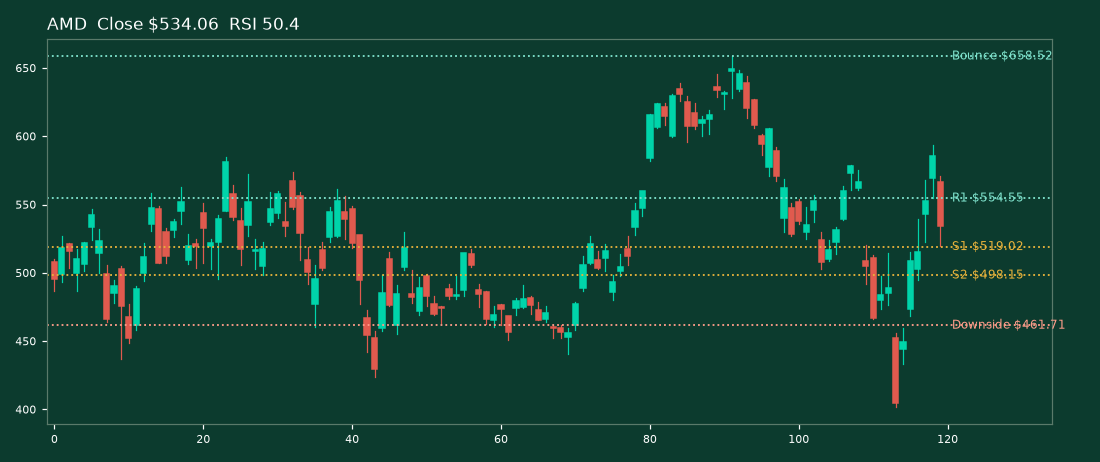
| AMD | $534.06 | 50.4 | -18.9% | $519.02 | $498.15 | $554.55 | $461.71 | $658.52 | Sharp rebound into the 50-day average |
| AVGO | $347.01 | 53.2 | -29.9% | $345.38 | $335.81 | $367.42 | $321.42 | $378.71 | Rebound testing the 200-day average |
| MRVL | $156.76 | 35.2 | -52.5% | $146.85 | $132.54 | $170.84 | $132.54 | $187.00 | Rebound still far below the averages |
| MU | $778.31 | 42.5 | -38.0% | $765.61 | $737.88 | $818.67 | $651.11 | $838.00 | Rebound held the 200-day average |
| INTC | $59.66 | 32.4 | -58.1% | $55.83 | $51.51 | $64.06 | $42.28 | $68.50 | Oversold rebound with no average reclaimed |
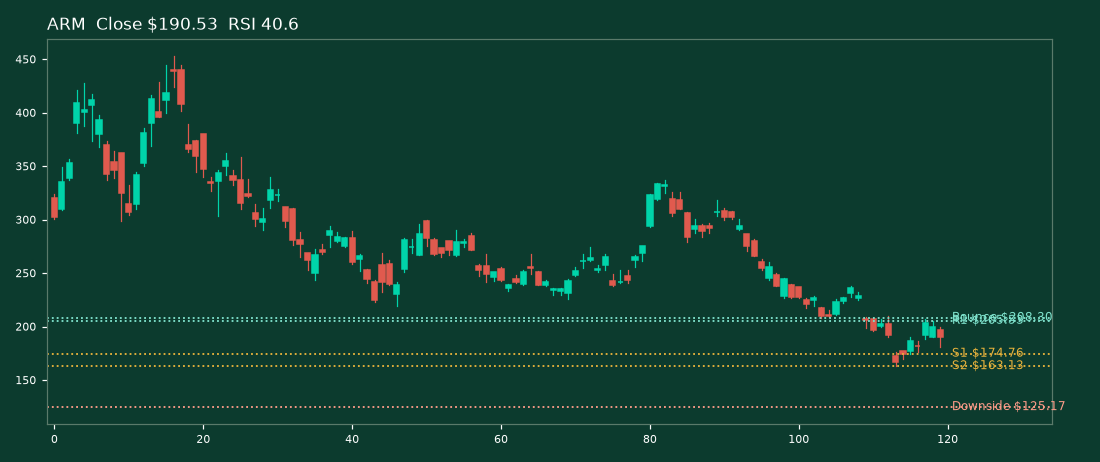
| ARM | $190.53 | 40.6 | -57.9% | $174.76 | $163.13 | $205.53 | $125.17 | $208.30 | Rebound touched the old bounce shelf and faded |
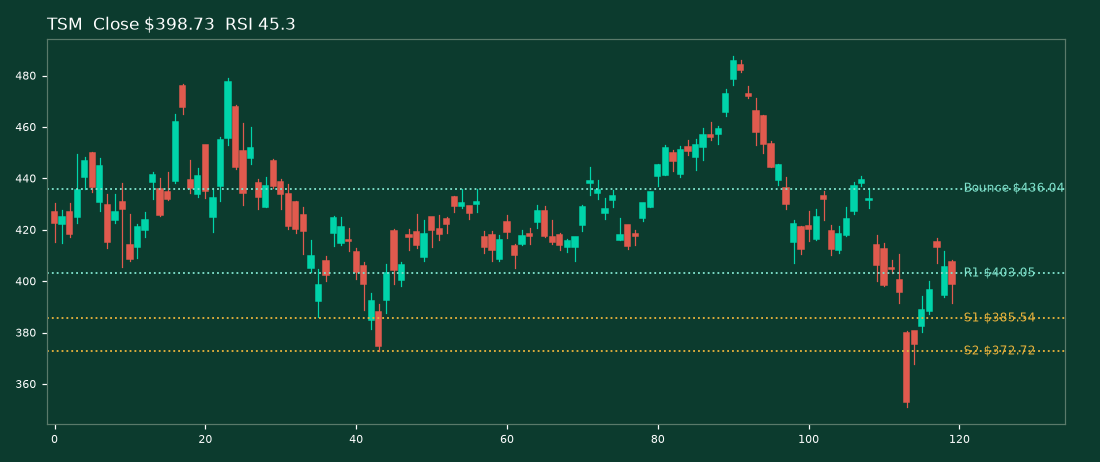
| TSM | $398.73 | 45.3 | -18.2% | $385.54 | $372.72 | $403.05 | $372.72 | $436.04 | Rebound lost the 200-day line again |
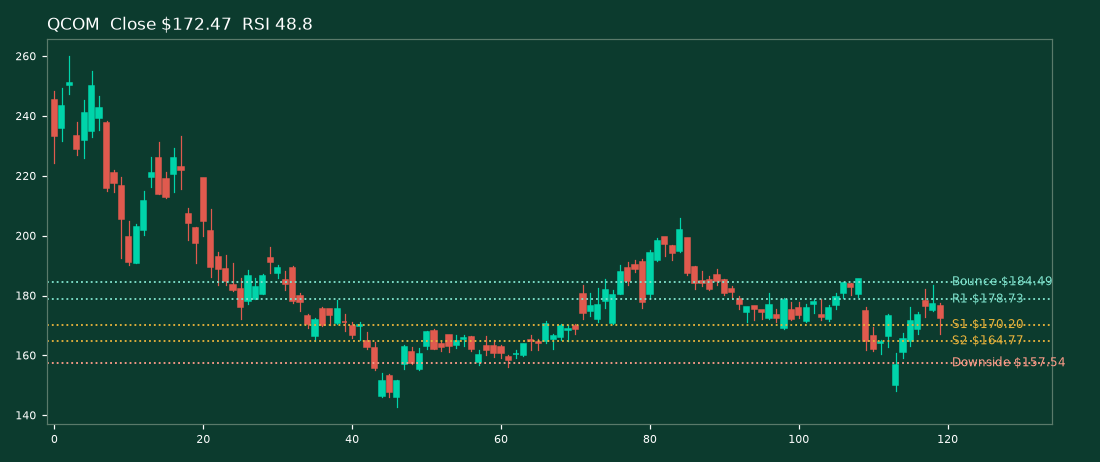
| QCOM | $172.47 | 48.8 | -33.6% | $170.20 | $164.77 | $178.73 | $157.54 | $184.49 | Holding the 200-day line and testing the 50-day |
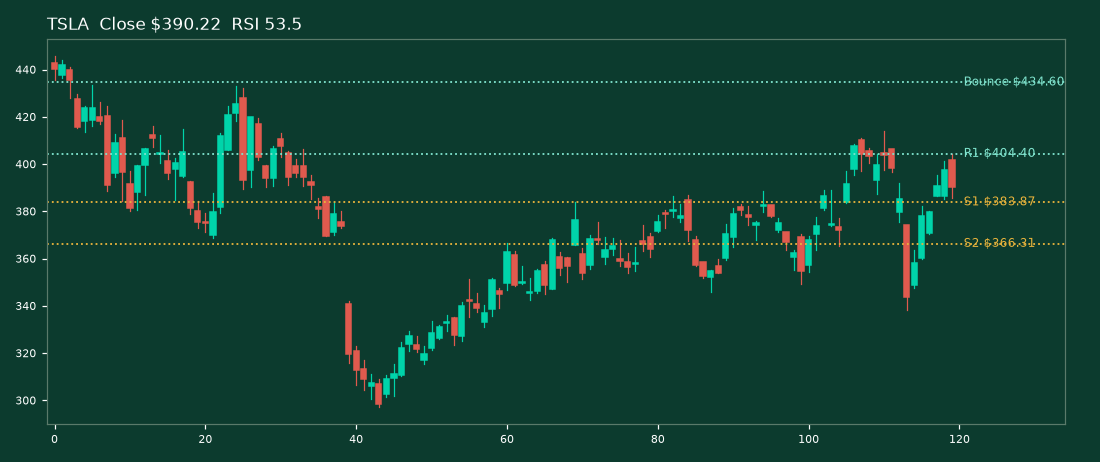
| TSLA | $390.22 | 53.5 | -21.8% | $383.87 | $366.31 | $404.40 | $366.31 | $434.60 | Rebound broke above and held |
| SPCX | $139.11 | 46.4 | nan% | $135.37 | $130.39 | $147.60 | $120.39 | $155.00 | Range building above the old support shelf |
| BB | $8.90 | 50.9 | -34.5% | $8.60 | $8.40 | $9.28 | $7.99 | $9.64 | Range with a rejection at the bounce shelf |
| NBIS | $115.88 | 35.8 | -61.4% | $113.30 | $109.00 | $132.30 | $95.30 | $168.71 | Violent round trip and a new low for the move |
| AKAM | $85.40 | 41.8 | -48.4% | $82.70 | $77.37 | $88.60 | $77.37 | $99.94 | Repair attempt still below the 20-day average |
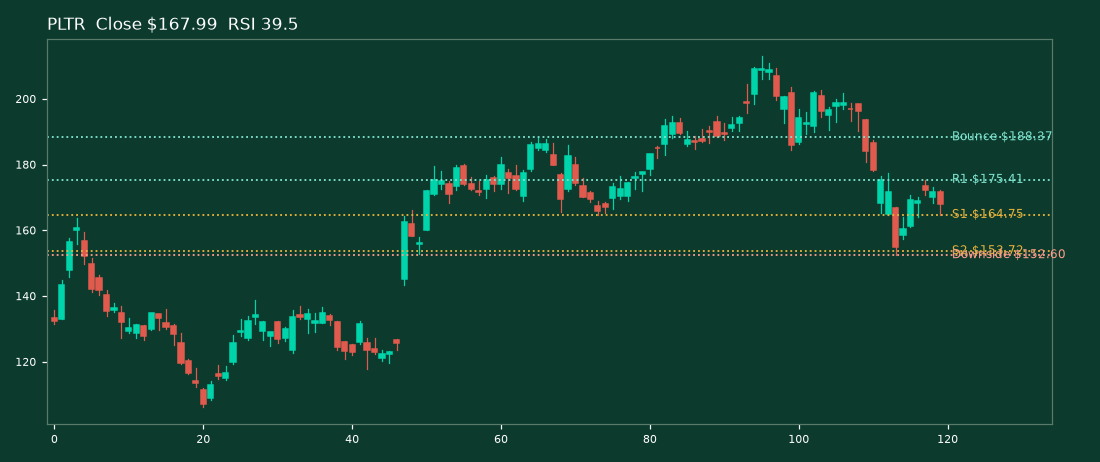
| PLTR | $167.99 | 39.5 | -21.1% | $164.75 | $153.72 | $175.41 | $152.60 | $188.37 | Rebound held well above the 200-day average |
What do the three gauges charts say now?
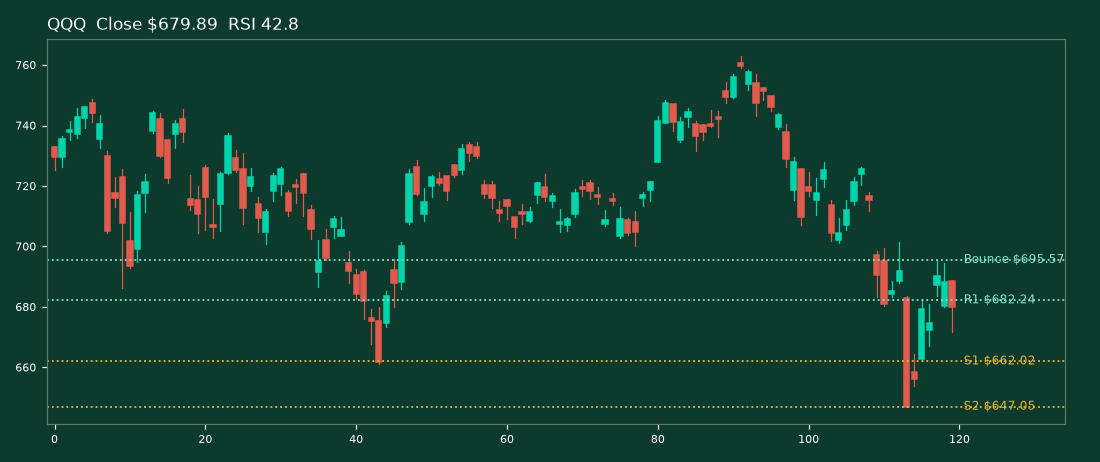
SPY (S&P 500 ETF). Bias. Rebound stalled under the 20-day average.
The tape. Close $754.37. Week +2.59%. RSI 47.1. ATR $10.50. 20 DMA $759.02. 50 DMA $764.43. 200 DMA $731.92. From the 52-week high -3.5%.
The levels. Support at $741.03 and $731.53. Resistance at $763.04. Downside target $731.53. Bounce target $775.64.
SPY rose 2.59 percent on the week. It closed above its old bounce target on Wednesday and then lost that line on Thursday and Friday. The index still sits above its 200-day average. The rebound is alive and it has not reclaimed the 20-day average yet.
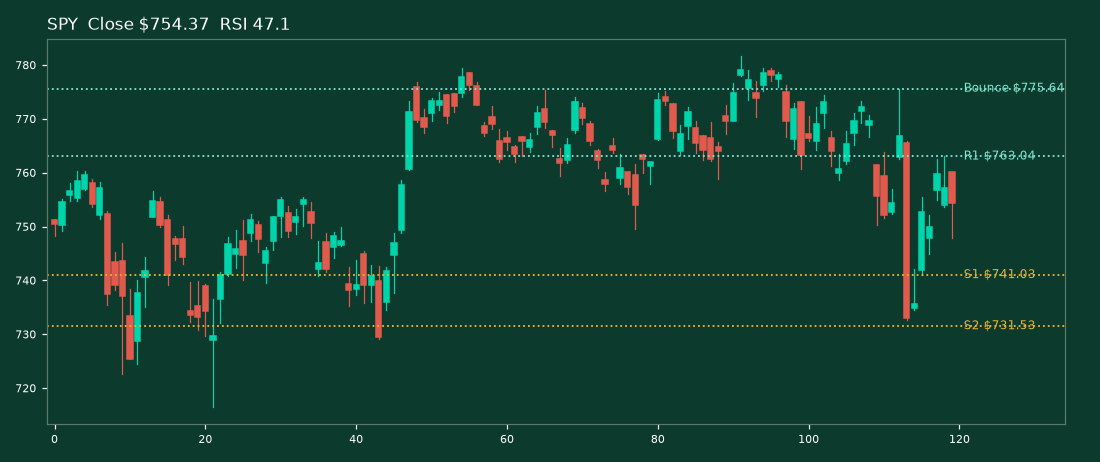
QQQ (Nasdaq 100 ETF). Bias. Rebound lost the 200-day line on Friday.
The tape. Close $679.89. Week +3.63%. RSI 42.8. ATR $14.30. 20 DMA $695.45. 50 DMA $717.87. 200 DMA $682.24. From the 52-week high -10.9%.
The levels. Support at $662.02 and $647.05. Resistance at $682.24. Downside target $647.05. Bounce target $695.57.
QQQ rose 3.63 percent on the week. It closed above its 200-day average in midweek and closed back below it on Friday at $679.89 against a $682.24 average. That one line is the week ahead in one number.
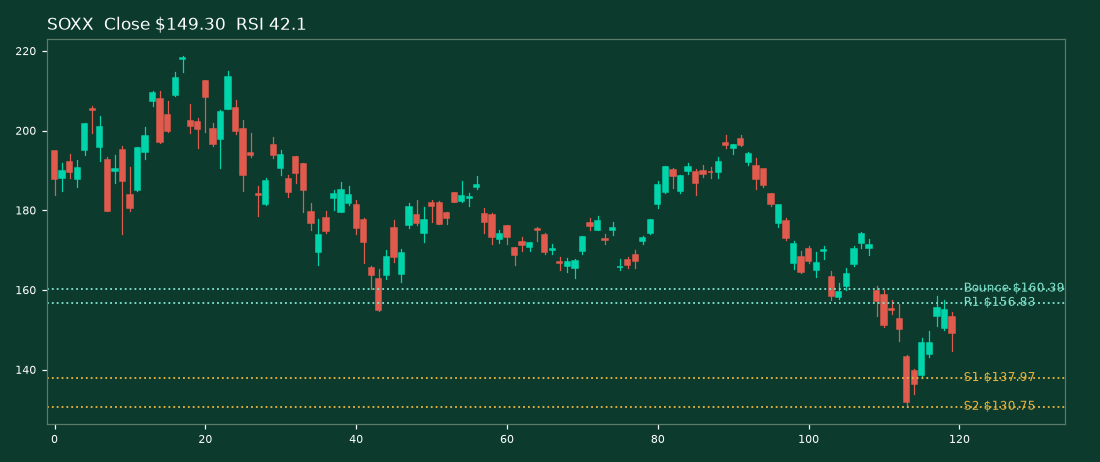
SOXX (Semiconductor ETF). Bias. Strong rebound still below every major average.
The tape. Close $149.30. Week +9.35%. RSI 42.1. ATR $7.43. 20 DMA $156.83. 50 DMA $171.90. 200 DMA $160.39. From the 52-week high -31.7%.
The levels. Support at $137.97 and $130.75. Resistance at $156.83. Downside target $130.75. Bounce target $160.39.
SOXX rose 9.35 percent on the week and still closed 31.7 percent below its high. Its high of $158.58 stopped just short of the $159.56 bounce target. Price never came near the roughly $125 monthly 20-period average on the way up or down this week. The week's low was $137.97. That distance is the learning input recorded for the next method review.
What do the hyperscalers charts say now?
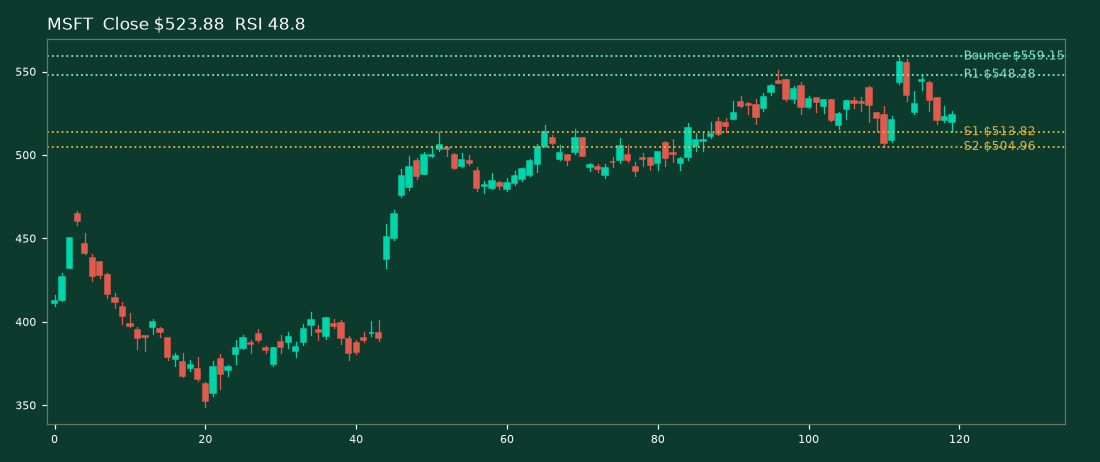
Microsoft (MSFT). Bias. Range with a lower high this week.
The tape. Close $523.88. Week -1.27%. RSI 48.8. ATR $15.04. 20 DMA $529.39. 50 DMA $519.00. 200 DMA $441.42. From the 52-week high -6.3%.
The levels. Support at $513.82 and $504.96. Resistance at $548.28. Downside target $504.96. Bounce target $559.15.
Microsoft fell 1.27 percent on the week and was the only hyperscaler to close lower. Neither target was tested. The stock made a lower high at $548.28 and drifted back toward its 50-day average.
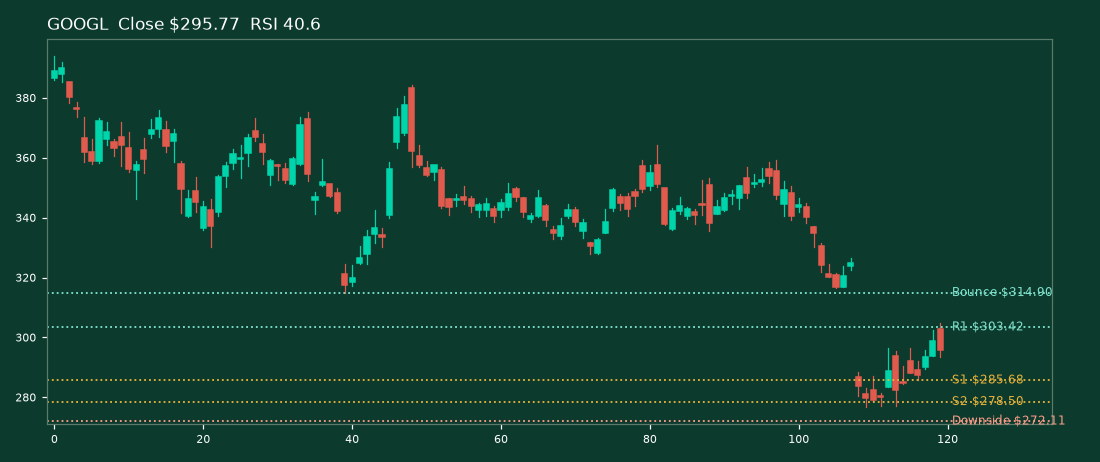
Alphabet (GOOGL). Bias. Base building below the 20-day average.
The tape. Close $295.77. Week +3.86%. RSI 40.6. ATR $8.31. 20 DMA $303.42. 50 DMA $328.19. 200 DMA $338.48. From the 52-week high -27.6%.
The levels. Support at $285.68 and $278.50. Resistance at $303.42. Downside target $272.11. Bounce target $314.90.
Alphabet rose 3.86 percent and kept building its base. Neither target was tested. The 20-day average at $303.42 is the first line overhead.
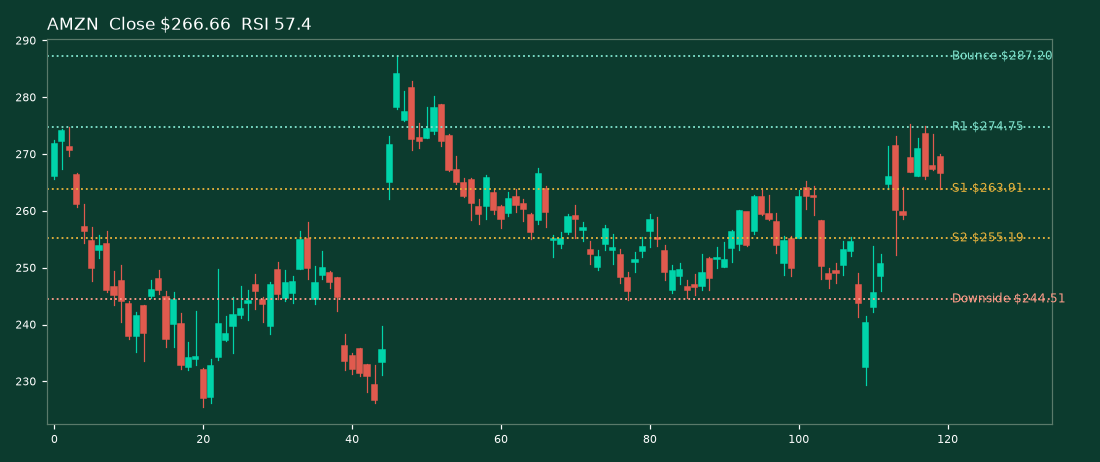
Amazon (AMZN). Bias. Uptrend intact and rejected at the old bounce line.
The tape. Close $266.66. Week +2.84%. RSI 57.4. ATR $8.48. 20 DMA $257.33. 50 DMA $254.81. 200 DMA $244.60. From the 52-week high -7.2%.
The levels. Support at $263.91 and $255.19. Resistance at $274.75. Downside target $244.51. Bounce target $287.20.
Amazon rose 2.84 percent. Its intraday high of $275.34 probed the $274.75 bounce target and every close stayed below it. That is a rejection at a marked line and it leaves the uptrend intact underneath.
Meta (META). Bias. Rebound rejected at the old bounce line.
The tape. Close $641.69. Week +5.17%. RSI 47.8. ATR $18.40. 20 DMA $637.06. 50 DMA $679.81. 200 DMA $630.77. From the 52-week high -17.7%.
The levels. Support at $630.77 and $618.92. Resistance at $648.45. Downside target $588.20. Bounce target $679.81.
Meta rose 5.17 percent. Price probed the $642.70 bounce target on three sessions and never closed above it. The 200-day average at $630.77 now sits underneath as the first support shelf.
Oracle (ORCL). Bias. Bounce attempt inside a downtrend.
The tape. Close $125.35. Week +7.97%. RSI 47.1. ATR $8.20. 20 DMA $126.60. 50 DMA $136.67. 200 DMA $154.11. From the 52-week high -49.9%.
The levels. Support at $122.76 and $114.50. Resistance at $130.77. Downside target $109.21. Bounce target $148.48.
Oracle rose 7.97 percent. Its high of $130.77 stopped just short of the $131.58 bounce target. The bounce remains an attempt inside a downtrend until a close clears that shelf.
What do the semiconductors charts say now?
NVIDIA (NVDA). Bias. Breakdown ahead of earnings on November 17.
The tape. Close $162.85. Week -12.75%. RSI 24.9. ATR $8.49. 20 DMA $198.69. 50 DMA $214.65. 200 DMA $204.19. From the 52-week high -33.1%.
The levels. Support at $148.80 and Open air. Resistance at $170.30. Downside target Open air. Bounce target $193.65.
NVIDIA fell 12.75 percent and was the only name to hit and break below its downside target. It closed below $170.30 on Tuesday and kept falling to a $148.80 low on Thursday. There is no clustered shelf under that low. That is open air. Open air means no marked support shelf remains under the price on the past year of daily bars. NVIDIA reports earnings on Tuesday, November 17, 2026 after the close. The map makes no call on that print.
AMD (AMD). Bias. Sharp rebound into the 50-day average.
The tape. Close $534.06. Week +18.93%. RSI 50.4. ATR $35.90. 20 DMA $519.02. 50 DMA $554.55. 200 DMA $423.12. From the 52-week high -18.9%.
The levels. Support at $519.02 and $498.15. Resistance at $554.55. Downside target $461.71. Bounce target $658.52.
AMD rose 18.93 percent and was the strongest name in the map. It closed above its $498.70 bounce target on Monday and held above it all week. The 50-day average at $554.55 stopped the run on Friday.
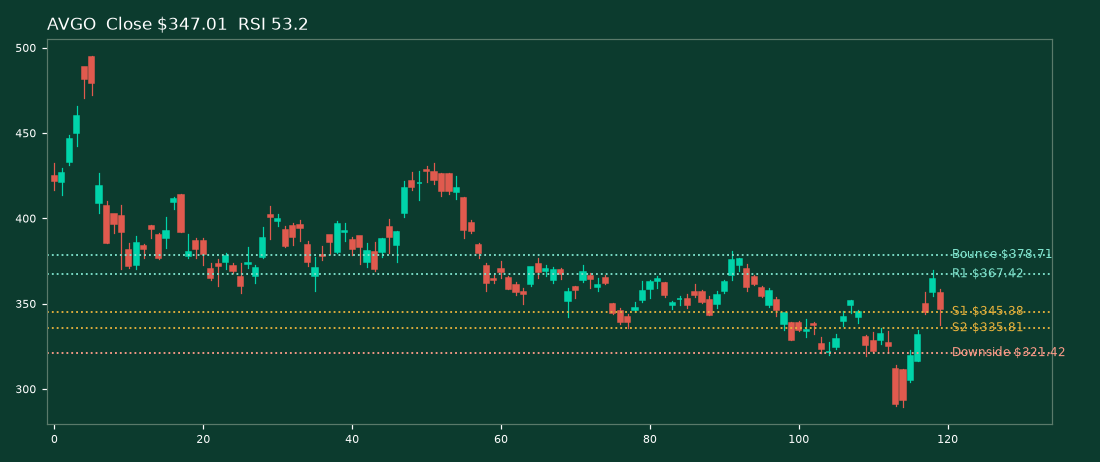
Broadcom (AVGO). Bias. Rebound testing the 200-day average.
The tape. Close $347.01. Week +18.16%. RSI 53.2. ATR $14.35. 20 DMA $330.96. 50 DMA $345.38. 200 DMA $367.42. From the 52-week high -29.9%.
The levels. Support at $345.38 and $335.81. Resistance at $367.42. Downside target $321.42. Bounce target $378.71.
Broadcom rose 18.16 percent. It closed above its $335.81 bounce target on Tuesday and held it. The 200-day average at $367.42 is the next test and price probed it on Thursday.
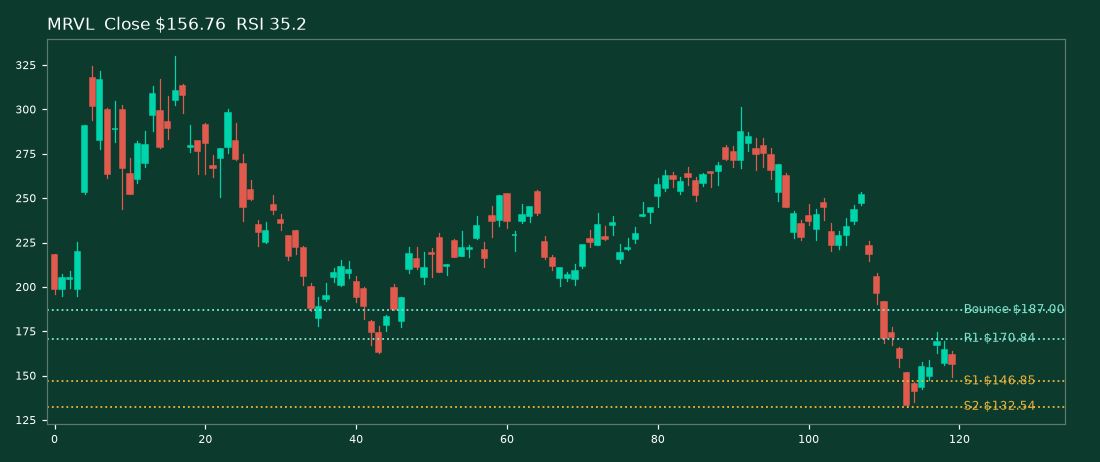
Marvell (MRVL). Bias. Rebound still far below the averages.
The tape. Close $156.76. Week +11.02%. RSI 35.2. ATR $13.51. 20 DMA $194.75. 50 DMA $229.21. 200 DMA $187.00. From the 52-week high -52.5%.
The levels. Support at $146.85 and $132.54. Resistance at $170.84. Downside target $132.54. Bounce target $187.00.
Marvell rose 11.02 percent. Neither target was tested. The rebound still sits far below its 20-day average at $194.75.
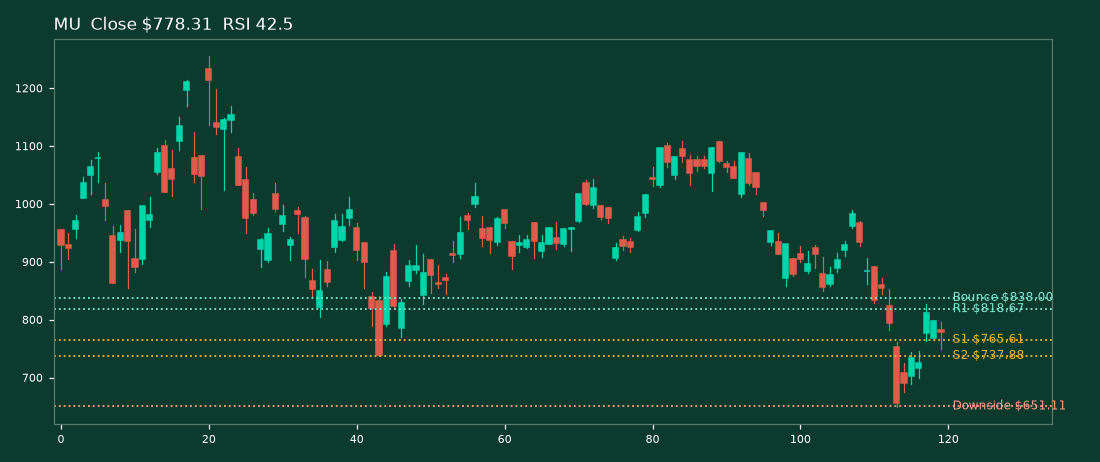
Micron (MU). Bias. Rebound held the 200-day average.
The tape. Close $778.31. Week +12.80%. RSI 42.5. ATR $50.88. 20 DMA $838.00. 50 DMA $943.78. 200 DMA $765.61. From the 52-week high -38.0%.
The levels. Support at $765.61 and $737.88. Resistance at $818.67. Downside target $651.11. Bounce target $838.00.
Micron rose 12.80 percent. It closed above its $756.73 bounce target and held above its 200-day average at $765.61 on Friday. That hold is the cleanest repair in the semiconductor group.
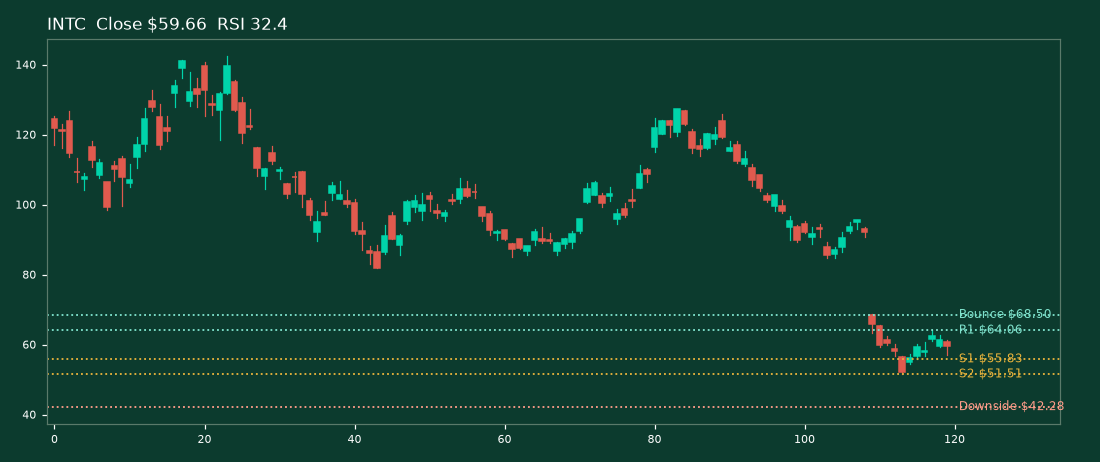
Intel (INTC). Bias. Oversold rebound with no average reclaimed.
The tape. Close $59.66. Week +6.01%. RSI 32.4. ATR $3.81. 20 DMA $73.74. 50 DMA $94.97. 200 DMA $87.40. From the 52-week high -58.1%.
The levels. Support at $55.83 and $51.51. Resistance at $64.06. Downside target $42.28. Bounce target $68.50.
Intel rose 6.01 percent. Neither target was tested. The rebound has reclaimed no major average yet.
Arm (ARM). Bias. Rebound touched the old bounce shelf and faded.
The tape. Close $190.53. Week +9.11%. RSI 40.6. ATR $12.17. 20 DMA $205.53. 50 DMA $248.14. 200 DMA $232.82. From the 52-week high -57.9%.
The levels. Support at $174.76 and $163.13. Resistance at $205.53. Downside target $125.17. Bounce target $208.30.
Arm rose 9.11 percent. Its high of $207.44 stopped just short of the $208.30 bounce target and the stock faded to $190.53 by Friday. The shelf is marked again for next week at nearly the same line.
TSMC (TSM). Bias. Rebound lost the 200-day line again.
The tape. Close $398.73. Week +6.20%. RSI 45.3. ATR $14.06. 20 DMA $408.86. 50 DMA $430.11. 200 DMA $403.05. From the 52-week high -18.2%.
The levels. Support at $385.54 and $372.72. Resistance at $403.05. Downside target $372.72. Bounce target $436.04.
TSMC rose 6.20 percent. It closed above its $401.48 bounce target on Wednesday and lost it by Friday. The 200-day average at $403.05 is now the resistance shelf.
Qualcomm (QCOM). Bias. Holding the 200-day line and testing the 50-day.
The tape. Close $172.47. Week +4.27%. RSI 48.8. ATR $8.78. 20 DMA $173.30. 50 DMA $178.73. 200 DMA $170.20. From the 52-week high -33.6%.
The levels. Support at $170.20 and $164.77. Resistance at $178.73. Downside target $157.54. Bounce target $184.49.
Qualcomm rose 4.27 percent. Its high of $183.40 stopped just short of the $184.49 bounce target. It held its 200-day average all week and is testing its 50-day average.
What do the Tesla and SpaceX charts say now?
Tesla (TSLA). Bias. Rebound broke above and held.
The tape. Close $390.22. Week +8.93%. RSI 53.5. ATR $15.79. 20 DMA $385.36. 50 DMA $374.74. 200 DMA $382.73. From the 52-week high -21.8%.
The levels. Support at $383.87 and $366.31. Resistance at $404.40. Downside target $366.31. Bounce target $434.60.
Tesla rose 8.93 percent. It closed above its $383.87 bounce target on Wednesday and held above it through Friday. The average stack now sits underneath the price.
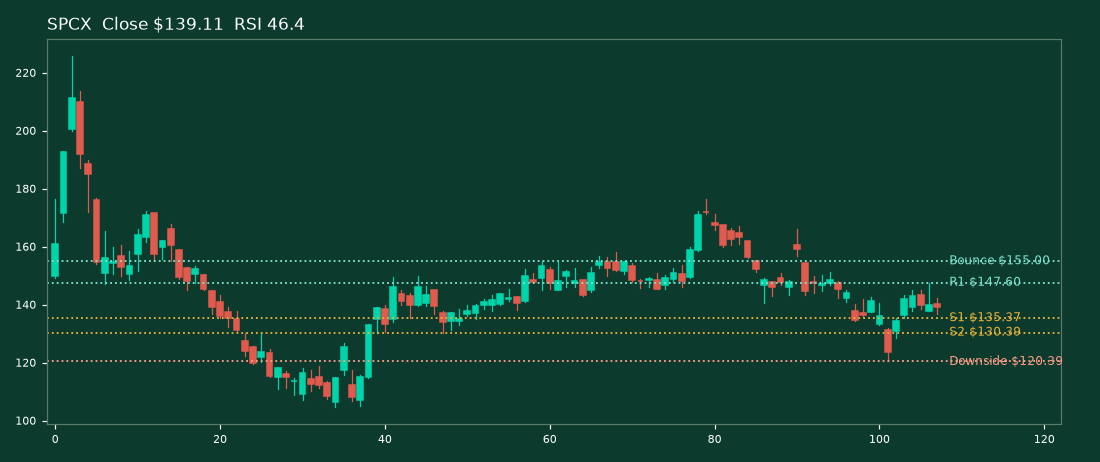
SpaceX (SPCX). Bias. Range building above the old support shelf.
The tape. Close $139.11. Week +3.60%. RSI 46.4. ATR $6.76. 20 DMA $142.10. 50 DMA $148.90. No 200 DMA yet. From the 52-week high nan%.
The levels. Support at $135.37 and $130.39. Resistance at $147.60. Downside target $120.39. Bounce target $155.00.
SpaceX rose 3.60 percent. Neither target was tested. The stock built a range above its $130.39 support shelf.
What do the crowd names charts say now?
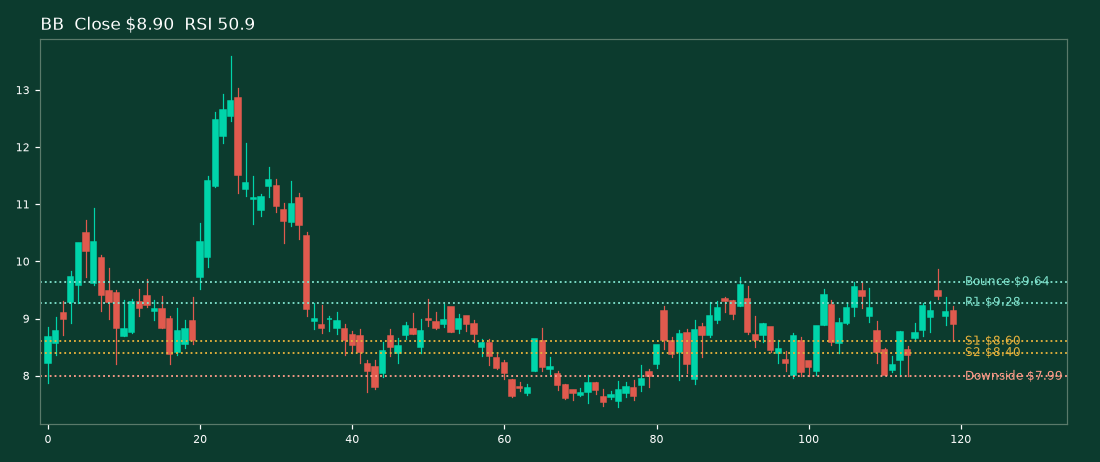
BlackBerry (BB). Bias. Range with a rejection at the bounce shelf.
The tape. Close $8.90. Week +1.83%. RSI 50.9. ATR $0.54. 20 DMA $8.88. 50 DMA $8.59. 200 DMA $7.11. From the 52-week high -34.5%.
The levels. Support at $8.60 and $8.40. Resistance at $9.28. Downside target $7.99. Bounce target $9.64.
BlackBerry rose 1.83 percent. Its high of $9.86 probed the $9.64 bounce target and no close cleared it. The stock stays in its range above every major average.
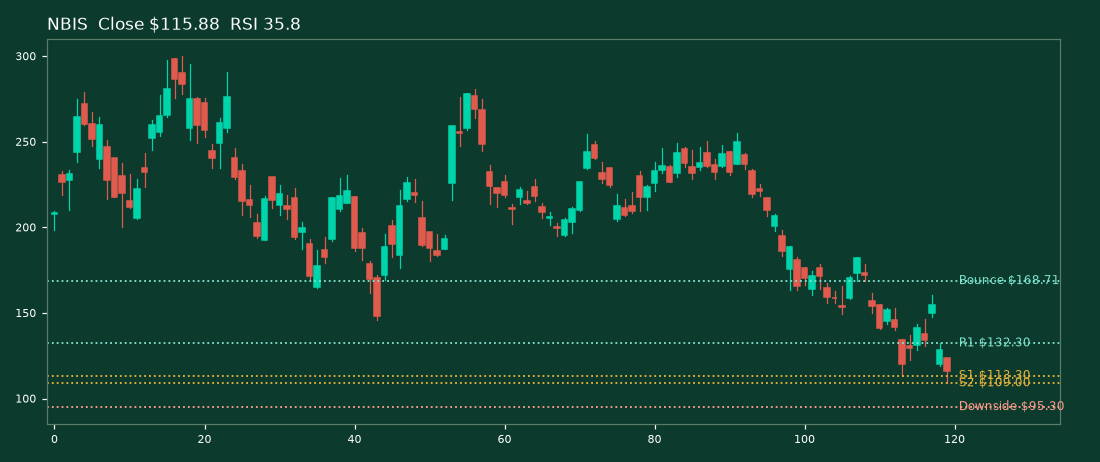
Nebius (NBIS). Bias. Violent round trip and a new low for the move.
The tape. Close $115.88. Week -10.51%. RSI 35.8. ATR $13.74. 20 DMA $151.12. 50 DMA $194.60. 200 DMA $179.35. From the 52-week high -61.4%.
The levels. Support at $113.30 and $109.00. Resistance at $132.30. Downside target $95.30. Bounce target $168.71.
Nebius fell 10.51 percent in the wildest week in the map. It spiked to $160.21 on Wednesday and then fell to a $109.00 low on Friday after its earnings reaction reversed. Neither graded target was tested. The new low resets the support shelves underneath.
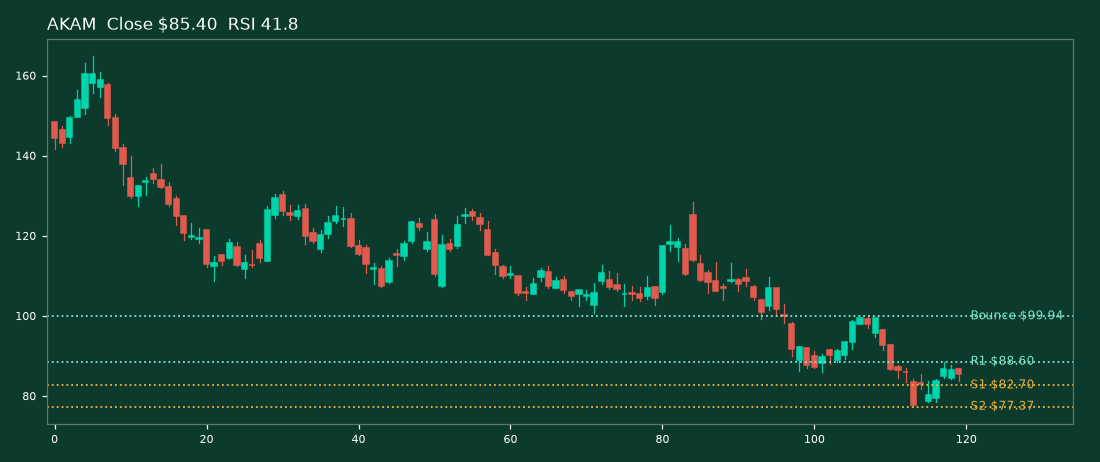
Akamai (AKAM). Bias. Repair attempt still below the 20-day average.
The tape. Close $85.40. Week +2.78%. RSI 41.8. ATR $4.30. 20 DMA $89.14. 50 DMA $99.32. 200 DMA $111.96. From the 52-week high -48.4%.
The levels. Support at $82.70 and $77.37. Resistance at $88.60. Downside target $77.37. Bounce target $99.94.
Akamai rose 2.78 percent. Neither target was tested. Price dipped to $78.40 on Tuesday and recovered. The repair attempt still sits below the 20-day average at $89.14.
Palantir (PLTR). Bias. Rebound held well above the 200-day average.
The tape. Close $167.99. Week +4.74%. RSI 39.5. ATR $8.54. 20 DMA $182.36. 50 DMA $184.79. 200 DMA $153.72. From the 52-week high -21.1%.
The levels. Support at $164.75 and $153.72. Resistance at $175.41. Downside target $152.60. Bounce target $188.37.
Palantir rose 4.74 percent. Neither target was tested. The rebound held well above the 200-day average at $153.72 all week.
Frequently asked questions
How did the November 6 technical targets grade this week?
Downside targets were untested in 19 of the 20 names that carried a numeric target. NVIDIA was the only break. It hit its $170.30 target and closed below it. Three names had open air instead of a numeric downside target and none of them fell to a new shelf. On the bounce side four targets broke above and held. Three broke above and were then lost. Three were hit and rejected. Four were touched intraday only. Nine were untested.
What price levels matter most in the week ahead?
QQQ closed Friday at $679.89 and sits just below its 200-day average at $682.24. SPY closed at $754.37 and holds above its 200-day average at $731.92. SOXX closed at $149.30 and faces its 20-day average at $156.83 first. NVIDIA reports on November 17 with no clustered support under its $148.80 low. That open air below is the largest single-name risk on the map.
Was this week's rebound a confirmed bottom?
No. The rebound was broad and strong in the most damaged names. AMD rose 18.93 percent and Broadcom rose 18.16 percent. But both gauges that broke above their bounce targets then lost them by Friday. SPY and QQQ both did that. Confirmation needs a higher low on a retest and closes that hold above the reclaimed lines.
Are these price targets fundamental valuations?
No. Every target in this edition is a technical level. It is the next marked support below the price or the first marked resistance above it. Levels are measured on daily bars through the close of November 13, 2026. They describe where buying and selling interest has appeared before. They are not valuations and they are not recommendations.
This edition is technical analysis for education. It is not investment advice and it is not a recommendation to buy or sell any security. Levels are drawn from public price data as of November 13, 2026.