Frequently asked questions
Why is the equal-weight S&P 500 underperforming the cap-weighted index?
Because seven companies are generating most of the earnings growth. Since 2022 the Magnificent 7 added roughly $400B in cumulative earnings versus $358B for the other 493 combined. In 2024 the Mag 7 grew earnings 36.5% against 4.9% for the rest (FactSet). Cap-weighting follows the earnings; equal-weighting fights them.
Does this concentration mean the market is in a bubble like 2000?
The 2000 comparison fails on earnings. Then, the narrow market leaders traded at triple-digit multiples on hope, with little profit behind the prices. This time the Mag 7's aggregate earnings grew about 79% in two years (2022-24), from roughly $270B to $483B. The divergence is earnings-backed, which is a different phenomenon than multiple expansion on speculation.
Should I switch from a cap-weighted to an equal-weight index fund?
Equal weight is a bet that earnings breadth keeps improving faster than the leaders grow. Breadth is genuinely improving: the other 493 are estimated to grow earnings about 10% in 2026 versus 4.9% in 2024. But switching after a 24-year record lag means selling the earnings compounders at the moment they are still compounding. For most index investors, staying the course is the calmer choice.
What is the viral chart actually showing?
A chart making the rounds on LinkedIn plots the S&P 500 against its equal-weight sibling across two booms. In the dot-com boom (1995-2000), the cap-weighted index gained 170% while the equal-weight version gained 101.76%. In the AI boom (2022 to present), the cap-weighted index is up 118.06% while equal weight is up 66.50%. The gap between the two is now the widest in more than 24 years.
The implication being whispered is obvious: the last time breadth was this narrow, it ended in the dot-com crash. Pullbacks can be expected in any market, and nobody should dismiss concentration risk. But before accepting the 2000 analogy, it is worth asking a simpler question: where did the earnings go?
Who added the earnings since 2022?
Here is the same period, measured in dollars of earnings added rather than index points:
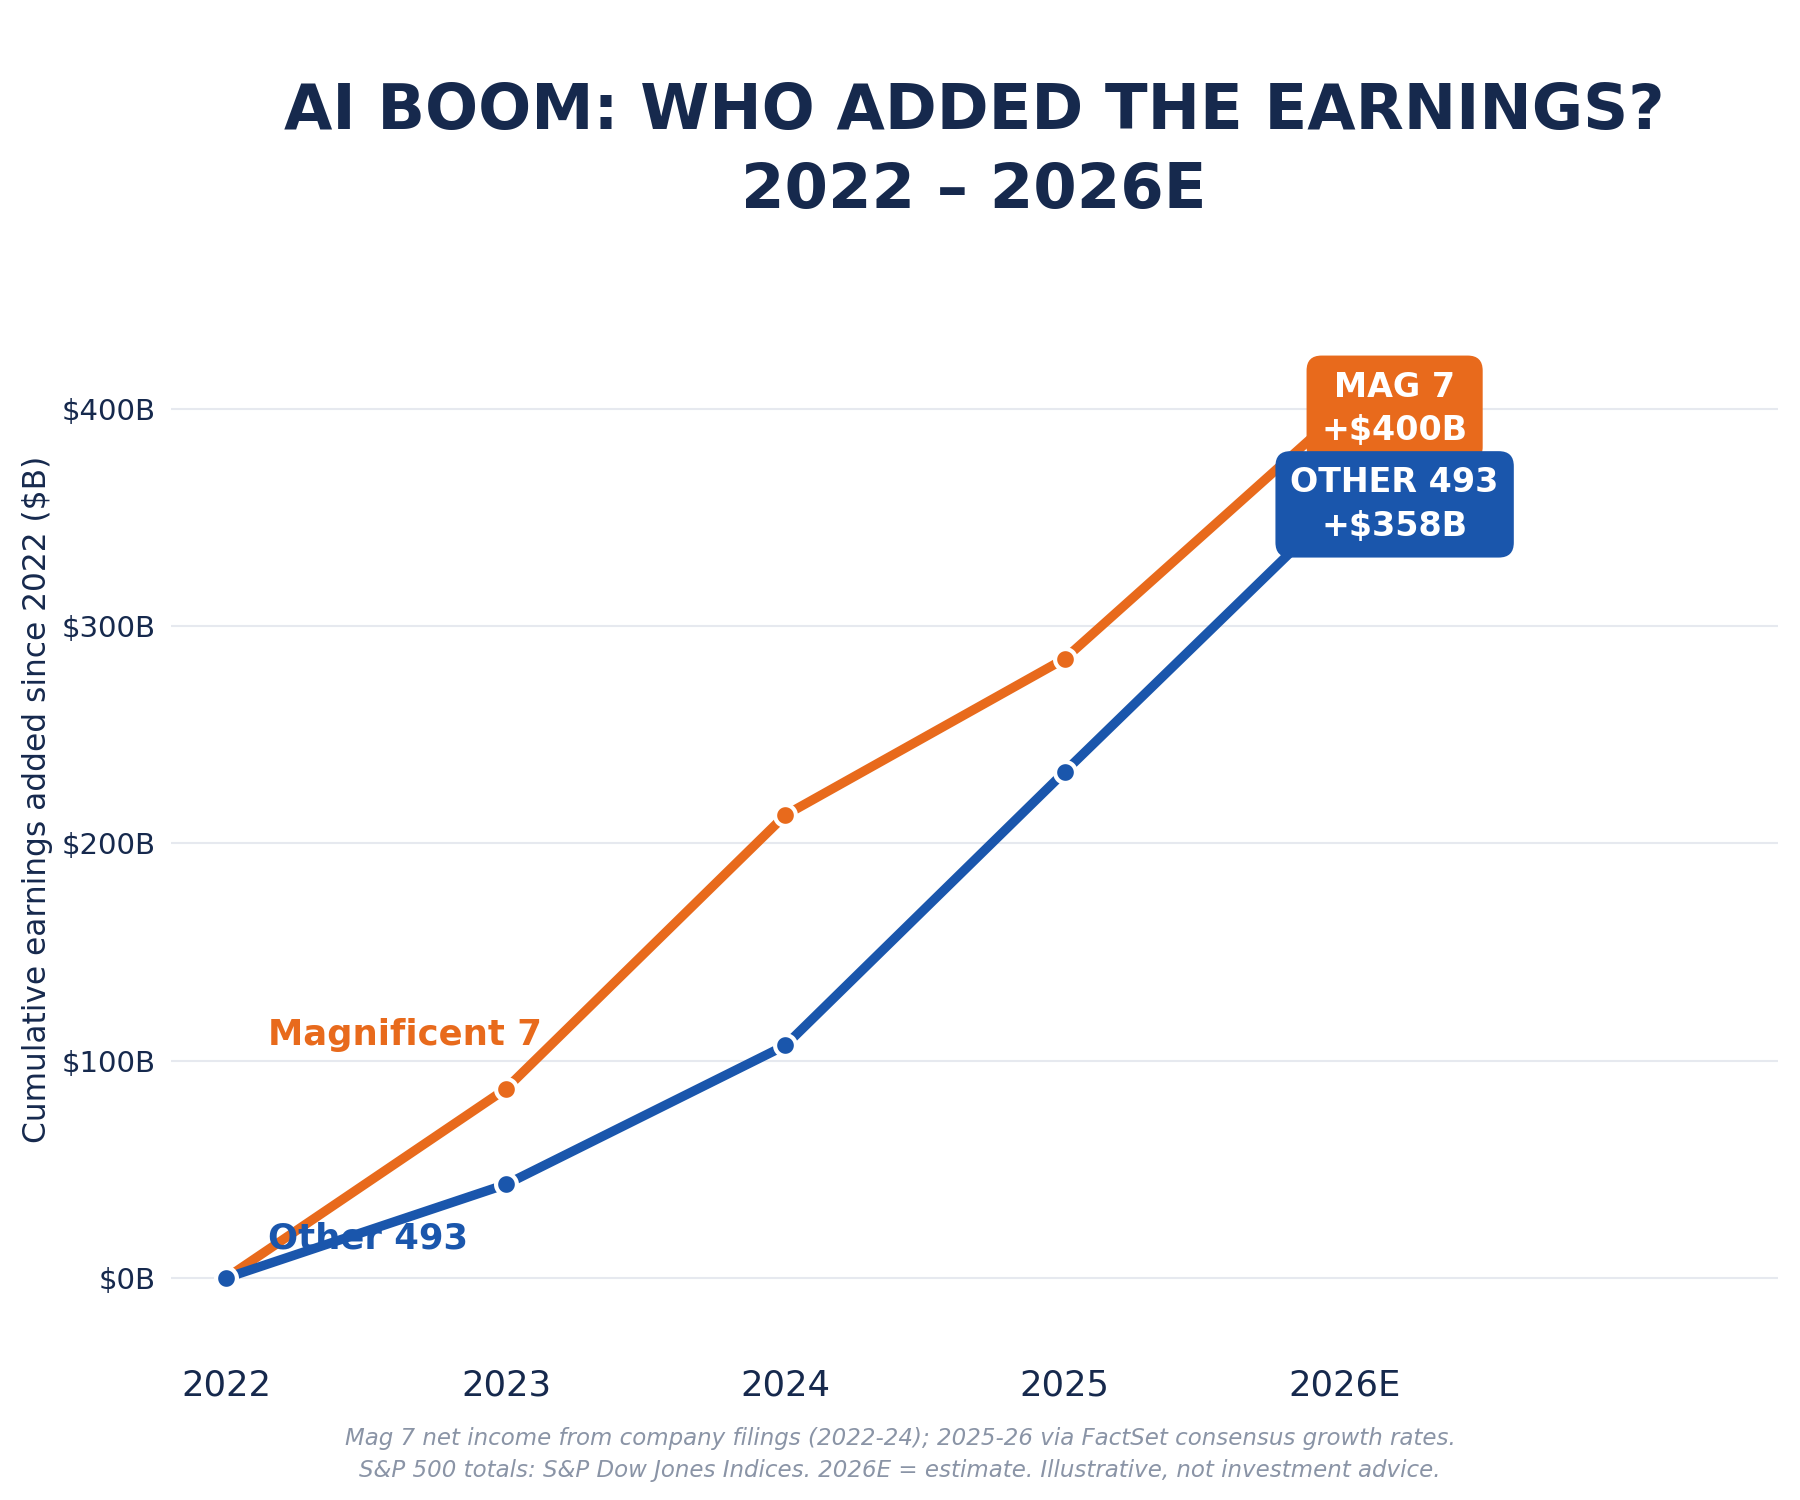
The equal-weight index is not underperforming because of some market malfunction. It is underperforming because seven companies out-earned 493 companies in incremental dollars. Cap-weighting follows the earnings. Equal-weighting fights them, and the fight has a cost.
How wide was the earnings gap?
The annual growth rates make the mechanism precise. In 2024, the Magnificent 7 grew aggregate earnings 36.5% while the other 493 managed 4.9% (FactSet), a gap of more than 30 percentage points. Estimates for 2025 narrow it to 15.9% versus 8.3%, and 2026 to roughly 21% versus 10%.
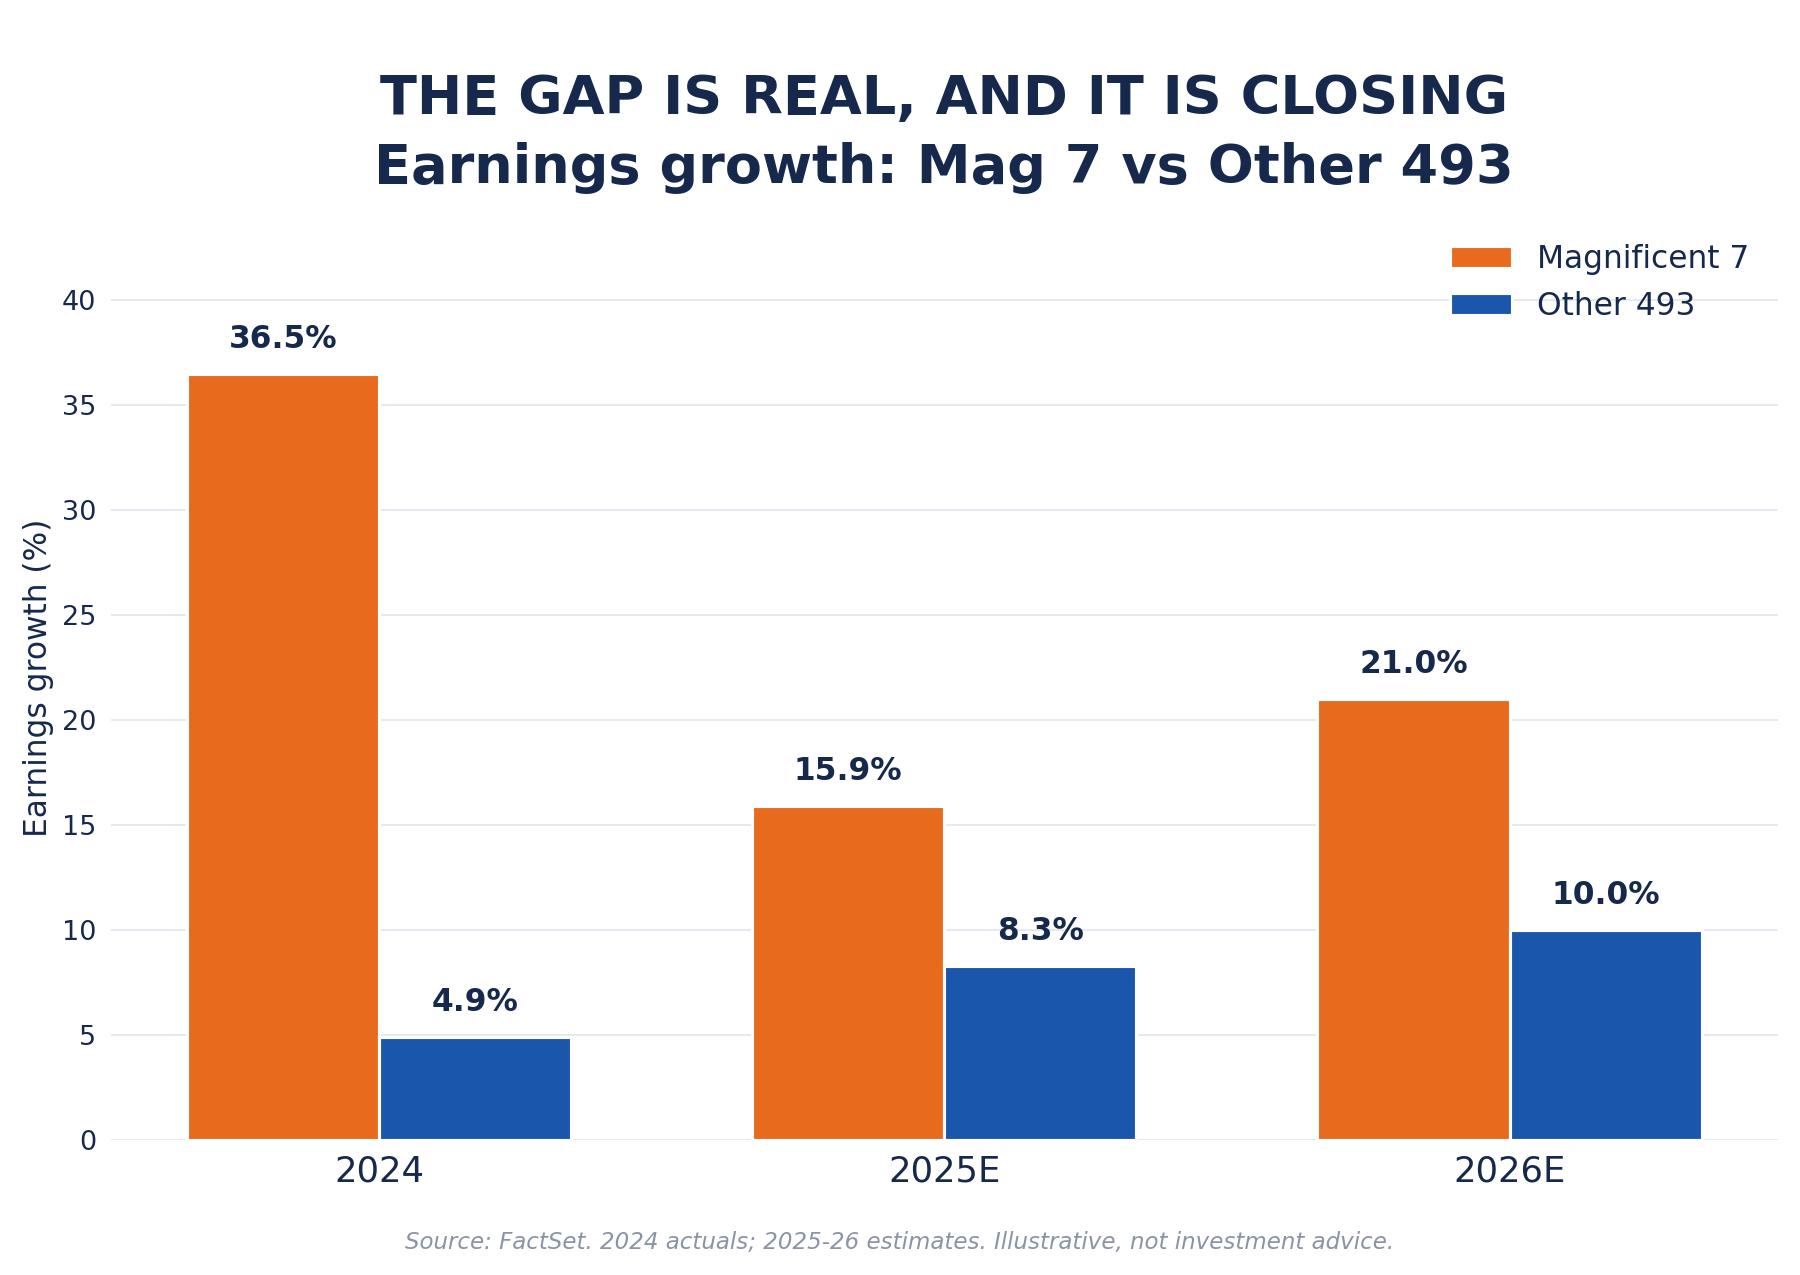
Two things are true at once: the gap was enormous, and it is closing. Both matter for what comes next.
Why isn't this 2000 again?
In 1999-2000, the market's narrow leadership traded at triple-digit earnings multiples on the hope of future profits. The prices arrived years before the earnings, and for many names the earnings never arrived at all. That is what a multiple-expansion bubble looks like: the divergence between leaders and the average stock is built on valuation, not profit.
This cycle inverted that sequence. The Mag 7's aggregate earnings grew roughly 79% in two years, from about $270B in 2022 to $483B in 2024, built on cloud, advertising, and now AI infrastructure revenues that actually exist. The equal-weight lag is not proof that prices detached from fundamentals. It is proof that fundamentals concentrated faster than prices did.
None of this means pullbacks cannot happen. They can and will; concentration means the index has more to lose if the leaders stumble. But a pullback driven by earnings multiples compressing is a normal market event. A crash driven by earnings that never existed is a different animal. Only one of those describes 2000.
Is the market broadening?
Yes, and that is the healthiest part of the story. The other 493 companies reported 11.9% earnings growth in Q3 2025, only their second double-digit quarter in three years (FactSet). Estimates put their 2026 growth near 10%, double the 2024 pace. Ten of eleven S&P sectors grew earnings in the most recent quarter.
Broadening driven by earnings is the opposite of a warning sign. It means the rally is acquiring a second engine just as the first one normalizes from extraordinary to merely strong. An investor worried about concentration should welcome this, not fear it.
What should an index investor do?
First, read the viral chart correctly: equal-weight underperformance is a symptom of where the earnings are, not a diagnosis of a bubble. Second, expect pullbacks; they are the market's normal mechanism for repricing concentration risk, and they have happened in every narrow market in history without requiring a crash.
The real risk to monitor is not concentration itself but the earnings behind it. If Mag 7 earnings growth falters while multiples stay elevated, the story changes. Until then, the calmest position for most index investors is the one they already hold: the earnings are doing the work, and the work is visible in dollars.
Research and opinion, not investment advice. Do your own due diligence before investing.