
What is the verdict?
68/100. Selective Positive. A real bank, compounding at fintech speed, priced for a credit accident that has not happened yet.
| 68/100 | DalalBytes score |
| $14.68 | Reference price, Oct 20, 2026 close |
| ~$19.3B | Market cap, 1.29B shares |
| $11 / $28 / $46 | FY2029 bear / base / bull |
SoFi has crossed the line its skeptics said it never would. It is a national bank with $45.5B of deposits growing $5.3B in a single quarter, 15.8 million members, eleven consecutive GAAP-profitable quarters, and a funding base that saves it roughly $712.6M a year against warehouse funding. Financial Services, the segment that lost money as recently as 2023, produced $792.9M of contribution profit in FY2025. Cross-buy, the metric the whole model rests on, hit 51% of new products in Q2 2026, an all-time high.
The stock has halved regardless. From the $32.73 intraday peak on November 12, 2025, SOFI fell to $14.68 by October 20, 2026, down 42.9% year to date, through a death cross in mid-October. Three things did the damage. In March 2026, Muddy Waters published a 28-page short report arguing that SoFi understates personal-loan charge-offs (claiming a true rate near 6.1% against the reported 2.89%) and overstates adjusted EBITDA; the company called the report factually inaccurate but has not published a point-by-point reconciliation. The Technology Platform lost Chime, its anchor client, and segment revenue fell 23% year over year in Q2 2026. And management funded the growth with roughly $3.3B of equity raised in 2025, including 54.5M shares at $27.50 in December, weeks after the peak.
Our read: the deposit-funded lending machine and the cross-buy engine are verified in filings, quarter after quarter. The credit dispute is an argument about presentation, not yet about losses: reported charge-offs are improving, delinquencies are stable, and the loan book is marked above par. But fair-value accounting means a rate shock or a credit turn hits earnings, marks, and capital at the same time, and KBW estimates a fair-value headwind above $1B for Q3 2026 alone. At ~24x the FY2026 adjusted EPS guide of $0.60, the price pays for delivery, not for disaster. That is a Selective Positive, not a table-pounding buy, with the October 27 print as the next proof point.
The one number that decides this stock
Reported personal-loan net charge-offs were 2.62% annualized in Q2 2026, and about 3.7% including late-stage delinquent loan sales, improving on both measures. Muddy Waters claims the true figure is about 6.1%. Everything else in this report is secondary to which side of that argument the next four quarters prove right.
What does SoFi do?
SoFi began as a student-loan refinancer and became, in February 2022, one of the very few US consumer fintechs to own a national bank charter, via the Golden Pacific Bancorp acquisition. The model has three engines. Lending originates personal, student, and home loans, funded increasingly by the bank's own deposits. Financial Services sells members money, investing, cards, and insurance-style products on top of the deposit relationship, plus the Loan Platform Business, which originates loans for third parties for fees. Technology Platform, built from the Galileo (2020, about $1.2B) and Technisys (2022, about $1.1B) acquisitions, sells processing and core-banking software to other financial companies.
| Metric | Dec 2023 | Dec 2024 | Dec 2025 | Jun 2026 |
|---|---|---|---|---|
| Members | 7.53M | 10.13M | 13.65M | 15.81M |
| Total products | 11.1M | 14.75M | 20.17M | 24.38M |
| Deposits | $18.6B | $26.0B | $37.5B | $45.5B |
| Tech Platform accounts | ~145M | 167.7M | 128.5M | 134.8M |
| Tangible book value / share | n/d | $4.47 | $7.01 | $7.34 |
Sources: company earnings releases and FY2025 10-K. Members grew 35% year over year in Q2 2026; products grew 42%. Products per member reached 1.54, an all-time high, and Q2 2026 was the first quarter in which product adds (2.2M) ran at twice member adds (1.1M). That ratio is the Financial Services Productivity Loop in one number: each new member is worth more than the last because existing members keep adding products.
How do the segments make money?
The mix shift is the story of the last three years. Lending is still the largest segment, but Financial Services went from breakeven in FY2023 to the second profit engine, and its growth rate is the fastest in the company.
| Segment ($M) | FY2023 rev | FY2023 contrib | FY2024 rev | FY2024 contrib | FY2025 rev | FY2025 contrib |
|---|---|---|---|---|---|---|
| Lending | 1,370.6 | 823.3 | 1,485.2 | 890.5 | 1,848.9 | 1,016.9 |
| Technology Platform | 352.3 | 94.8 | 395.2 | 127.0 | 450.2 | 144.4 |
| Financial Services | 436.5 | (0.3) | 821.5 | 307.0 | 1,542.0 | 792.9 |
| Corporate / other and eliminations | (36.6) | n/a | (27.0) | n/a | (227.8) | n/a |
| Consolidated net revenue | 2,122.8 | 2,674.9 | 3,613.4 |
Source: FY2025 10-K segment tables. Segment revenue includes intercompany Technology Platform fees eliminated in Corporate/Other. Lending contribution margin held near 55% in FY2025. Financial Services contribution margin reached about 51% in FY2025 ($792.9M on $1,542.0M), a remarkable swing for a segment that contributed nothing in FY2023.
Inside Financial Services sits the Loan Platform Business, which deserves its own line because the bears attack it directly. In FY2025 the LPB generated $575.9M of loan platform fees on $11.0B of third-party personal-loan originations, plus $12.3M of servicing cash flow booked in Lending, a $588.3M total adjusted revenue contribution. In March 2026, days after the Muddy Waters report, SoFi announced $3.6B of new LPB agreements across three partnerships. In Q2 2026, more than $4.1B of personal and home loans were sold or transferred through the platform, and two securitizations of LPB collateral priced at weighted-average spreads of 91bp and 86bp, tight execution that is hard to square with a claim that the collateral is misrepresented.
The weak segment is Technology Platform. Q2 2026 revenue was $84.5M with contribution profit of $11.8M, a 14% margin, down from about 30% historically, and revenue fell 23% year over year. Section 8 covers why.
How does the lending machine work?
Origination volume has nearly doubled in two years, and the mix is deliberately prime: the weighted-average origination FICO in FY2025 was 749 overall (personal 744, student 769, home 751).
| Originations ($B) | FY2023 | FY2024 | FY2025 | H1 2026 |
|---|---|---|---|---|
| Personal loans | 13.80 | 17.61 | 27.50 | 19.06 |
| Student loans | 2.63 | 3.78 | 5.54 | 5.30 |
| Home loans | 1.00 | 1.82 | 3.39 | 2.62 |
| Total | 17.43 | 23.22 | 36.42 | 26.98 |
Source: FY2025 10-K and Q2 2026 release. H1 2026 personal volume includes about $6.1B originated for third parties through the Loan Platform Business.
At June 30, 2026, the balance sheet carried $29.7B of loans held for sale and $16.9B held for investment at fair value. Total unpaid principal was $44.3B against a fair value of $46.6B: the book is marked above par, with cumulative fair-value adjustments of +$1.22B on personal loans, +$0.70B on student loans, and +$0.10B on home loans. The disclosed model inputs at June 30, 2026 were a weighted-average coupon of 12.89% and an assumed annual default rate of 4.77% on personal loans (discount rate 4.97%), and a 5.89% coupon with a 0.73% default assumption on student loans (discount rate 4.29%).
Why the marks matter
SoFi carries most of its loan book at fair value, not under CECL reserves. That makes accounting honest in one sense, marks move with the market every quarter, and violent in another: when rates rise, marks, GAAP earnings, and regulatory capital all take the hit in the same quarter. KBW's October 2026 preview estimated a Q3 2026 fair-value headwind above $1B from exactly this mechanism. This is the mechanical core of the bear case, and it does not require any credit deterioration at all.
What is the credit dispute about?
Reported credit performance is, on its face, improving. Annualized net charge-off ratios in Q2 2026 were 2.62% on personal loans (Q1 2026: 3.03%; Q2 2025: 2.83%), 0.61% on student loans, 7.65% on credit cards, and 1.81% across total loans. Management also discloses an all-in figure: excluding the effect of late-stage delinquent loan sales, the estimated all-in personal-loan charge-off rate was about 3.7% in Q2 2026, improving 70bp sequentially and 80bp year over year. On-balance-sheet 90-day delinquency rates for personal and student loans were consistent with the prior year.
Management's loss framework is vintage-based: the data continues to support a 7-8% maximum cumulative net loss assumption for personal loans. The Q4 2022 to Q3 2025 vintages show 4.68% cumulative net losses with 35% of unpaid principal remaining, against 6.43% at the same point for the 2017 vintage. If that framework holds, the prime book seasons better than the pre-charter book did.
Borrowing conviction is fine for starting a position. But to go big on a ticker, you need to spend a ton of hours on it.
Anthony Noto's operating philosophy, as quoted in DalalBytes coverage of SoFi
Against this, the March 17, 2026 Muddy Waters report made three claims. First, that personal-loan net charge-offs are really about 6.1%, not the reported 2.89%, because delinquent loan sales are excluded from the calculation. Second, that FY2025 adjusted EBITDA of $1.05B is closer to $103M once adjustments are reversed, an arithmetic claim the company disputes. Third, that a roughly $312M JPMorgan transaction was booked as a loan sale while Utah UCC filings describe SoFi as a borrower, implying disguised debt. Muddy Waters also alleged insiders monetized equity through prepaid variable forwards, which SoFi has not confirmed and no filing in the sources reviewed substantiates.
The company's same-day response called the report factually inaccurate and misleading, pointed to its ASC 860 sale-accounting analysis in the 10-K, and said it was considering legal action. Noto bought 28,900 shares that day. Mizuho's Dan Dolev argued the claims could likely be refuted from public disclosures and kept a $38 target. Seven months on, the state of play is: no SEC enforcement action, no restatement, and no point-by-point company reconciliation. The dispute sits unresolved, which is itself information. A company that could end the argument with one exhibit has chosen not to publish it, and KBW, a mainstream underwriter, has separately echoed that delinquent-loan-sale mechanics may be misunderstood by the market. We score the reported numbers as the base case, because the filings support them and the securitization market keeps validating the collateral, and we treat the dispute as an overhang that caps the multiple until time settles it.
How strong is the deposit engine?
The charter's value is measurable. In Q2 2026, average deposits were more than 90% of average liabilities, and the average rate on interest-bearing deposits was 3.07%, 156bp below warehouse facility rates, worth about $712.6M of annualized interest savings on the company's own calculation. Deposits grew from $7.3B at the end of 2022 to $45.5B at June 30, 2026. Warehouse lines, once the lifeline, were fully paid down in Q4 2025 with equity proceeds, and stood at a modest $1.48B average balance in Q2 2026.
The honest counterweight comes from FDIC call-report data. SoFi pays up for its deposits: its average savings/MMDA rate of 3.19% exceeds what 96% of banks pay, its advertised rate runs to 4.40% APY on a promo basis, and non-interest-bearing deposits, the free funding that powers incumbent bank economics, are 0.3% of its base against 28.7% at Bank of America.
| Q2 2026 | SoFi Bank | Ally | Synchrony | Bank of America |
|---|---|---|---|---|
| Avg rate on savings / MMDA | 3.19% | 3.03% | 3.35% | 0.74% |
| Avg rate on interest-bearing deposits | 2.90% | 3.09% | 3.69% | 1.92% |
| Total deposits (charter level) | $46.8B | $156.6B | $86.0B | $2.12T |
| Non-interest-bearing share | 0.3% | 0.1% | 0.5% | 28.7% |
Source: FDIC call-report data for Q2 2026 via Banksparency. The funding advantage is real against warehouse lines and wholesale money. It is not an advantage against the big banks, and it will not become one until members treat SoFi as their primary account rather than a high-yield parking spot. Net interest margin, 5.94% in H1 2026, is earned on the asset side (a 12.89% average personal-loan coupon), not on cheap liabilities.
Has management delivered on its roadmap?
Management's promise-versus-delivery record is unusually checkable, because Noto makes dated commitments. The audit below is the spine of our Leadership grade.
| Commitment | What was promised | What was delivered | Score |
|---|---|---|---|
| GAAP profitability | Quarterly GAAP net income by Q4 2023, committed January 2023 | Q4 2023 GAAP net income +$48M; eleven consecutive profitable quarters through Q2 2026 | Met |
| Financial Services profitability | Segment profitability as the loop scaled | Contribution: -$0.3M (FY2023), +$307.0M (FY2024), +$792.9M (FY2025) | Met |
| The Productivity Loop | Cross-buy rising as members deepen | Cross-buy 35% (Q2 2025) to 51% (Q2 2026); products per member at a record 1.54 | Met, accelerating |
| Technology Platform as the "AWS of fintech" | Galileo + Technisys growth platform; Technisys growth guided at 20-25% at acquisition | Segment revenue $315M to $450M over 2022-2025, then -23% YoY in Q2 2026 after Chime exited; accounts 167.7M to 134.8M | Missed |
| Crypto relaunch | In-app crypto from a national bank | Launched November 11, 2025; 388,336 crypto products by June 2026; crypto transaction revenue only $2.0M in H1 2026 | Met on launch, pending on economics |
| SoFiUSD stablecoin | Bank-issued dollar stablecoin | Launched December 2025; Mastercard settlement live September 22, 2026 across the card program, above $25B annualized volume; supply still small, roughly $0.35B on secondary sources | Met on milestones, small at scale |
| Blockchain remittance | Low-cost cross-border on Lightning/UMA | Live in 30+ countries including Mexico, India, Brazil; no volume disclosed | Met on launch, unquantified |
| SoFi Plus paid relaunch | Paid subscription tier, relaunched April 2026 | 206,000 paid subscribers at June 30, 2026; a target near 1M in a year is single-sourced from call summaries | Partial |
| FY2026 guidance | January 2026: adj. revenue about $4.655B, adj. EPS about $0.60 | Raised July 29, 2026: adj. revenue $4.75-4.85B; EPS held at $0.60 only because the assumed tax rate rose to 22% (management: $0.65 at the original rate) | On track, revenue raised |
The pattern matters more than any single line. The dated, quantified promises on profitability and the consumer loop were kept. The platform promise, made in acquisition language rather than as a dated commitment, is the one that failed. Noto's own framing, that going big on a ticker requires spending a ton of hours on it, applies to his platform bet in reverse: the hours went to the bank.
What happened to the Technology Platform?
Galileo's enabled accounts peaked at 167.7M at the end of 2024 and fell to 134.8M by June 2026, down 16% year over year. The cause is disclosed plainly in the filings: a large client, identified in secondary coverage as Chime, completed its migration to its own platform before December 31, 2025, and paid an $18M termination fee in March 2026 (the fee figure is single-sourced from the 10-Q coverage). Segment revenue fell 23% year over year in Q2 2026, with further declines guided for the second half.
The structural problem was visible at the 2020 acquisition, when Galileo's client list included Robinhood, Chime, Monzo, Revolut, Varo, and Wise: a processor owned by a competing bank will eventually lose its largest clients to their own platforms or their own charters. Chime has since agreed to buy Stride Bank for $590M, completing the logic. SoFi's response, in April 2026, was to unify Galileo, the Technisys core, and the bank charter under one brand, SoFi Tech Solutions, selling processing plus core plus charter access as a bundle no independent processor can match. Early evidence is real but small: 13 new partners signed in Q1 2026, the US Treasury's Direct Express program (3.4M federal benefit recipients) runs on Galileo, and an October 8, 2026 deal put a crypto-linked card with Orbi and Mastercard in Mexico on the platform.
Against Marqeta, the independent benchmark, the contrast is sharp: Marqeta processed $383B of volume in FY2025, up 31%, with gross profit of $437M and positive adjusted EBITDA, and its Block concentration fell from 68% of revenue in 2023 to about 44-45% in 2025. Galileo is shrinking while the independent comp grows. We value the segment as a declining annuity with option value in the bundle, not as the AWS of fintech. Management's guidance behavior has quietly conceded the point: the segment no longer carries the growth narrative; the bank does.
How does SoFi compare with Nubank and Robinhood?
SoFi's problem is visible in one comparison. Nubank serves 139M customers and earned a 33% ROE in Q2 2026 with a 19.5% efficiency ratio. SoFi serves 15.8M members and earned a 6.2% ROE. The bull case is that the gap is runway. The bear case is that Nubank proves what this model should already earn.
| Company | Customers | Latest quarter revenue | Latest quarter net income |
|---|---|---|---|
| SoFi | 15.8M members | $1.205B adj. net revenue (Q2 2026) | $156.6M GAAP |
| Nubank | 139M customers | $4.1B net revenues (Q2 2026) | about $1.1B |
| Robinhood | 28.4M funded customers | $1.31B (Q2 2026) | $561M |
| Chime | 10.4M active members | $669.8M (Q2 2026) | GAAP profitable in H1 2026 |
| LendingClub | n/a | $262.9M (Q2 2026) | EPS $0.50 in Q2 2026 |
Sources: company releases for Q2 2026; Chime via investor reporting, October 2026. Member and customer definitions differ across companies and are not directly comparable.
Monetization per customer is converging from different directions. Nubank's monthly revenue per active customer reached $17.00 in Q2 2026, about $204 a year, up 31% year over year. Chime reports about $260 of annual revenue per active member. SoFi does not disclose the metric; dividing Q2 adjusted revenue by members gives about $305 annualized, but that includes B2B platform revenue and overstates consumer monetization. Robinhood computes to about $185 on the same crude math. The honest statement is that SoFi monetizes a US member at roughly Nubank-plus levels already, but at far lower returns on equity, because its funding is expensive, its credit book is young, and its cost base carries a full bank plus a software segment.
The charter moat is also narrowing. Upstart received conditional approval for a national bank charter in July 2026, with final approval expected in early 2027. Affirm applied for an industrial loan charter in January 2026. Chime is buying its charter bank outright. SoFi's 2022 head start was worth years; it is now worth quarters. What does not converge is the deposit base itself: $45.5B gathered in four years is the asset competitors must now replicate under supervision, at promo rates, in a falling-rate environment that compresses the very NIM they are chasing.
Who leads SoFi, and what is the governance record?
Anthony Noto (CEO since March 1, 2018) came through Goldman Sachs TMT banking, the NFL CFO seat, and the Twitter CFO/COO roles. The delivery record in Section 7 is his: the profitability promise made and kept on the date promised, the student-loan restart called correctly through the moratorium, and the consumer loop built to 51% cross-buy. The debits are also his: the platform overpromise, and a funding model that reached for equity at $20.85 in July 2025 and again at $27.50 in December 2025, near the top, diluting the holders who believed the story most.
The insider tape is the strongest governance signal in the report. Noto is the largest individual shareholder with about 11.96M shares, and he bought on every leg of the 2026 decline:
| Date | Shares bought | Price (weighted avg) | Value |
|---|---|---|---|
| Mar 2, 2026 | 56,000 | $17.88 | about $1.0M |
| Mar 17, 2026 (Muddy Waters day) | 28,900 | $17.32 | about $0.5M |
| May 8, 2026 | 15,878 | $15.73 | about $250K |
| May 11, 2026 | 15,545 | $16.00 | about $249K |
| Jun 16, 2026 | 13,888 | about $18.00 | about $251K |
Source: Form 4 filings as reported by financial press. Five purchases totaling about 130,000 shares and $2.25M at a blended $17.29, every one of them above the October 20 close of $14.68. Other executives sold modestly through the year (about $11.5M across 18 sales in the trailing twelve months, per InsiderTrades). Noto's 2024 total compensation was about $28.1M, mostly equity (single-sourced from proxy compilations; the 2026 proxy table was not re-verified for this report).
Governance structure is clean by fintech standards: a single class of common stock with no supervoting founder shares (unlike Nubank), split chair and CEO roles (Tom Hutton chairs), an 11-member board with an average tenure near 5.3 years, and Deloitte as auditor. CFO Chris Lapointe has held the seat since April 2020, a stability the platform segment's churn makes more valuable. The company went public through the Social Capital Hedosophia SPAC in May 2021; the sponsor-era governance is long gone.
What do the financials and the dilution ledger show?
| $M except EPS | FY2022 | FY2023 | FY2024 | FY2025 | H1 2026 |
|---|---|---|---|---|---|
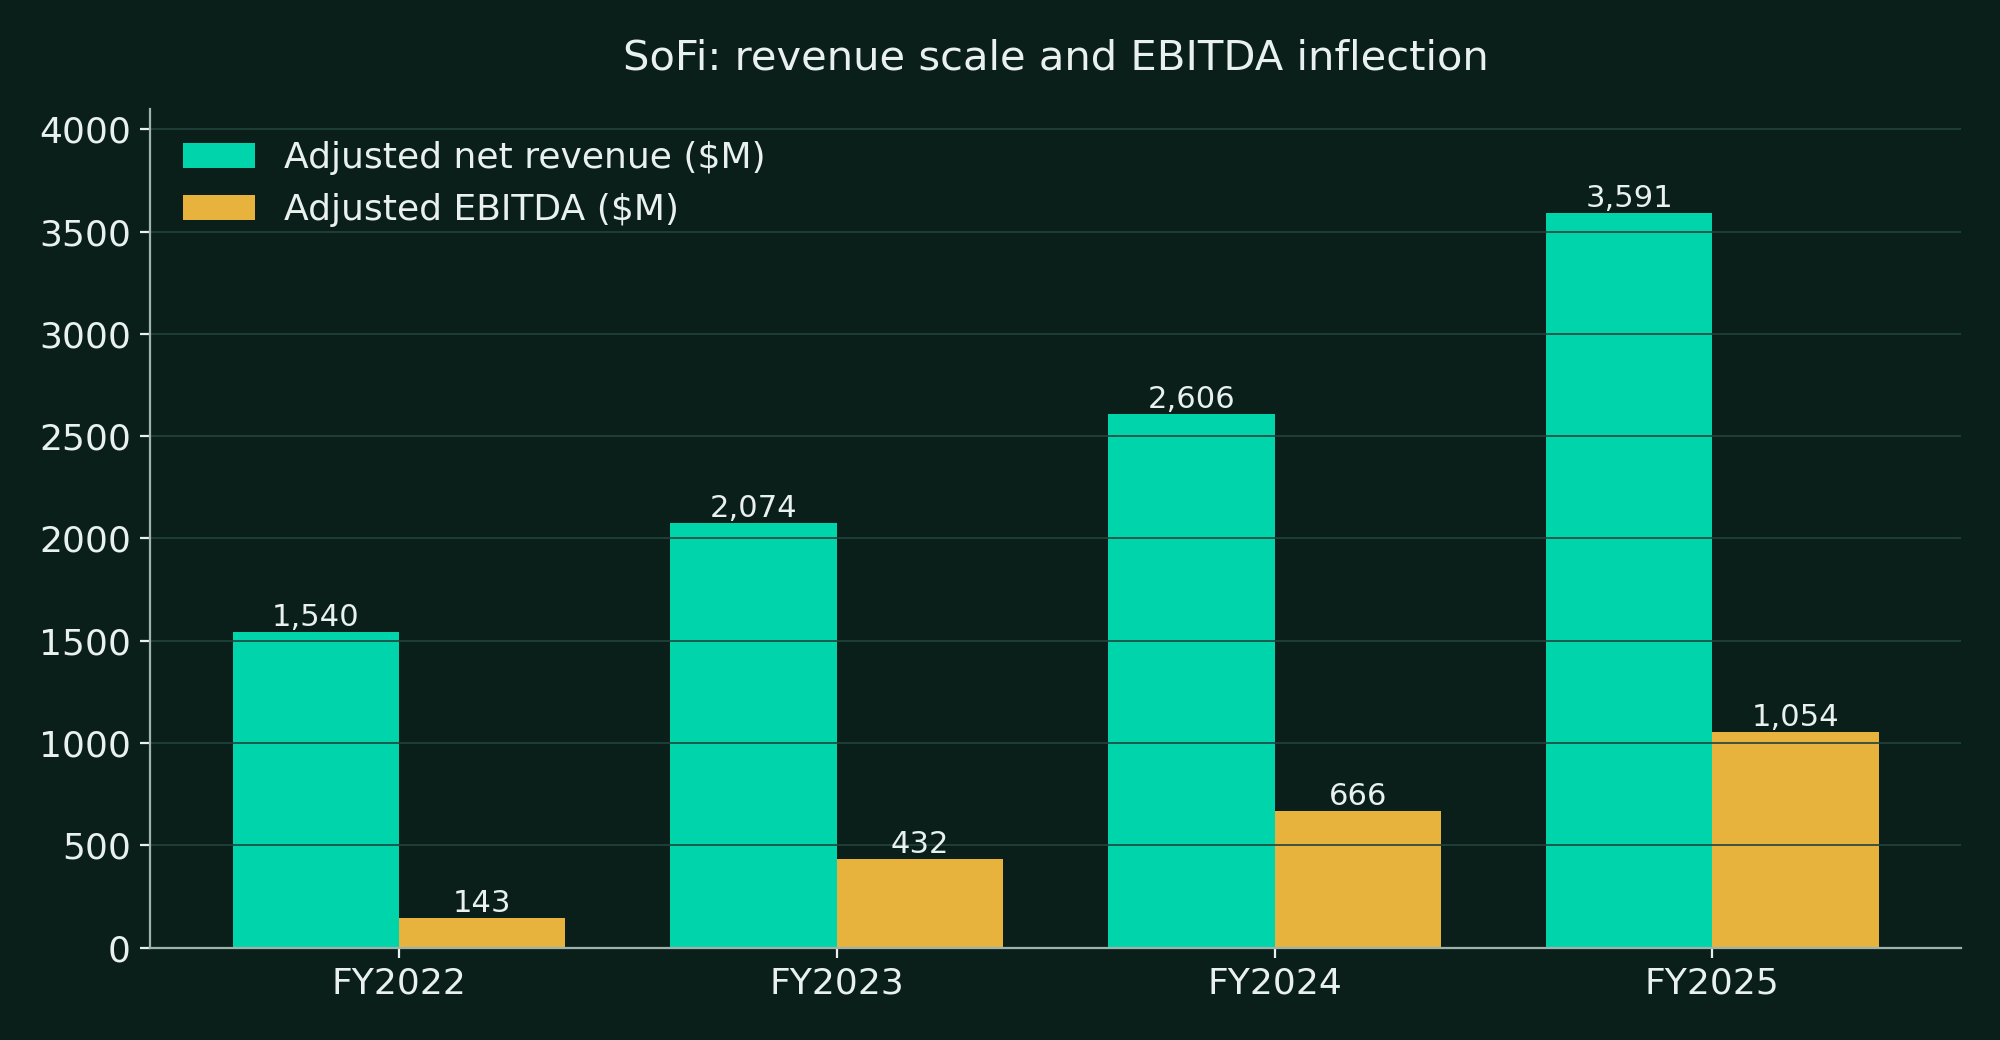
| Total net revenue (GAAP) | 1,573.5 | 2,122.8 | 2,674.9 | 3,613.4 | 2,319.0 |
| Adjusted net revenue | 1,540.5 | 2,073.9 | 2,606.2 | 3,591.4 | 2,292.8 |
| Net income (loss), GAAP | (320.4) | (300.7) | 498.7 | 481.3 | 323.3 |
| Adjusted net income | n/a | n/d | 227.2 | 481.3 | 327.1 |
| Adjusted EBITDA | 143.3 | 431.7 | 666.5 | 1,053.9 | 697.7 |
| Diluted EPS (GAAP) | (0.40) | (0.36) | 0.39 | 0.39 | 0.24 |
| Adjusted diluted EPS | n/a | n/d | 0.15 | 0.39 | 0.24 |
Sources: FY2025 10-K, Q4 releases, Q1 and Q2 2026 releases. FY2024 GAAP net income is flattered by a convertible extinguishment gain and a deferred-tax valuation allowance release; adjusted net income of $227.2M is the cleaner figure. Adjusted revenue growth in Q2 2026 was 40% year over year.
Tangible book value per share compounded from $4.47 (December 2024) to $7.01 (December 2025) to $7.34 (June 2026), up 56% year over year, with total equity of $11.08B and holdco capital ratios estimated at CET1 18.7% and total risk-based 18.8% at June 30, 2026, far above the 10.5% requirement including buffers. The capital position is not the problem. The cadence of raising it is:
| Date | Raise | Terms |
|---|---|---|
| Jul 31, 2025 | Public offering | 82.7M shares at $20.85; net proceeds about $1.7B; part used to retire higher-cost debt |
| Dec 4-8, 2025 | Public offering | 54.5M shares at $27.50 (about a 7% discount); $1.5B gross; proceeds repaid warehouse lines in full |
| FY2025 total | about $3.3B of equity raised |
Stock-based compensation adds a quieter layer: $306.0M (FY2022), $271.2M (FY2023), $246.2M (FY2024), $262.1M (FY2025). SBC has fallen from 19.4% of revenue to 7.3%, but the share count tells the full story: 1.20B shares at September 30, 2025, to 1.29B at June 30, 2026. Growth funded this way is real growth, but per-share compounding is the metric that pays holders, and per-share compounding is what the 2025 raises taxed.
What is SoFi worth?
At $14.68, SoFi trades at about 29-31x trailing GAAP earnings, about 24x the FY2026 adjusted EPS guide of $0.60, roughly 2.0x tangible book value of $7.34, and a MarketBeat PEG below 1. The comparisons frame the argument:
| Ticker | Price | Market cap | P/E (trailing) | P/S | P/TBV or P/B |
|---|---|---|---|---|---|
| SOFI | $14.68 (Oct 20, 2026) | about $19.3B | 29-31x | about 3.4-5.4x (definitions differ) | about 2.0x TBV |
| HOOD | $102.37 (Oct 21, 2026) | about $87-92B | 42-45x | 18.3x trailing | 10.3x TBV |
| UPST | about $23.8 (Oct 20, 2026) | about $2.3B | 38-48x | about 4.5x | n/a |
| CHYM | $30.45 (Oct 20, 2026) | about $11.5B | n/m | about 4.6x TTM | n/a |
| LC | $19.21 (Oct 20, 2026) | about $2.2B | about 9-10x FY2026 guide | n/a | n/a |
Sources: Finnhub, MarketBeat, StockAnalysis, October 2026 snapshots. Multiples move daily; treat as a snapshot, not a quote. Nubank's October 2026 multiples were not verified to the same standard in this pass and are not shown.
The Street is split cleanly in two. Consensus sits at Hold with an average target of $21-22 (MarketBeat $22.20; FMP $21.08, range $15-29). The October actions show the poles: Benchmark upgraded to Strong Buy on October 14; StoneX initiated at Buy with a $25 target; Scotiabank initiated Sector Outperform at $25 in September; earlier, JPMorgan upgraded to Overweight calling SoFi a potential "American Express of fintech" at $31, and Mizuho defended the name at $38 after the short report. On the other side, KBW cut to $15 and reiterated Underperform on October 11-12, citing fair-value marks, rates, and capital consumption, and Goldman Sachs sits at $15, with TD Cowen at $17.50 Hold. Short interest is 17.0% of float (214.9M shares, FINRA September 30, 2026 settlement), up 13.7% period over period, at 4.15 days to cover. This is a battleground stock with a crowded short base and a CEO buying the other side.
What are the FY2029 scenarios?
Our targets are built on adjusted EPS, the metric management guides to, with the FY2026 guide of $0.60 as the base year. Management's own framing is 20-25% EPS growth beyond 2026 on the path to a 20-30% return on tangible common equity.
| Scenario | FY2029 adj. EPS | Basis | Exit P/E | Target |
|---|---|---|---|---|
| Bear | $0.78 | Credit turns, charge-offs migrate toward the Muddy Waters framing, Technology Platform keeps shrinking, EPS CAGR about 9% | 14x | $11 |
| Base | $1.17 | EPS compounds at 25%, the top of management's guided range; deposits pass $70B; cross-buy holds above 50% | 24x | $28 |
| Bull | $1.40 | The loop plus LPB scale plus SoFiUSD settlement economics deliver ROTCE in the low 20s early; EPS CAGR about 33% | 33x | $46 |
The base case asks for nothing heroic beyond management's own guided growth range, held for three years, at a multiple the stock already carried before the 2026 de-rating. The bear case is not a fraud case: it only requires the credit cycle to do what credit cycles do, with fair-value accounting amplifying the print. The bull case requires the stablecoin and platform-fee mix to change the earnings quality enough to re-rate the multiple toward Robinhood's, which is a claim about 2028 evidence, not 2026 hope. From $14.68, the base case implies roughly 24% annualized appreciation to FY2029, the bull about 46%, the bear about -9% a year. The asymmetry is acceptable; the path will not be smooth, and the position sizing question belongs to the holder, not to this report.
What do the technicals say?
The trend is against the stock and honest reporting requires saying so. SOFI closed at $14.68 on October 20, 2026, about 55% below the November 2025 peak, down 42.9% year to date and about 45% over one year, with a beta near 2.3. The price sits below both the 50-day average ($17.09) and the 200-day average ($18.37), and the 50-day crossed below the 200-day in the week of October 12-14, a death cross. RSI (14) was 34.7 on October 19, approaching oversold without reaching it. Support sits at the 52-week low of $13.86 and the $14.22 area; resistance begins at $17.85 (the 61.8% retracement) and the $19 area. Average daily volume runs near 50M shares, about $1.3B of daily traded value, so liquidity is not a constraint in either direction. The anatomy of the decline: peak in November 2025, mid-$20s after the January 30, 2026 print, about $20 by mid-February, the $15 area after the March short report, a $15-19 range through summer, -9% on the July 29 print, and a slide through October. Every rally in 2026 has been sold. A fundamental buyer is early by definition until the tape confirms, which is one reason the rating is Selective.
What are the risks?
- The unresolved dispute. Muddy Waters' charge-off and EBITDA claims have been neither proven nor point-by-point refuted in public. A restatement or an SEC inquiry would re-rate the stock violently; continued clean quarters erode the claim slowly. There is no middle-speed outcome.
- Fair-value procyclicality. The book is marked above par ($46.6B fair value on $44.3B of principal). A 2022-style rate shock reverses marks, earnings, and capital ratios simultaneously, as KBW's Q3 headwind estimate illustrates.
- Credit has not met a recession. The prime book (FICO 749 at origination) has seasoned only through a strong labor market. The 7-8% cumulative loss framework is a model, not an experience. Credit card charge-offs at 7.65% show what the younger products do under mild stress.
- Dilution cadence. Two $1.5B-class raises in five months of 2025, at descending prices, plus $262M a year of SBC. If 2027 brings another raise, per-share targets compress mechanically.
- Charter convergence. Upstart's conditional charter (July 2026), Affirm's application (January 2026), and Chime's Stride acquisition each shrink the charter premium the valuation quietly assumes.
- Platform decline compounding. Technology Platform revenue fell 23% in Q2 2026 with more declines guided. If the bundle strategy fails, a segment once valued as a growth platform becomes a runoff.
- Crypto and stablecoin cyclicality. SoFiUSD settlement is live and strategically interesting; crypto revenue is $2.0M in H1 2026 against a $4.8B revenue guide. The option is free at this price, but it is an option, not earnings.
What should investors watch next?
Q3 2026 earnings arrive Tuesday, October 27, 2026, at about 7:00 AM ET (company-confirmed), against consensus of about $1.26B of revenue. The checklist that matters: the size of the fair-value mark move (KBW's above-$1B headwind estimate is the bear bogey), the personal-loan charge-off print and any all-in disclosure, Technology Platform revenue against the guided decline, deposit growth and cost, and whether the FY2026 EPS guide of $0.60 survives its third print of the year.
The conclusion folds the year together. In the past twelve months SoFi raised its FY2026 revenue guide, crossed 15M members, pushed deposits past $45B, launched a bank-issued stablecoin into live Mastercard settlement, and lost its largest platform client and half its market value. Both halves of that sentence are true, and the second half is why the first half is available at 24x guided earnings with a 17% short float. Our verdict: 68/100, Selective Positive, with FY2029 targets of $11 / $28 / $46. The engine is verified. The accounting dispute is the price of admission, and it will be settled by charge-off prints, not by arguments.
The proof points that would raise the score
Four clean quarters of all-in charge-offs at or below about 3.7%, a Technology Platform return to growth under the SoFi Tech Solutions bundle, and a full year with no equity raise. Any two of the three, and this becomes a high-conviction compounder file. Any restatement, or a charge-off break above 5% on the company's own all-in measure, and the thesis is wrong regardless of the member count.
Frequently asked questions
Is SoFi profitable?
Yes. SoFi has reported eleven consecutive GAAP-profitable quarters through Q2 2026, with FY2025 GAAP net income of $481.3M and adjusted EBITDA of $1,053.9M. Q2 2026 GAAP net income was $156.6M on adjusted net revenue of $1,205.6M.
What did Muddy Waters allege about SoFi, and has it been resolved?
In March 2026, Muddy Waters alleged personal-loan charge-offs are really about 6.1% rather than the reported 2.89%, that adjusted EBITDA is materially overstated, and that a JPMorgan transaction was disguised borrowing. SoFi denied the claims; no restatement or enforcement action has followed, and the company has not published a point-by-point reconciliation.
What are the DalalBytes FY2029 targets for SOFI?
Bear $11, Base $28, Bull $46, built on adjusted EPS of $0.78, $1.17, and $1.40 respectively, from the FY2026 guided base of $0.60, against a reference price of $14.68 on October 20, 2026.