
What is the verdict?
72/100. Positive. The best cash machine in media, a balance sheet the failed Warner deal never touched, and a stock that has halved because growth slowed from the teens to about 12%.
| 72/100 | DalalBytes score |
| $62.05 | Reference price, Oct 29, 2026 close |
| $254.8B | Market cap, 4,106.3M shares outstanding |
| $46 / $85 / $118 | FY2029 bear / base / bull |
What would change the score. The score rises if the 2027 guide puts advertising back on the original doubling path with revenue growth at or above 12%, and it falls if revenue growth slips under 10% or the advertising guide is cut a second time.
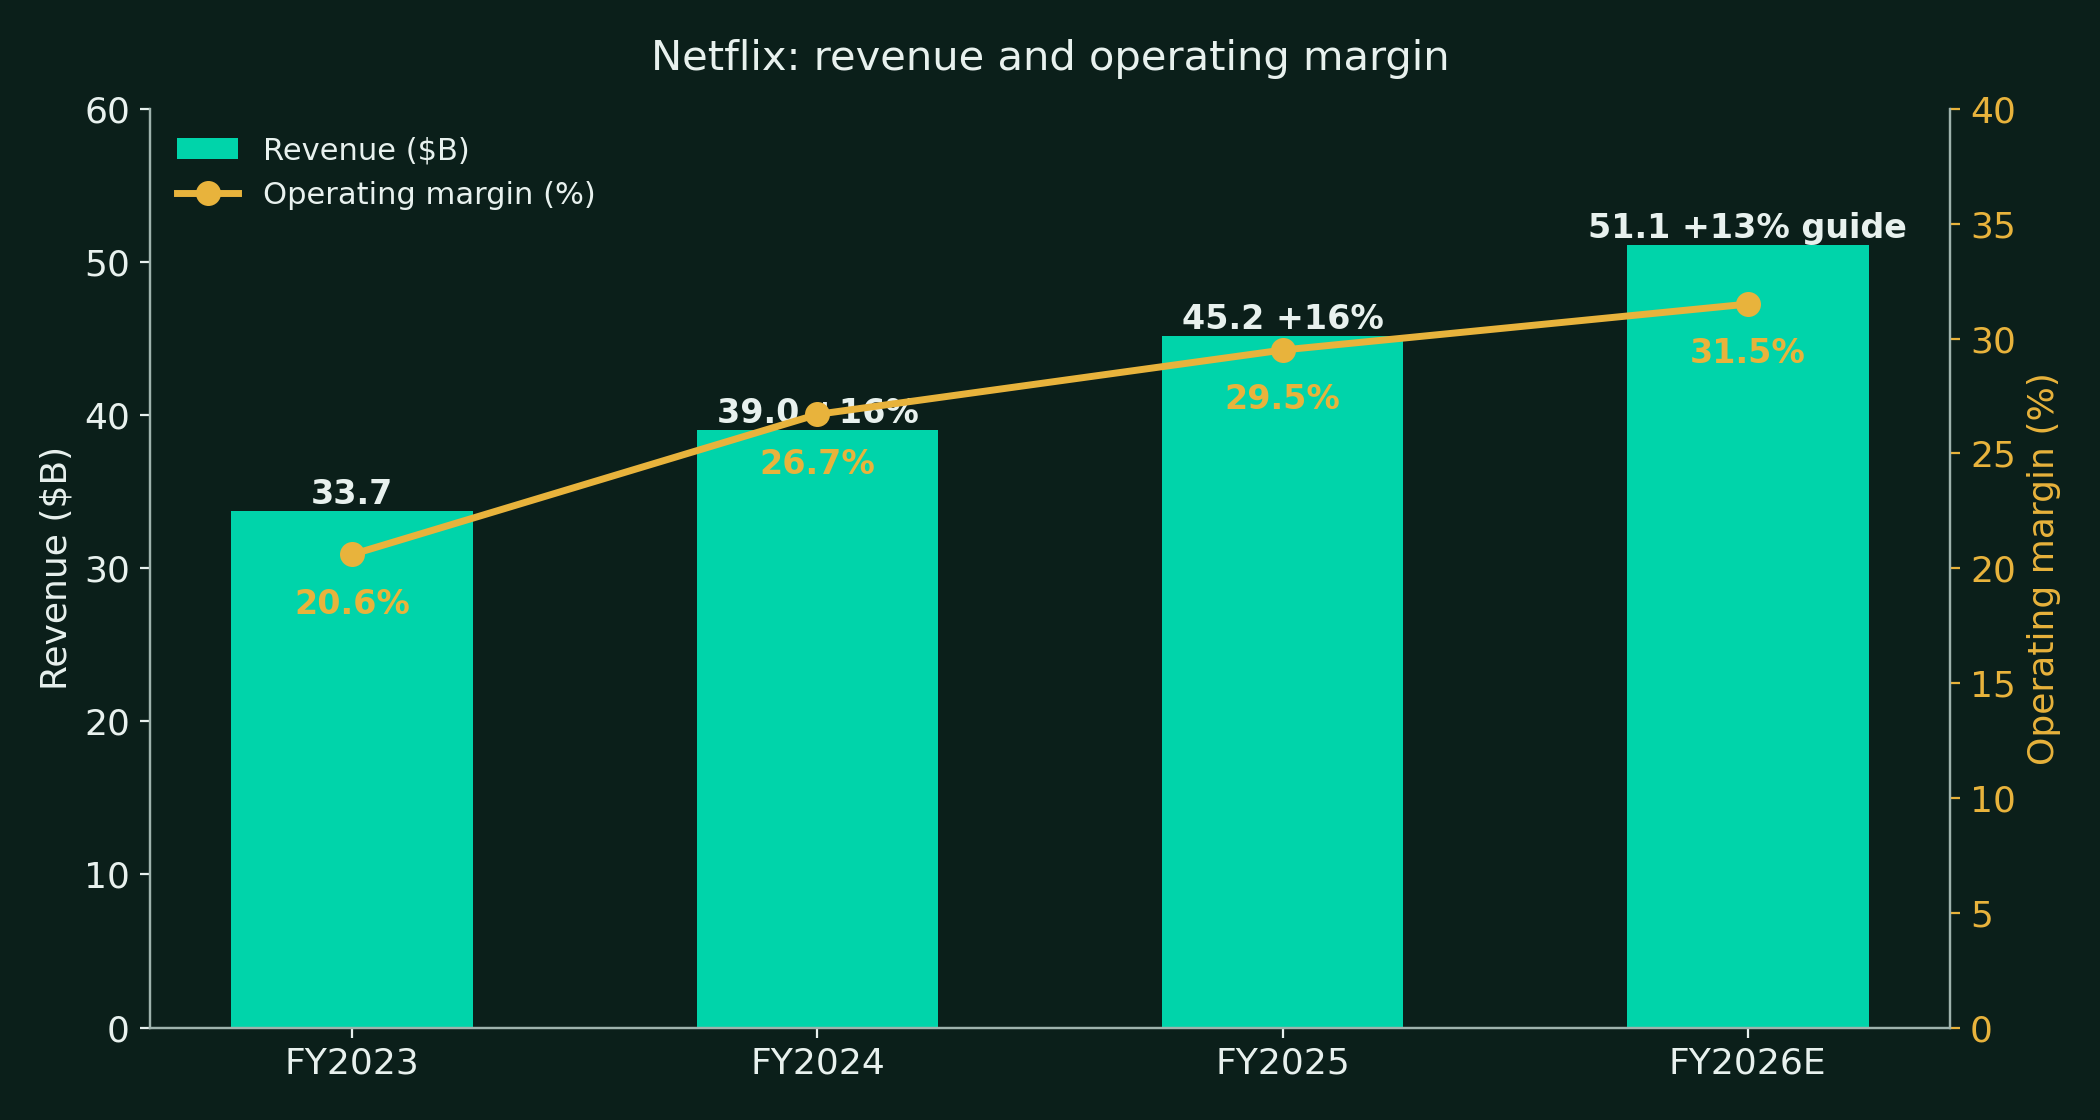
Netflix did the two things this report grades hardest, and it did both in one year. It kept expanding the margin while growth decelerated, taking operating margin from 29.5% in 2025 to a guided 31.5% in 2026 and a 34.6% print in the third quarter. And when a bidding war pushed the Warner Bros. price past its walk-away line, it walked away, collected a $2.8B termination fee, and left the leverage to the winner.
The weak spots are real but narrower than the stock move suggests. Revenue growth has slowed for three straight quarters, from 16.2% to 13.4% to 11.8%, and the fourth quarter guide of 11.5% extends the line. The advertising business, the main new growth leg, just took its first guide cut, from about $3B to about $2.7B for 2026. Engagement hours grew 2% in the first half, which means growth now comes mostly from price, mix, and ads rather than from more viewing.
At $62.05 the market prices the bear path and charges nothing for the base path. The stock trades at about 21 times trailing earnings with the one-time fee stripped out, for a business converting about 70% of operating income into free cash flow. Our read: the franchise is intact, the price is not.
The price basis of this report
Netflix completed a 10-for-1 stock split in November 2025 (record date November 10, distribution November 14, split-adjusted trading from November 17). Every price and per-share figure in this report is on the post-split basis, including all history. The reference close is Thursday, October 29, 2026.
What is Netflix today?
Netflix was founded in 1997 in Scotts Valley, California, as a DVD-by-mail service, launched streaming in 2007, and now sells one product: a subscription to the largest premium streaming service in the world, in more than 190 countries. Ted Sarandos and Greg Peters run it as co-CEOs. Reed Hastings, the co-founder, left the board in June 2026 after 29 years, and the company he built no longer needs him in the room for the model to work.
The model's second act is the story of this report. The first act sold memberships. Netflix stopped reporting membership counts after Q4 2024, when paid memberships stood at 301.6M, and now runs the company on revenue, margin, and engagement. A later letter disclosed that the paid base crossed 325M in Q4 2025, the last membership figure the company has given. The second act sells the same hours three ways: higher prices, an advertising tier that reached more than 250M monthly active viewers, and live events that make the service harder to cancel. The Warner Bros. bid was an attempt to buy a third act outright. It failed on price discipline, and the failure paid $2.8B.
| Metric ($M) | FY2024 | FY2025 | Q3 2026 |
|---|---|---|---|
| Revenue | 39,000.5 | 45,179.4 | 12,874.2 |
| Operating income | 10,417.8 | 13,326.1 | 4,459.0 |
| Operating margin | 26.7% | 29.5% | 34.6% |
| Net income | 8,711.5 | 10,939.1 | 3,663.9 |
| Diluted EPS | $1.98 | $2.53 | $0.87 |
| Free cash flow | 6,922.0 | 9,461.0 | 2,884.0 |
Sources: Netflix 10-K filings and shareholder letters. The story of the table is the margin. Revenue growth is slowing toward 12%. Operating income grew 37% in the latest quarter anyway, because the cost base grows slower than the price and mix line.
How does Netflix make money?
Netflix reports one segment and four geographic revenue lines. Subscriptions are almost all of it. Advertising is inside the same lines and is not broken out as a segment.
Q3 2026 revenue by region:
| Region | Q3 2026 ($M) | Growth | Share |
|---|---|---|---|
| United States and Canada | 5,360.8 | +13.7% | 41.6% |
| Europe, Middle East and Africa | 4,401.8 | +8.4% | 34.2% |
| Latin America | 1,510.0 | +15.7% | 11.7% |
| Asia-Pacific | 1,601.6 | +14.5% | 12.4% |
| Total | 12,874.2 | +11.8% | 100% |
Source: Netflix Q3 2026 shareholder letter, October 20, 2026. Growth rates are computed from the letter's regional revenue table. The letter's narrative separately cites UCAN up 11%, Latin America up 17% on a reported basis, and Asia-Pacific up 12%, with India revenue up about 18% on an FX-neutral basis and India view hours up 24%.
How the money is made:
- Membership growth. Netflix last reported paid memberships at 301.63M at December 31, 2024, up 41.0M in a year, the largest annual gain in its history. The Q4 2025 letter later disclosed that paid memberships crossed 325M in Q4 2025. The quarterly count series still ends at 301.63M.
- The disclosure changed. Since Q1 2025 Netflix stopped reporting memberships and ARM. Revenue is now the top line it guides and grades.
- Pricing. The January 2025 US increase set the ad plan at $7.99, Standard at $17.99, and Premium at $24.99. A second US increase landed on March 26, 2026: the ad plan rose to $8.99, Standard to $19.99, and Premium to $26.99. The UK followed on September 3 to 4, 2026.
- Smaller 2026 moves. Price increases landed in Portugal, the Netherlands, and Switzerland in January 2026, and a $2.99 Mobile Basic tier launched in India and Indonesia, both as reported.
- Paid sharing. The 2023 crackdown converted borrowers into payers and still feeds the paid base, per the shareholder letters.
- Advertising. Ad revenue was just above $1.5B in 2025 and is guided to about $2.7B in 2026. That is about 5% of revenue today and the fastest growing line.
- Foreign exchange. About 58% of Q3 revenue came from outside UCAN. Reported growth of 11.8% was 11% on an FX-neutral basis in Q3.
What did Netflix report in Q3 2026?
Netflix reported Q3 2026 on October 20, 2026. The print beat the company's own guide on profit and matched it on revenue. The stock fell anyway, because the guide that came with it trimmed the advertising year.
Against the company's own Q3 guide, set in the Q2 2026 letter:
| Metric | Q3 guide | Q3 actual | Read |
|---|---|---|---|
| Revenue | $12.86B | $12,874M | In line |
| Operating margin | 33.2% | 34.6% | Beat on expense timing |
| Diluted EPS | $0.82 | $0.87 | Beat |
Source: Netflix Q2 2026 and Q3 2026 shareholder letters.
The quarter itself:
- Revenue grew 11.8% to $12,874.2M. FX-neutral growth was 11%.
- Operating income rose 37.2% to $4,459.0M. The margin beat came from expense timing and a slight revenue upside, per the letter.
- The year-ago margin comparison flatters the print. Q3 2025's 28.2% operating margin was depressed by an about $619M Brazilian non-income tax expense, worth over 5 points of that quarter's margin.
- Net income was $3,663.9M and diluted EPS was $0.87, up 49% on unrounded figures.
- Free cash flow was $2,884M, from $3,162M of operating cash flow less $278M of capex.
- Churn improved year over year and against the company's forecast, per the letter.
- Buybacks set a company record at $4,796.7M, retiring 63.9M shares, the largest repurchase quarter in the company's history.
The guidance that came with the print:
| Item | Guide |
|---|---|
| Q4 2026 revenue | $13,442M, up 11.5% |
| Q4 2026 operating margin | 26.0%, including about 120 basis points of severance cost |
| FY2026 revenue | $51.1B, up 13.0% |
| FY2026 operating margin | 31.5%, held |
| FY2026 advertising revenue | About $2.7B, cut from about $3B |
| FY2026 free cash flow | About $12B, cut from about $12.5B on a real estate closing |
Source: Netflix Q3 2026 shareholder letter. The margin guide for Q4 is seasonal and now also carries the cost of the October headcount reductions.
What drives growth now that member counts are gone?
Three engines replaced raw subscriber counts.
- Price and plan mix. The 2025 US price steps are still annualizing through the base, and the ad plan pulls members up the ladder over time.
- Retention. Churn improved year over year in Q3 2026, per the letter. A service people do not cancel can raise price.
- Engagement depth. Members watched more than 97B hours in H1 2026, up 2% year over year, per the Q2 2026 shareholder letter. H2 2025 was 96B hours, also up 2%.
- What they watch. About 25% of TV viewing hours in the engagement report were non-English. Local content is a growth engine and a cost moat at once.
- The hits still land. Wednesday Season 3 drew 114M views in its first 91 days. KPop Demon Hunters is the most watched film in Netflix history at 432M views.
- The honest limit. Total hours are roughly flat. Growth from here is monetization per hour: price, ads, and live events that spike attention.
- Per-member drift. Jefferies estimates average monthly viewing per member fell from about 66 hours in H1 2023 to about 49 hours in H1 2026. Bloomberg reports the internal qualified-play-days metric has declined since the password crackdown. Antenna puts US churn near 2%. Netflix is also cutting its What We Watched engagement report to annual from 2027.
How big is the advertising business, really?
The ad business is four years old and is the leg the valuation now leans on. It is also the leg that just stumbled.
The reach ladder, as Netflix has disclosed it:
| Date | Disclosure | Metric |
|---|---|---|
| Nov 2024 | 70M | Monthly active users on the ad plan |
| May 2025 | 94M | Monthly active users on the ad plan |
| Nov 2025 | More than 190M | Monthly active viewers, a people metric |
| May 2026 | More than 250M | Monthly active viewers, at the May 13 upfront |
Sources: Netflix company posts and upfront presentations. The metric changed from accounts to viewers in late 2025. The two series are not directly comparable, and this report does not splice them.
- 2025 revenue. Advertising revenue more than doubled in 2025 to just above $1.5B, per the Q4 2025 letter.
- 2026 guide, original. The Q4 2025 letter guided to another rough doubling, implying about $3B.
- 2026 guide, current. The Q3 2026 letter cut the year to about $2.7B, citing a slower rollout of ad capabilities and partner integrations.
- The stack. The in-house Netflix Ads Suite is now live in all ad markets, per the Q3 letter. Programmatic buying runs through Google DV360, The Trade Desk, and Yahoo DSP.
- The contested partner. The Amazon DSP relationship is unsettled in the sources. One account reports buying availability across 11 markets from Q4 2025, while other reporting describes a deeper integration pushed to 2027. This report prints the timing as contested. Partner plumbing, not demand, is the stated bottleneck on the guide cut.
- Live reach. Netflix told advertisers in May 2026 that live events reach 150M monthly TV viewers. Live is the premium ad inventory.
- The 2026 upfront. The upfront closed on August 10, 2026 with commitments nearly doubled, per ads chief Amy Reinhard.
- Sign-up mix. Ads plans took over 60% of Q1 2026 sign-ups in ads countries.
- The 2027 map. The ad tier expands to 15 new countries in 2027, with the first tranche in March 2027.
- The ARM gap. Co-CEO Peters acknowledged on the January, July, and October 2026 calls that revenue per ad-tier member still trails Standard ARM, as reported in call coverage.
- Grade on the leg. Reach is delivered. Revenue is one guide cut behind plan. Section 10 scores it.
How does the content machine account for itself?
Content is the factory floor. The accounting is the machine's gearbox, and it is widely misunderstood.
- Cash spend. Content additions were $17,097M in FY2025. The shareholder letters give no dollar guide for 2026 cash content spend. The stated guide is a cash-spend-to-amortization ratio of roughly 1.1x, with amortization growing roughly 10%. CFO Spence Neumann put 2026 cash content spend at roughly $20B at a March 4, 2026 Morgan Stanley conference, as reported.
- Amortization. Amortized content expense was $16,422M in FY2025 and $11,551.5M in the first nine months of 2026. Expense trails cash spend, which is why margins rise while the library grows.
- The library on the books. Net content assets stood at $34,605.5M at September 30, 2026, carried as a single non-current line under ASU 2019-2.
- How amortization works. Most content amortizes on an accelerated curve tied to viewing. Hits expense fast. Library titles expense slowly.
- The slate proof. The H1 2026 engagement report counts 13 of the 20 most watched seasons of TV on any service as Netflix originals, per the company's reading of its own report.
- Licensing still matters. In August 2026 Netflix partnered with Take-Two to unveil a sneak peek of Grand Theft Auto VI, per the Q3 letter. Licensed events and third-party premieres sit on top of the originals machine.
- A small tuck-in. Netflix acquired InterPositive, a post-production and localization company, in 2026, as discussed in its Q1 earnings interview coverage. Terms were not disclosed in the sources checked.
What do live events and sports add?
Live is the newest pillar of the model. It buys simultaneity, which is what advertisers pay premiums for and what makes a subscription feel weekly rather than optional.
- WWE Raw. Weekly since January 6, 2025. WWE's own 10-K attributes about $1.24B of US rights value to Netflix over the deal's first five years, and the full deal was reported at about $5B over ten years.
- NFL. A four-year extension through the 2029-30 season was announced on May 13, 2026, on top of an original deal reported at about $150M a year. The 2026 slate runs five games: a Week 1 game in Melbourne (49ers vs Rams, September 10), a Thanksgiving Eve game (Packers vs Rams, November 25), a Christmas Day doubleheader, and a Week 18 game on January 9, 2027, plus NFL Honors. The 2025 Lions-Vikings Christmas game averaged 27.5M US viewers on Nielsen's updated methodology.
- Baseball. A 2026 to 2028 MLB package covers an exclusive Opening Night game, the Home Run Derby, and the Field of Dreams game played August 13, 2026, per the November 2025 announcements.
- Women's football. Netflix holds US rights, English and Spanish, to the 2027 and 2031 FIFA Women's World Cups, announced in December 2024.
- What it skipped. Management signaled it would not chase a full UFC package in 2025. The pattern is tentpoles, not seasons.
- Games retrenched. Night School Studio and Moonloot closed in August 2026, Boss Fight closed in October 2025, and Spry Fox was sold back in December 2025, leaving Next Games as the only owned studio. The pivot is the Netflix Playground kids app, launched in April 2026 with daily players up 3x since launch, and a party and narrative focus. TV party games including Boggle Party and Best Guess also launched in 2026, as reported.
- The cost shape. Tentpole rights are fixed-fee. They buy reach spikes without season-long obligations.
- Live economics. Live is just over 5% of 2026 content spend and about 1% of view hours, per the Q2 2026 letter, but 6 of the 10 biggest signup days in five years were live events.
What actually happened to the Warner Bros. deal?
This section exists because the deal still defines how the market reads Netflix's discipline. The state of it must be exact: the Netflix deal was signed, then terminated. It was not blocked by a regulator, not voted down, and it never closed. Warner Bros. Discovery belongs to someone else now.
What Netflix agreed to buy, on December 4, 2025:
- The assets. Warner Bros. only: the film and television studios, HBO, and HBO Max. The cable networks were never part of it. They were to be spun to WBD shareholders as Discovery Global before closing.
- The price. $27.75 per WBD share, first as $23.25 in cash plus about $4.50 in Netflix stock, then amended on January 19, 2026 to all cash. Equity value about $72.0B. Enterprise value about $82.7B.
- The promises. At least $2B to $3B of annual cost savings by year three, accretion to GAAP EPS by year two, and Warner Bros. run as it runs today, including 45-day theatrical windows, per the release and later Senate testimony.
- The financing. A $59.0B bridge commitment at signing. On December 19, 2025, $25B was termed out into a $5B revolver and $20B of delayed draw term loans, cutting the bridge to $34B. The all-cash amendment raised bridge commitments back to $42.2B.
- The fees. WBD owed Netflix $2.8B if it took a superior proposal. Netflix owed WBD $5.8B if regulators killed the deal.
How it died:
| Date | Event |
|---|---|
| Dec 5, 2025 | Netflix deal announced, $27.75 a share for Warner Bros. |
| Dec 8, 2025 | Paramount Skydance bids $30.00 cash for all of WBD |
| Dec 17, 2025 | WBD board rejects Paramount, reaffirms Netflix |
| Jan 16, 2026 | DOJ issues a second request on the Netflix deal |
| Jan 20, 2026 | Netflix amends to all cash at $27.75 |
| Feb 3, 2026 | Sarandos testifies to the Senate antitrust subcommittee |
| Feb 17, 2026 | Netflix grants a seven-day waiver for a best and final bid |
| Feb 26, 2026 | WBD calls Paramount's $31.00 superior. Netflix declines to match |
| Feb 27, 2026 | WBD terminates the Netflix deal. Paramount pays the $2.8B fee to Netflix on WBD's behalf |
| Apr 23, 2026 | WBD shareholders approve the Paramount deal |
| Oct 6, 2026 | Paramount closes at $31.02 a share. The combined company is renamed Skydance Corporation (SKYD) |
Sources: Netflix and WBD 8-K filings and releases, DOJ and European Commission statements, and Reuters reporting.
The aftermath, in Netflix's own numbers:
- The fee in the P&L. Paramount paid the $2.8B fee to Netflix on WBD's behalf, per Netflix's Q1 2026 letter and WBD's 10-Q. The fee was recognized in interest and other income in Q1 2026 and the cash was received in the quarter. Q1 diluted EPS printed $1.23 against the company's $0.76 forecast. The company does not disclose the fee's after-tax effect. Outside estimates put it near $0.53 a share.
- The fee in the cash flow. The Q1 letter credited the fee for lifting Q1 operating cash flow to $5.3B and for raising the FY2026 free cash flow guide from $11B to $12.5B.
- No deal debt remains. All four deal facilities terminated on February 27, 2026, undrawn. Gross debt at September 30, 2026 was $15,132M, the ordinary stack, and a $1B bond deal in Q3 2026 funds a Q4 maturity.
- The rating held. Moody's affirmed Netflix at A3 in December 2025. No S&P action on Netflix over the deal was verified in the sources checked.
- The words. Sarandos and Peters, February 26, 2026: the deal "was always a 'nice to have' at the right price, not a 'must have' at any price."
- The stock agreed. Netflix closed at $96.24 on February 27, 2026, up 13.75% in the session after it walked away, per two price sources.
- The rival's bill. Skydance now carries the combined debt, a five-year court-enforceable film output commitment from the state AG settlement, and at least $1.5B of pledged additional US production investment. Consolidation happened. Netflix just did not pay for it.
The scenarios from here are simple because there is no pending deal. There is no closing risk, no financing overhang, and no integration risk on Netflix's books. The open question is competitive, and it sits in Sections 11 and 19: a combined Skydance owns HBO, Max, Paramount, and CBS, and Netflix has to out-program it with a content budget the rival now has to service alongside heavy debt.
Has Netflix delivered on its roadmap?
Guidance credibility is the quiet asset in this stock, and the last two years mostly built it. Netflix set a 2025 revenue guide of $43.5B to $44.5B and delivered $45.18B. It guided the 2025 operating margin to 29% and delivered 29.5%. In 2026 it has held the 31.5% margin guide in every letter while revenue growth slowed, which is the harder trick: the margin promise was kept by cost discipline, not by the top line rescuing it.
The audit is not spotless, and the blemish is exactly where the future growth is supposed to come from. Advertising was guided to roughly double in 2026, implying about $3B, and was cut to about $2.7B in October, with the company blaming its own rollout pace and partner plumbing. That is a delivery miss, owned in plain language, and it lands in the Leadership grade. The Warner Bros. line of the audit reads differently: a close in 12 to 18 months was promised, and no close happened, because management chose a $2.8B fee over a bidding war. We score that as discipline, not failure, and Section 9 shows the receipts.
| Promise | Set | Delivered | Grade |
|---|---|---|---|
| FY2025 revenue of $43.5B to $44.5B | Jan 2025 guide | $45.18B | Beaten |
| FY2025 operating margin of 29% | Jan 2025 guide | 29.5% | Beaten |
| FY2026 margin of 31.5% | Jan 2026 guide | Held in every 2026 letter | On track |
| FY2026 revenue of $50.7B to $51.7B | Jan 2026 guide | Narrowed to $51.1B after Q3 | On track |
| Ads revenue to roughly double in 2026 | Q4 2025 letter | Cut to about $2.7B in Oct 2026 | Missed |
| Ad reach build | Nov 2024 baseline | 190M viewers by Nov 2025, more than 250M by May 2026 | Delivered |
| Warner Bros. close in 12 to 18 months | Dec 2025 release | Walked away Feb 2026, fee collected | Not delivered, by choice |
| Engagement growth | Letters, 2025 | H1 2026 hours up 2% to more than 97B | Mixed |
| Internal 2030 goals (reported, not guidance) | WSJ, Apr 2025 | Market cap $254.8B against a $1T goal | Behind |
The reported internal 2030 goals also include $9B of advertising sales, per the WSJ reporting of the internal targets. Against advertising tracking to about $2.7B in 2026, that goal implies growth of roughly 35% a year to 2030. These are reported internal targets, not guidance, and the gap between the goal and the reset 2026 guide is the widest on this page.
How does Netflix compare with YouTube, Disney, and Skydance?
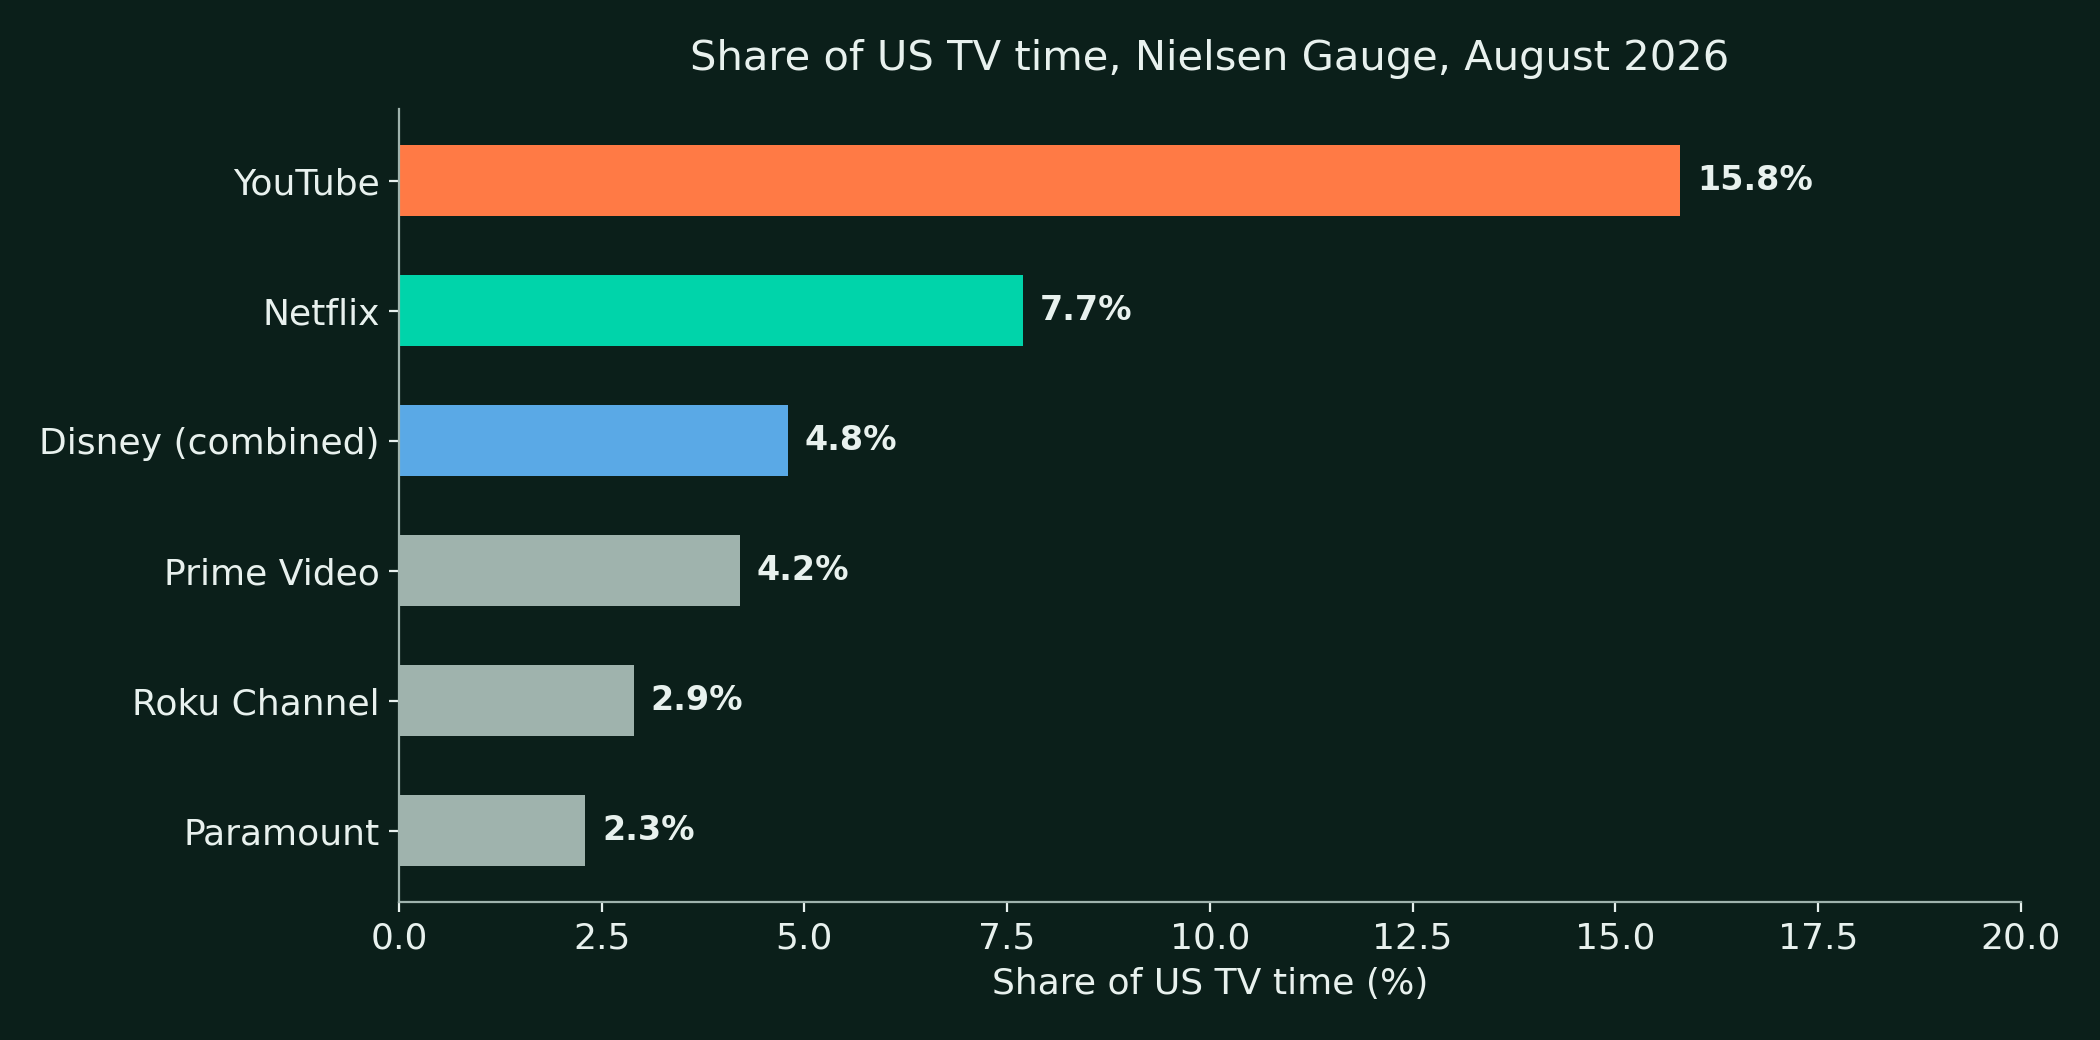
The fight is for television time first and subscription dollars second. On time, Netflix is not the leader. On profit per hour, nothing else is close.
| Rival | Scale marker | Profit marker |
|---|---|---|
| YouTube | 15.8% of US TV time, Aug 2026 | Ad revenue of $11.21B in Q3 2026, up 9%. YouTube Music and Premium passed 150M subscribers including trials, per Alphabet on October 28, 2026 |
| Disney | No subscriber totals reported in fiscal Q3 2026. Disney stopped reporting them after fiscal Q4 2025. Last counts: Disney+ 131.6M, Hulu 64.1M total | Entertainment SVOD revenue of $5.53B in fiscal Q3 2026, up 11%. Streaming operating income of $712M at a 12.9% margin, against $329M and 6.6% a year earlier |
| Prime Video | 4.2% of US TV time | No standalone subscriber or profit disclosure |
| Skydance (SKYD) | WBD streaming's last primary subscriber total is 131.6M at the end of Q4 2025. Q1 2026 was reported above 140M in secondary sources. Paramount+ had 81.6M subscribers at Q2 2026. Paramount holds 2.3% of US TV time | WBD streaming revenue passed $3B in a quarter for the first time in Q2 2026, about $3.1B per call summaries, with Streaming Adjusted EBITDA of $512M, up 63% ex-FX, at about a 17% margin. Paramount+ DTC Adjusted EBITDA was $366M in Q2 2026. The combined group now carries the deal debt |
Table note: the Disney fiscal Q3 2026 figures and the Paramount+ figures come from secondary coverage of those companies' releases, and the WBD streaming revenue figure comes from call summaries. The Netflix and YouTube figures are primary.
What the table says:
- YouTube is the time rival. It holds about twice Netflix's US TV share and monetizes attention with ads. It does not need subscriptions to win the hour.
- The gap is widening. In the August 2025 Gauge, YouTube held 13.1% and Netflix 8.7%, a gap of 4.4 points. A year later the gap is 8.1 points, and Netflix has lost a full point of TV time. July 2026 read YouTube 14.2% and Netflix 7.8%. No September 2026 Gauge exists. Nielsen's methodology change pushes the September and October editions out together.
- Disney is the subscription rival whose streaming profit is real but small. Fiscal Q3 2026 streaming operating income was $712M, up from $329M a year earlier, against Netflix's $13.3B of operating income in 2025.
- Skydance is the new scale rival. HBO, Max, Paramount+, CBS, and the Warner library now sit in one house. Its constraint is the balance sheet it bought them with.
- The profit pool is concentrated. Netflix earned more operating income in 2025 than the rest of premium streaming combined, on the figures in this table.
How strong is the moat?
The moat is not the catalog. Catalogs can be bought, as Skydance just proved. The moat is the machine that turns a fixed content bill into more than 97B hours of viewing per half year and then into price increases that members accept without churning. Every rival can rent content. None has replicated the conversion rate of spend into attention at this scale, and the gap shows up in the only place that matters: Netflix funds its slate from operating cash flow, while its two largest subscription rivals run their streaming segments near break-even.
Scale compounds in three quieter ways. The recommendation system trains on viewing from more than 190 countries, so a Korean thriller or a Spanish heist is an asset to the whole base, not a local bet. The amortization curve rewards the back catalog every quarter, because library titles keep drawing hours at almost no new cost. The March 2026 US price increase, the second in just over a year, lifted the ad plan to $8.99, Standard to $19.99, and Premium to $26.99, and churn still improved year over year in Q3 2026, after the increase, per the letter. And the ad tier now plugs into the same machine, selling the attention the subscription built. A challenger must beat all three at once, while servicing content costs that do not shrink because the challenger is smaller.
The moat has honest edges, and the report does not hide them. YouTube takes twice the US TV time with a cost base of revenue shares rather than fixed slates, and it is the default screen for younger viewers. Engagement hours grew only 2% in H1 2026, so the attention pool Netflix monetizes is no longer expanding quickly. The moat protects the profit pool. It does not guarantee the pool keeps growing, which is why the growth debate in this stock is about ads and price, not about survival.
How should investors grade the co-CEOs and the board?
- The top. Ted Sarandos and Greg Peters remain co-CEOs. Spence Neumann remains CFO. The structure survived the deal year intact.
- The founder. Reed Hastings resigned from the board in June 2026 and holds no seat. The 2026 proxy presents it as long-planned. It is a governance event and, on the evidence, an orderly one.
- The content chair. Peter Rice was appointed chief content officer effective October 26, 2026, as reported by Reuters on October 15, 2026. Bela Bajaria, who had held the role since January 2023, departed earlier in October. Film chief Dan Lin was dismissed days after the Rice appointment, per Variety on October 19, 2026, with deputies Doug Belgrad and Sheroum Kim also out. Rice leads film on an interim basis. Slate continuity is a live question for 2027.
- The legal chair. General counsel Eunice Lee departed in early October 2026, with Catie Glidden as interim.
- The cost line. In mid-October 2026 the company cut roughly 1,000 roles, about 6% of staff, per Reuters reporting of an internal memo. Severance sits inside the Q4 margin guide at about 120 basis points.
- Capital allocation. The year's evidence is strong: a $25B buyback authorization added in April 2026, a record $4.8B bought in Q3 alone, and a walked-away deal that netted $2.8B instead of $42B of bridge debt.
- The blemish. The ads guide cut is a management miss, and the content leadership churn lands at the same time. Both are scored in the five-pillar companion.
How strong is the balance sheet?
At September 30, 2026, from the Q3 financial statements:
| Item ($M) | Amount |
|---|---|
| Cash and equivalents | 8,194.3 |
| Total current assets | 14,728.2 |
| Content assets, net | 34,605.5 |
| Total assets | 58,682.0 |
| Total debt (current plus long-term) | 15,132.0 |
| Total liabilities | 29,396.0 |
| Total shareholders' equity | 29,286.0 |
| Treasury stock, at cost | (33,233.0) |
| Shares outstanding | 4,106.3M |
- Net debt is $6.9B. Gross debt of $15,132M less cash of $8,194.3M gives net debt of $6,937.7M. The Q3 letter rounds gross debt to $15.3B. Against guided FY2026 operating income of about $16.1B, net debt is about 0.43 times. This is still a lightly levered company.
- The stack rolls, it does not grow. A $1B bond deal in Q3 2026 funds a Q4 maturity.
- The equity line is a buyback artifact. Book equity stands at $29,286M after treasury stock at cost of $33,233M is charged against it. The repurchase program, not losses, is what the equity line nets against. It is not distress. It is arithmetic.
- The real obligations are content liabilities. Current content liabilities of about $3.0B sit inside payables, and the slate commits cash ahead of revenue by design.
- Ratings. Moody's affirmed A3 in December 2025 during the deal. That affirmation was never stress-tested by closing, because the deal debt never landed.
- No deal debt. Every Warner facility terminated undrawn on February 27, 2026. Section 9 carries the detail.
Where does the cash go?
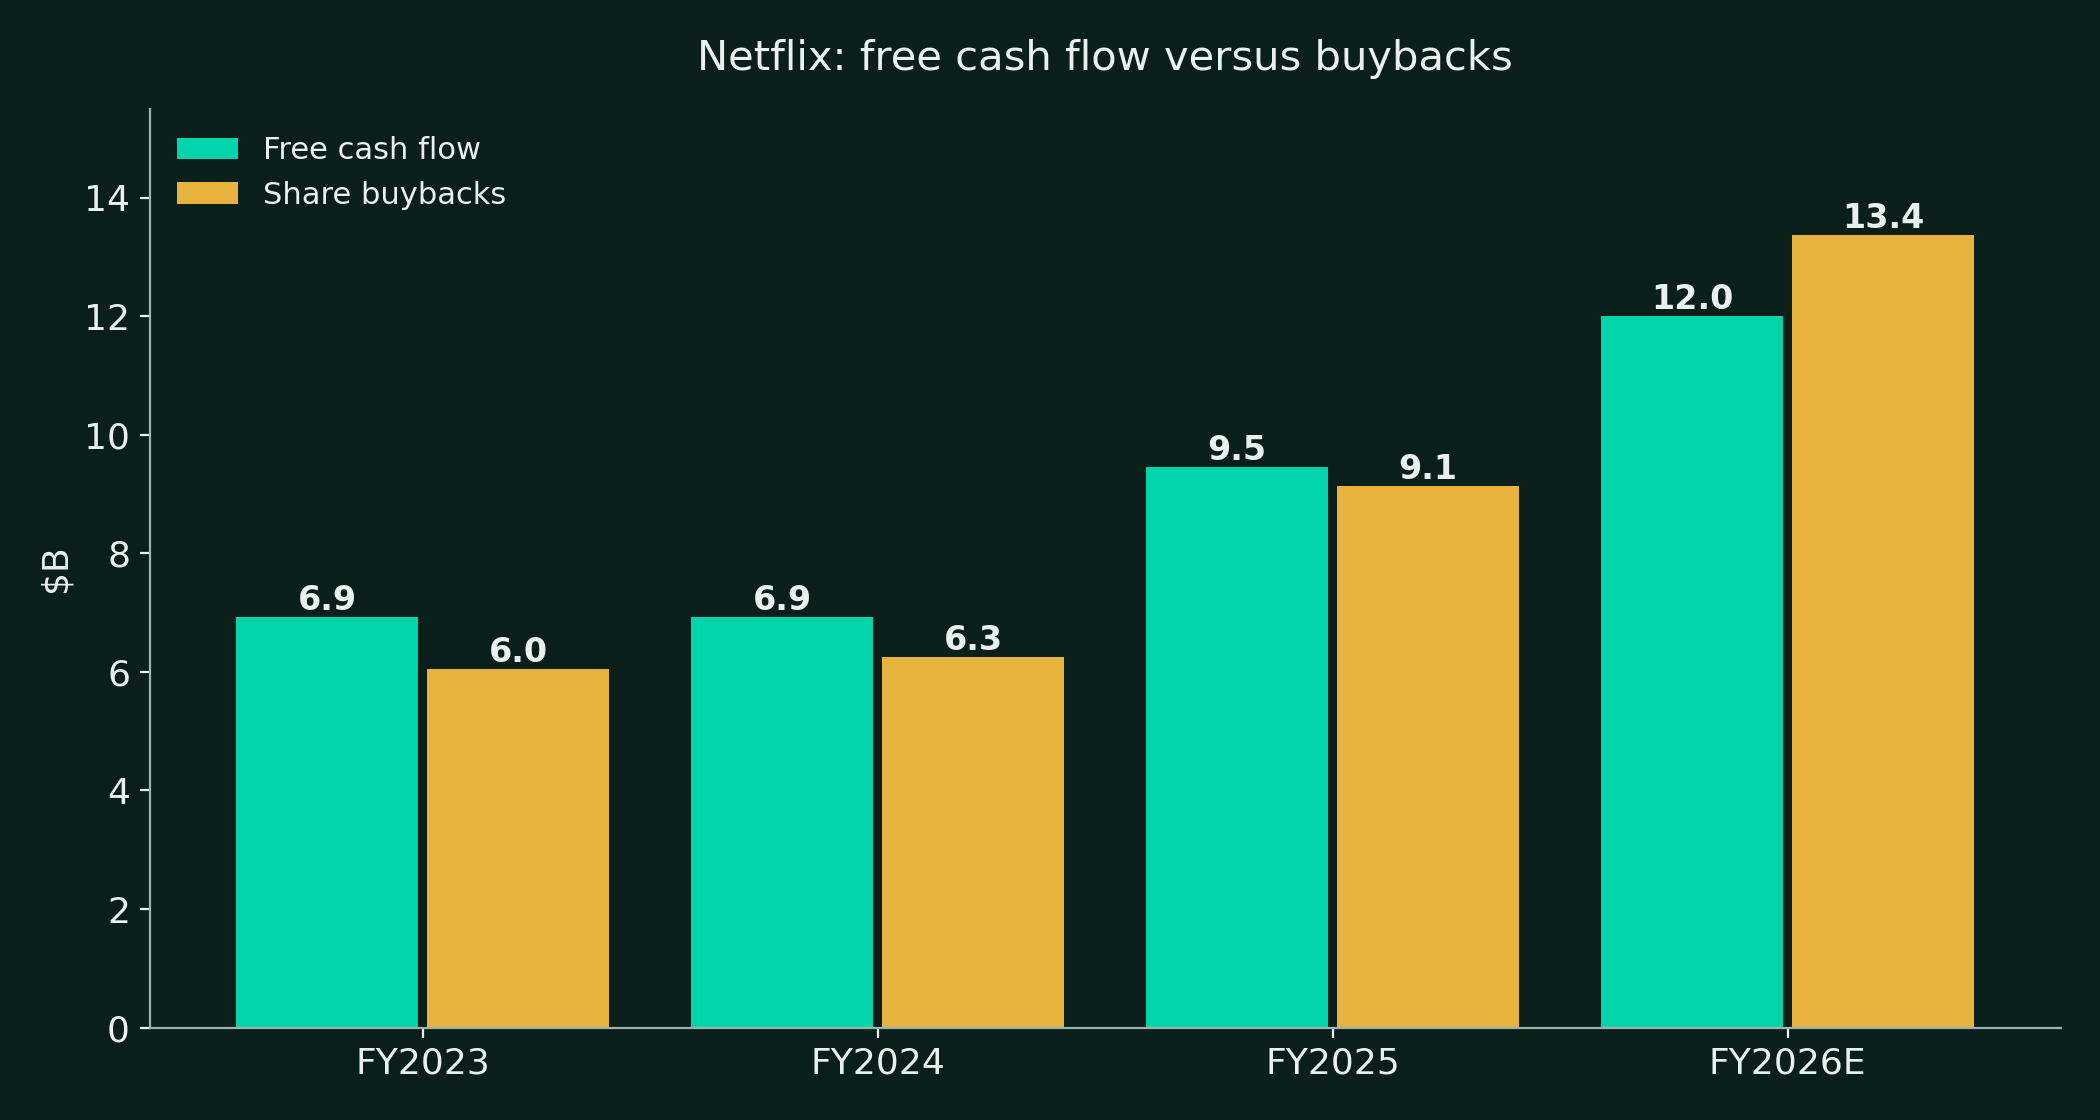
- The conversion. Free cash flow was $6,925M in FY2023, $6,922M in FY2024, and $9,461M in FY2025. FY2025 operating cash flow was $10,149M against capex of $688M. That is about 71% of FY2025 operating income converted to free cash. The FY2023 figure rests on XBRL aggregation and carries lower confidence than the later years.
- The guide. FY2026 free cash flow is guided to about $12B. The path ran $11B at the start of the year, up to $12.5B after the termination fee, then to about $12B on a Q4 real estate closing.
- Q1 needs a footnote. Q1 2026 free cash flow of $5.1B, as the company presented it, includes the $2.8B fee receipt. The underlying run rate is the Q2 and Q3 prints of $2.7B and $2.9B on the statements.
- Buybacks. $6,045.1M in FY2023, $6,263.7M in FY2024, $9,127.2M in FY2025, and $10,781.7M in the first nine months of 2026. Q2 2026 was $4,714.4M and Q3 2026 was $4,796.7M, the largest repurchase quarter in company history. The board added $25B of authorization on April 22, 2026.
- What is left. Remaining authorization at September 30, 2026 was $22.3B. Q4 buybacks are guided at about $2.6B.
- No dividend. Netflix pays none and guides to none. The buyback is the entire return program.
- The discipline test. Buybacks paused while the Warner deal was live and resumed the quarter it died. Capital returns here follow a stated order: content first, balance sheet second, repurchases with the rest.
What is Netflix worth at $62.05?
At $62.05, on 4,106.3M shares, the market cap is $254.8B.
Enterprise value, piece by piece:
| Piece | $B |
|---|---|
| Market cap at $62.05 | 254.8 |
| Plus total debt | 15.1 |
| Minus cash and equivalents | (8.2) |
| Enterprise value, our math | About 261.7 |
The multiples, with the fee handled honestly:
- Trailing diluted EPS for the four quarters to Q3 2026 is $3.46. The trailing P/E is 17.9 times.
- About $0.53 of that EPS is the after-tax termination fee, on outside estimates at the quarter's tax rate. The company does not disclose the figure. Stripped out, trailing EPS is about $2.93 and the multiple is 21.2 times.
- Guided FY2026 EPS is $3.57, the nine-month $2.90 plus the Q4 guide of $0.67, on guide net income of $2,787M. That is 17.4 times, or about 20.4 times with the fee stripped out on the same outside estimate.
- Enterprise value is 5.1 times guided FY2026 revenue. Market cap is 21.2 times guided FY2026 free cash flow.
- The street has not given up. Average analyst targets sat at $84.76 (StockAnalysis) and $89.14 (MarketBeat) on October 29, 2026, per those data providers.
- The stock fell after three straight earnings reports in 2026, per coverage of the prints. The de-rating is a growth verdict, not a solvency verdict.
What are the FY2029 bear, base, and bull targets?
We value Netflix on FY2029 diluted EPS and an exit multiple. The share count falls in every case on buybacks funded from free cash flow.
| Case | FY2029 revenue | FY2029 EPS | Exit multiple | FY2029 target |
|---|---|---|---|---|
| Bear | About $61B | $3.85 | 12x | $46 |
| Base | About $70B | $5.00 | 17x | $85 |
| Bull | About $75B | $5.90 | 20x | $118 |
The math, line by line:
- Bear: $3.85 times 12 equals $46.20, rounded to $46.
- Base: $5.00 times 17 equals $85.
- Bull: $5.90 times 20 equals $118.
The base EPS build, shown in full:
- Revenue of about $70B at a 33% operating margin gives operating income of about $23.1B.
- Less interest and tax at guided patterns gives net income of about $18.8B.
- Buybacks take the share count to about 3.75B. EPS lands at about $5.00.
What each case assumes:
- Bear. Revenue growth fades to about 6% a year as price annualizes out and engagement stays flat.
- Bear. Margin stalls near 30% as content costs and Skydance competition bite. Advertising reaches only about $4B.
- Bear. The market pays a utility multiple of 12 times for a slow streamer.
- Base. Revenue compounds at about 11%. Advertising reaches about $6B by 2029 on the reset trajectory.
- Base. Margin reaches 33% and holds. Live events add retention, not a second business.
- Bull. Revenue compounds at about 13.5% as advertising re-accelerates toward $9B and live becomes a weekly habit.
- Bull. Margin reaches about 35.5%. The market pays 20 times for the only self-funding grower in media.
- The current price of $62.05 sits between bear and base, much closer to bear. That gap is the opportunity and the argument of this report.
What does the chart say?
- The close of $62.05 on October 29, 2026 sits below the 50-day average of $73.03.
- It sits further below the 200-day average of $81.73.
- RSI (14) is 30.5. The stock is at the edge of oversold on that gauge.
- Averages and RSI are DalalBytes calculations from Finnhub daily closes through October 29, 2026.
- The 52-week intraday range is $61.39 to $116.73. The October 29 low of $61.39 set the bottom of that range.
- The record close was $124.14 on October 21, 2025, with an intraday record of $124.86 the same day, per the price series and Nasdaq data as reported.
- The fall from the record close is 50.0%. The year-to-date fall is about 34%.
- About 45.0M shares changed hands on October 29, 2026, per MarketBeat.
- Three straight post-earnings falls built this chart. A downtrend with an oversold gauge is a setup for a relief rally, not proof of a bottom.
What are the main risks?
The central risk is that the growth deceleration is a slope, not a step. Revenue growth has already stepped down from 16.2% to 11.8% in three quarters, and the Q4 guide extends the line to 11.5%. If price annualization fades before advertising scales, growth can cross below 10% in 2027, and a stock still priced above 20 times underlying earnings de-rates again. The market has delivered that verdict after three consecutive prints, and nothing in the filings yet proves the fourth will differ.
The second risk is that the advertising leg is harder than the plan. The first guide cut blamed rollout pace and partner integrations, and the Amazon DSP connection, a key demand partner integration, is unsettled in the reporting, described as available in some markets from late 2025 with a deeper integration reported as pushed to 2027. Advertising is also the most cyclical line Netflix has ever carried: it sells into the same upfront market that just watched a consolidated Skydance take HBO and Paramount inventory into one sales house. A soft ad market in 2027 would hit the growth leg and the multiple at the same time.
Competition is the third risk, and it changed shape this year. Skydance now owns the Warner library, HBO, Max, Paramount, and CBS, and it bought them with debt that forces it to compete for cash, which can mean aggressive bundling and discounting across the market. YouTube, meanwhile, takes twice Netflix's share of US TV time with a cost model that shares revenue instead of prepaying slates. Netflix's answer is content quality and price discipline. Both are management variables, and the content leadership was rebuilt in the same month, with Peter Rice taking the chief content officer chair on October 26, 2026 and the film chief dismissed days later.
The quieter risks sit in the machine itself. Content spend, running at a guided cash-to-amortization ratio of roughly 1.1x, must keep rising to defend engagement, and amortization expense follows it with a lag, so a slate that underperforms shows up in margins a year later. About 58% of revenue comes from outside UCAN, which imports currency and local regulatory risk into every guide. And any future large deal would again be debt-funded from a standing start, as the $59B bridge showed, because the buyback absorbs the spare cash as fast as the machine makes it. None of these break the thesis at $62.05. Together they cap how fast the score can rise.
What should investors watch next?
What to watch:
- The Q4 print and the 2027 guide, expected with the January earnings release. The advertising trajectory in that guide is the single tell for the score.
- The content rebuild. Peter Rice took the chief content officer chair on October 26, 2026 and leads film on an interim basis after Dan Lin's dismissal. His first slate decisions are the tell.
- Ad product milestones. Format launches, measurement deals, and the Amazon DSP connection date.
- Skydance's first moves. Bundling, pricing, and any Max or Paramount+ merger of services.
- Buyback pace. Q4 is guided at about $2.6B. A faster pace at these prices is management voting with cash.
- Engagement reports. The next edition shows whether hours growth re-accelerates or stays near 2%.
The conclusion:
Netflix in October 2026 is a company whose business improved and whose narrative worsened. Margins, cash flow, and discipline all set records in the same year the growth rate halved and the stock halved with it. The filings describe a 31.5% margin machine converting most of its profit to cash, with $6.9B of net debt and a $22.3B buyback authorization still loaded. The price describes a streamer running out of road. One of them is wrong, and the evidence in this report says it is the price. 72/100, Positive.
Frequently asked questions
Why did Netflix walk away from Warner Bros.?
Paramount Skydance kept raising an all cash bid for the whole company, reaching $31.00 a share. Netflix held its $27.75 price for the studios and streaming assets only, judged the match uneconomic in its February 26, 2026 statement, and let WBD terminate the next day. Netflix received the $2.8B termination fee and never drew a dollar of deal debt.
Why does the equity line look so worked over at a company this profitable?
Buybacks are charged against equity. Treasury stock at cost stands at $33.2B, so the $29.3B of book equity is what remains after the repurchase program is netted against retained earnings and paid-in capital, even after earning $10.9B in 2025. Credit analysis runs off gross debt of $15.1B against $8.2B of cash and about $16.1B of guided operating income, not off the book equity line.
What has to go wrong for the $46 bear case?
Growth has to fade to about 6% a year, margin has to stall near 30% under content cost pressure and Skydance competition, and advertising has to stall near $4B. That path gives FY2029 EPS of about $3.85, and at a 12 times multiple the stock is worth $46. The bear case is a slow streamer priced like a utility.
Disclosures
- This analysis is research and opinion.
- It is not investment advice.
- DalalBytes Research. For educational purposes only. Not investment advice.
- Numbers come from company filings, shareholder letters, Nielsen publications, and named press reports.
- Statements about guidance are management claims as printed in the shareholder letters. They are labeled as guidance wherever they appear.
- The after-tax value of the Warner Bros. termination fee, about $0.53 a share, is an outside estimate. The company does not disclose it.
- All prices and per-share figures are on the post-split basis from the November 2025 10-for-1 split.
- The author holds no position in Netflix at the time of publication.