|
DALALBYTES The Weekly Technical MapAfter the Rout Sunday, November 8, 2026 · Every line graded. Every level redrawn. | ||||||||||||||||||||||||||||||||||||||||||||||||||||||||||||||||||||||||||||||||||||||||||||||||||||||||||||||||||||||||||||||||||||||||||||||||||||||||||||||||||||||||||||||||||||||||||||||||
| ||||||||||||||||||||||||||||||||||||||||||||||||||||||||||||||||||||||||||||||||||||||||||||||||||||||||||||||||||||||||||||||||||||||||||||||||||||||||||||||||||||||||||||||||||||||||||||||||
|
THE WEEK IN ONE LINE The rotation became a correction. The old map's downside targets were hit and broke below, fourteen of eighteen, and the index itself closed the week on its 200-day average. | ||||||||||||||||||||||||||||||||||||||||||||||||||||||||||||||||||||||||||||||||||||||||||||||||||||||||||||||||||||||||||||||||||||||||||||||||||||||||||||||||||||||||||||||||||||||||||||||||
|
THE THREE GAUGES
Thursday was the worst index session since April 2025, and it graded the October 30 map the hard way. Fourteen downside targets were reached and ten were overshot by at least another tenth. Microsoft's bounce target broke above on Wednesday and was lost in the rout. Amazon's downside target was never tested and is struck: its earnings gap landed on the marked support and the stock rose 6.4% on the week. Alphabet never made a new low, even on Thursday. Friday's rebound was led by the most oversold names on heavy volume, the signature of covering, not confirmation. The map below is drawn from Friday's close, lower, with the air pockets labeled instead of hidden. | ||||||||||||||||||||||||||||||||||||||||||||||||||||||||||||||||||||||||||||||||||||||||||||||||||||||||||||||||||||||||||||||||||||||||||||||||||||||||||||||||||||||||||||||||||||||||||||||||
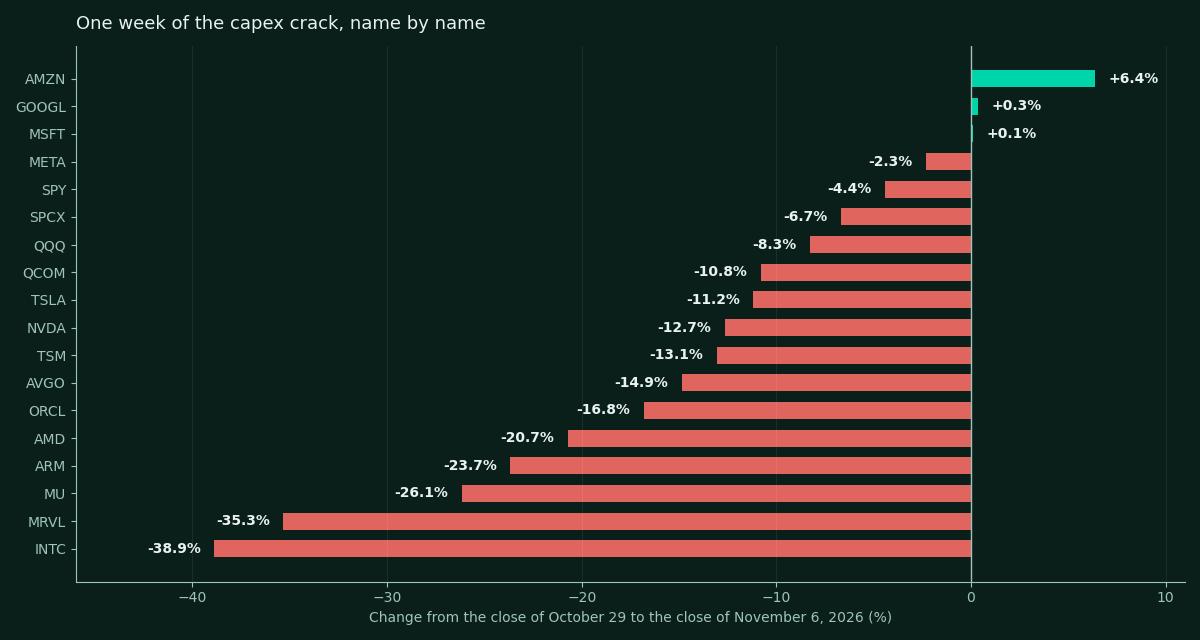
The week in one picture: one green bar of size, two names flat, and a long red staircase below them. | ||||||||||||||||||||||||||||||||||||||||||||||||||||||||||||||||||||||||||||||||||||||||||||||||||||||||||||||||||||||||||||||||||||||||||||||||||||||||||||||||||||||||||||||||||||||||||||||||
|
THE MAP, ON ONE PAGE Closes of Friday, November 6, 2026. Five names join this week: SOXX as the third gauge, and BlackBerry, Nebius, Akamai and Palantir, mapped in the full article and graded from next week.
Open air: a name marked open air has fallen through its last marked support shelf. Within the past year of trading there is no level below it where buyers previously showed up, so the map labels the air pocket rather than inventing a floor. | ||||||||||||||||||||||||||||||||||||||||||||||||||||||||||||||||||||||||||||||||||||||||||||||||||||||||||||||||||||||||||||||||||||||||||||||||||||||||||||||||||||||||||||||||||||||||||||||||
|
THE CROWD'S CHARTS 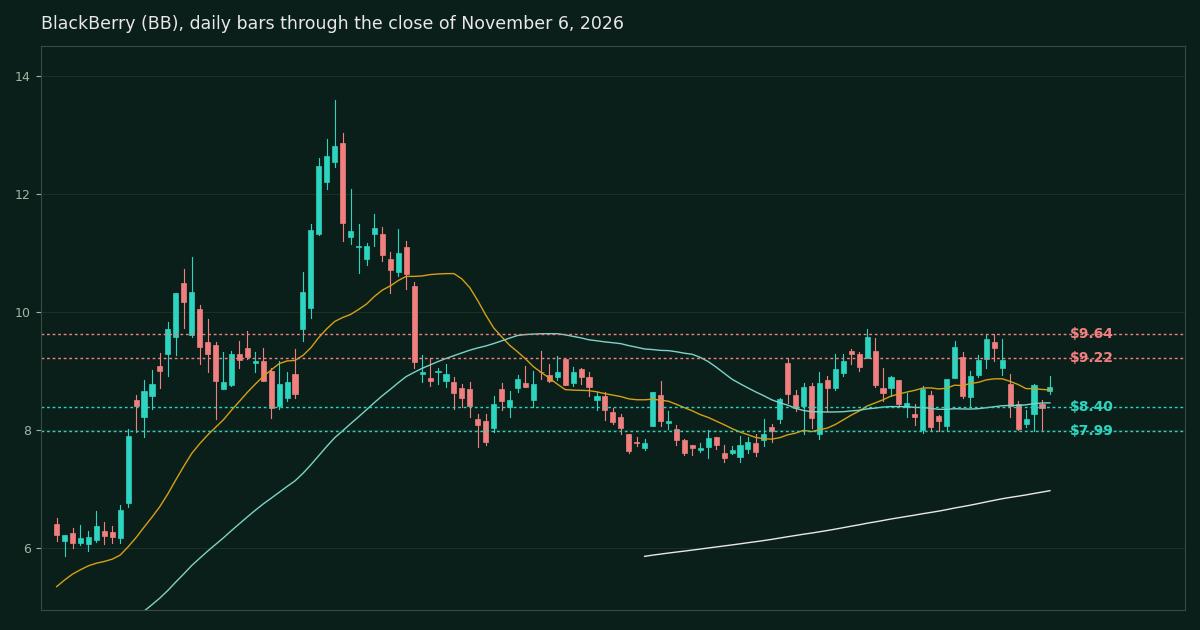
BlackBerry did the least damage on the map. Down 4.9% in a week the semiconductor gauge fell 20%, it tested $7.99, held, and closed above its 20-day and 50-day averages with a neutral RSI of 50.7. Alongside Amazon, it is one of only two names above every major average. The range is $7.99 to $9.64 until a close says otherwise. Nebius (down 24.7% on the week) and Akamai (post-earnings break) join the map in the full article. Palantir gets its own chart just below. 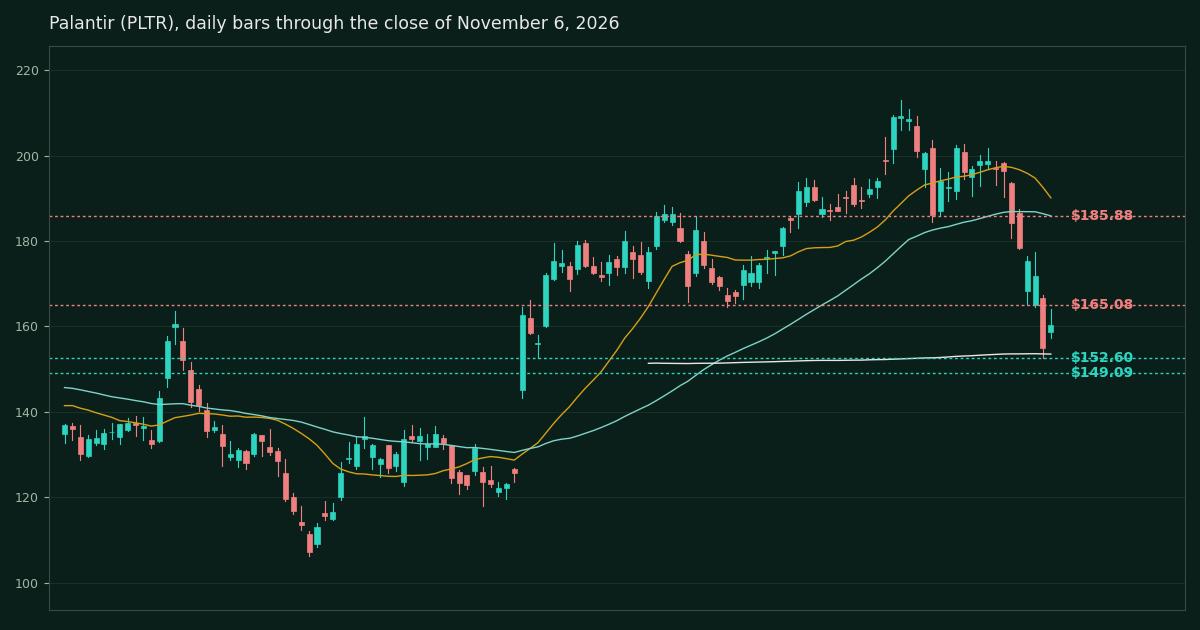
Palantir joins the map for the crowd as well. It fell 18.4% in its earnings week despite a print that strengthened the story, and stopped exactly where a holder would want it to: Thursday's low of $152.60 sits on the 200-day average at $153.53, and Friday closed at $160.38, above it. A close below that shelf opens the downside target at $149.09. The first repair line is the September shelf at $165.08, and the bounce target is the 50-day average at $185.88. | ||||||||||||||||||||||||||||||||||||||||||||||||||||||||||||||||||||||||||||||||||||||||||||||||||||||||||||||||||||||||||||||||||||||||||||||||||||||||||||||||||||||||||||||||||||||||||||||||
|
Read the full map: all 23 charts →
Follow the week's levels as they get tested, live, on X: @pdamodaran | ||||||||||||||||||||||||||||||||||||||||||||||||||||||||||||||||||||||||||||||||||||||||||||||||||||||||||||||||||||||||||||||||||||||||||||||||||||||||||||||||||||||||||||||||||||||||||||||||
| ||||||||||||||||||||||||||||||||||||||||||||||||||||||||||||||||||||||||||||||||||||||||||||||||||||||||||||||||||||||||||||||||||||||||||||||||||||||||||||||||||||||||||||||||||||||||||||||||
|
See you next Sunday. | ||||||||||||||||||||||||||||||||||||||||||||||||||||||||||||||||||||||||||||||||||||||||||||||||||||||||||||||||||||||||||||||||||||||||||||||||||||||||||||||||||||||||||||||||||||||||||||||||
|
DalalBytes · Boutique equity research, Peter Lynch style. For educational purposes only. Not investment advice. Technical levels are observations about past prices, not predictions. |