Unity Software
(NYSE: U)
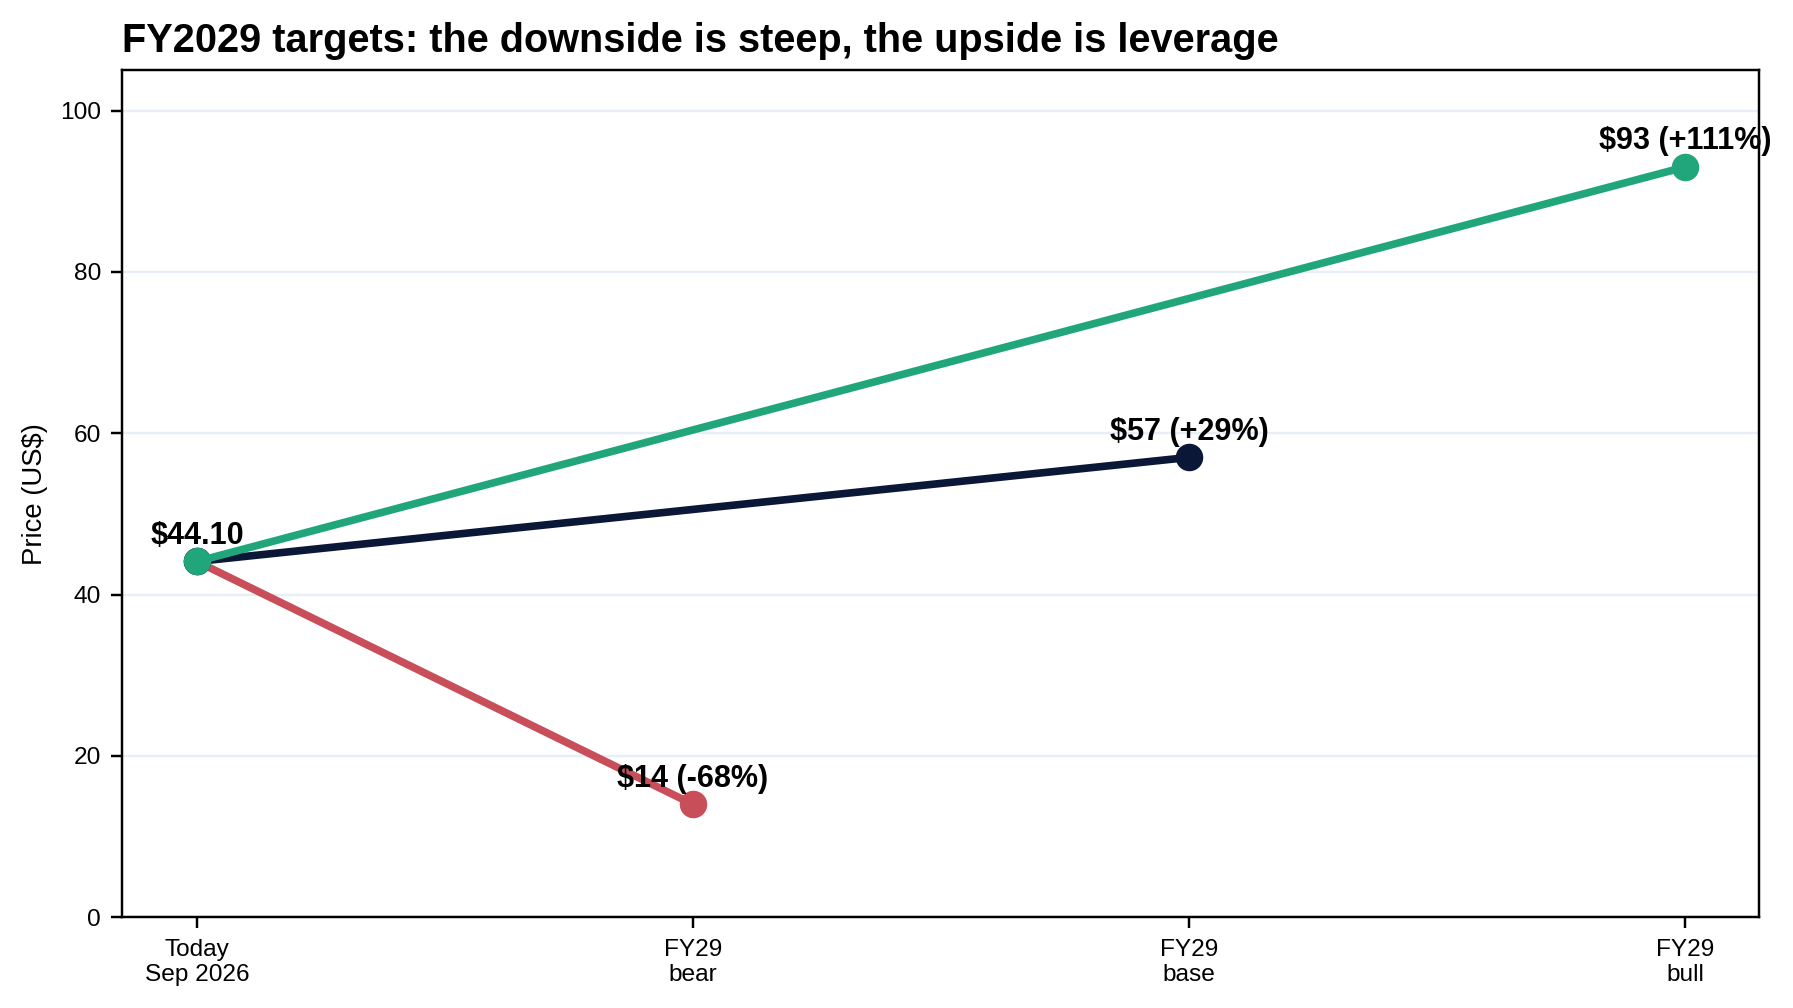
FY2029 targets: $14 bear / $57 base / $93 bull, from $44.10. Five pillars: 4 pass, 1 partial (moat).
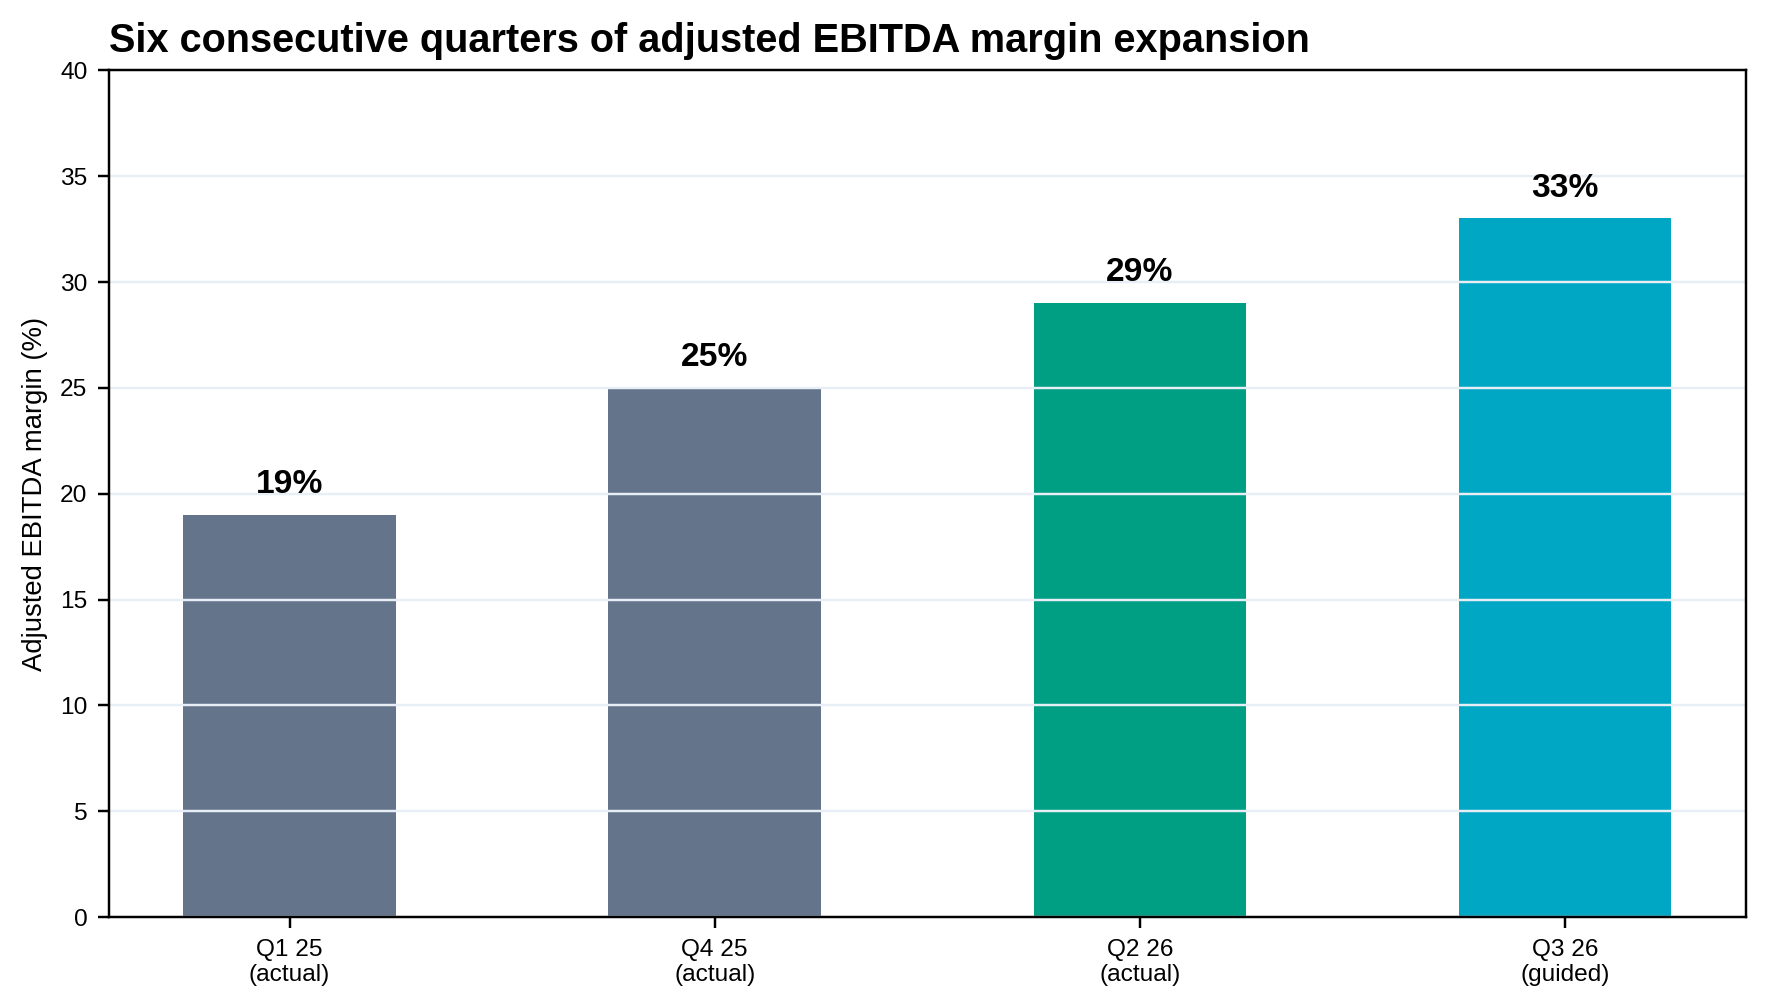
Unity is two businesses: Create (the game engine, subscriptions) and Grow (the mobile ads business, rebuilt around Vector). Both were broken in different ways, Create by the 2023 Runtime Fee disaster and Grow by a bloated ironSource inheritance. Since May 2024, CEO Matthew Bromberg has fixed the engine's trust problem, killed the bad ads assets, and expanded adjusted EBITDA margins from 19% to 29% in six quarters. The investment question is whether that margin can reach the high 30s by FY2029 while revenue compounds in the mid teens. The evidence says yes, if Vector keeps scaling and the cost base stays reset. The price, at 36x trailing adjusted EBITDA, already assumes it.
Matthew Bromberg canceled the Runtime Fee, reset the portfolio, and turned Unity from a cash-burning story into a compounding one: six straight quarters of adjusted EBITDA margin expansion, Vector past a $1 billion run rate, free cash flow strongly positive, and the balance sheet flipped to net cash. DalalBytes scores it 75/100, Positive.
From a $44.10 reference price: bear $14, base $57, bull $93. The bear case assumes Vector stalls and the margin settles in the low 20s, a 68% capital loss. The base case assumes Grow compounds at about 20% on Vector momentum and the margin bridge delivers 37%. The return is asymmetric only if the leverage story holds.
Unity sells the tools to make interactive 3D content and the tools to make money from it. Management reports two segments:
Since the portfolio reset, Unity reports "strategic" revenue (the businesses it is keeping) separately from "non-strategic" (the legacy and discontinued pieces being wound down). In Q2 2026, strategic revenue was $486.4M, up 38%, while non-strategic was $60.1M, down 33%. For Q3, management guides non-strategic down to ~$20M, roughly 4% of revenue. The headline growth rate will converge to the strategic growth rate as this drag disappears, which mechanically lifts reported growth without any change in the underlying businesses.
The key disclosure gap: Unity does not report gross margins separately for Create and Grow. Any margin bridge must therefore be built at the consolidated level. Segment-level economics in this report are discussed qualitatively, and the bridge is labeled an analytical estimate wherever it appears.
Matthew Bromberg became CEO on May 15, 2024, inheriting a company in a trust crisis. His predecessor, John Riccitiello, had announced the Runtime Fee on September 12, 2023, a per-install charge that triggered a developer revolt; Riccitiello retired a month later. Bromberg canceled the Runtime Fee on September 12, 2024, exactly one year later, and raised subscription prices instead: secondary reporting puts the Pro increase at 8% and Enterprise at 25%. The lesson he drew was that developers pay for seats, not for installs.
The Grow turnaround has one name: Vector, Unity's AI-driven advertising platform. In Q2 2026, Vector grew 23% sequentially, against management's prior expectation of 12-13%, and passed a $1B annualized revenue run rate two quarters ahead of plan. Day 28 campaign spend nearly tripled sequentially; Day 28 ROAS adoption exceeded 25% of Unity's advertising base; and late in the quarter, runtime data from ~3B monthly consumers began feeding Vector's live models. The flywheel is visible: more advertisers, more spend per campaign, better models, more advertisers.
The 2022 ironSource merger was supposed to make Unity a mobile-advertising powerhouse; instead it left a bloated portfolio. The cleanup is almost done: the legacy ironSource Ads Network was shut on April 30, 2026, Supersonic was sold to Tripledot in August 2026, and LevelPlay mediation was retained. Non-strategic revenue, which was $60.1M in Q2 (down 33%), is guided to ~$20M in Q3. What remains is a cleaner, Vector-led ads business growing at 60%+.
The honest competitive read. AppLovin remains the core Grow competitor and operates at far higher margins. A sample-specific 2025 study found AppLovin MAX far ahead of LevelPlay in top-downloaded and top-grossing ad-monetized games. Unity's Ads SDK presence is high in sampled Android games, but SDK presence is not mediation share or revenue share. Vector's momentum is real, but Unity is the challenger here, not the leader.
What to watch: whether Vector's sequential growth sustains past the initial migration wave; whether LevelPlay regains mediation share; and how the mobile ad cycle, which is currently recovering, behaves in a downturn.
Create is the steadier half: engine subscriptions sold per seat to game developers and, increasingly, to industrial and enterprise users. Strategic Create grew ~14% in Q2 2026 excluding a $12M prior-year item, and is guided to $159-163M in Q3 (up 7-10%). The economics improved when Bromberg replaced the Runtime Fee with straightforward price increases on Pro and Enterprise tiers.
Competitive position. Unreal Engine dominates high-end PC and console; Unity dominates mobile. AI-native creation tools and Roblox-native tooling are emerging threats at the low end. Avoid unsupported engine market-share claims: the moat here is switching costs and ecosystem depth in mobile, not a monopoly.
This is the section that decides the investment. Unity's adjusted EBITDA margin went from ~19% in Q1 2025 to 29% in Q2 2026, with ~33% guided for Q3. The question is how much further it can go, and what carries it there.
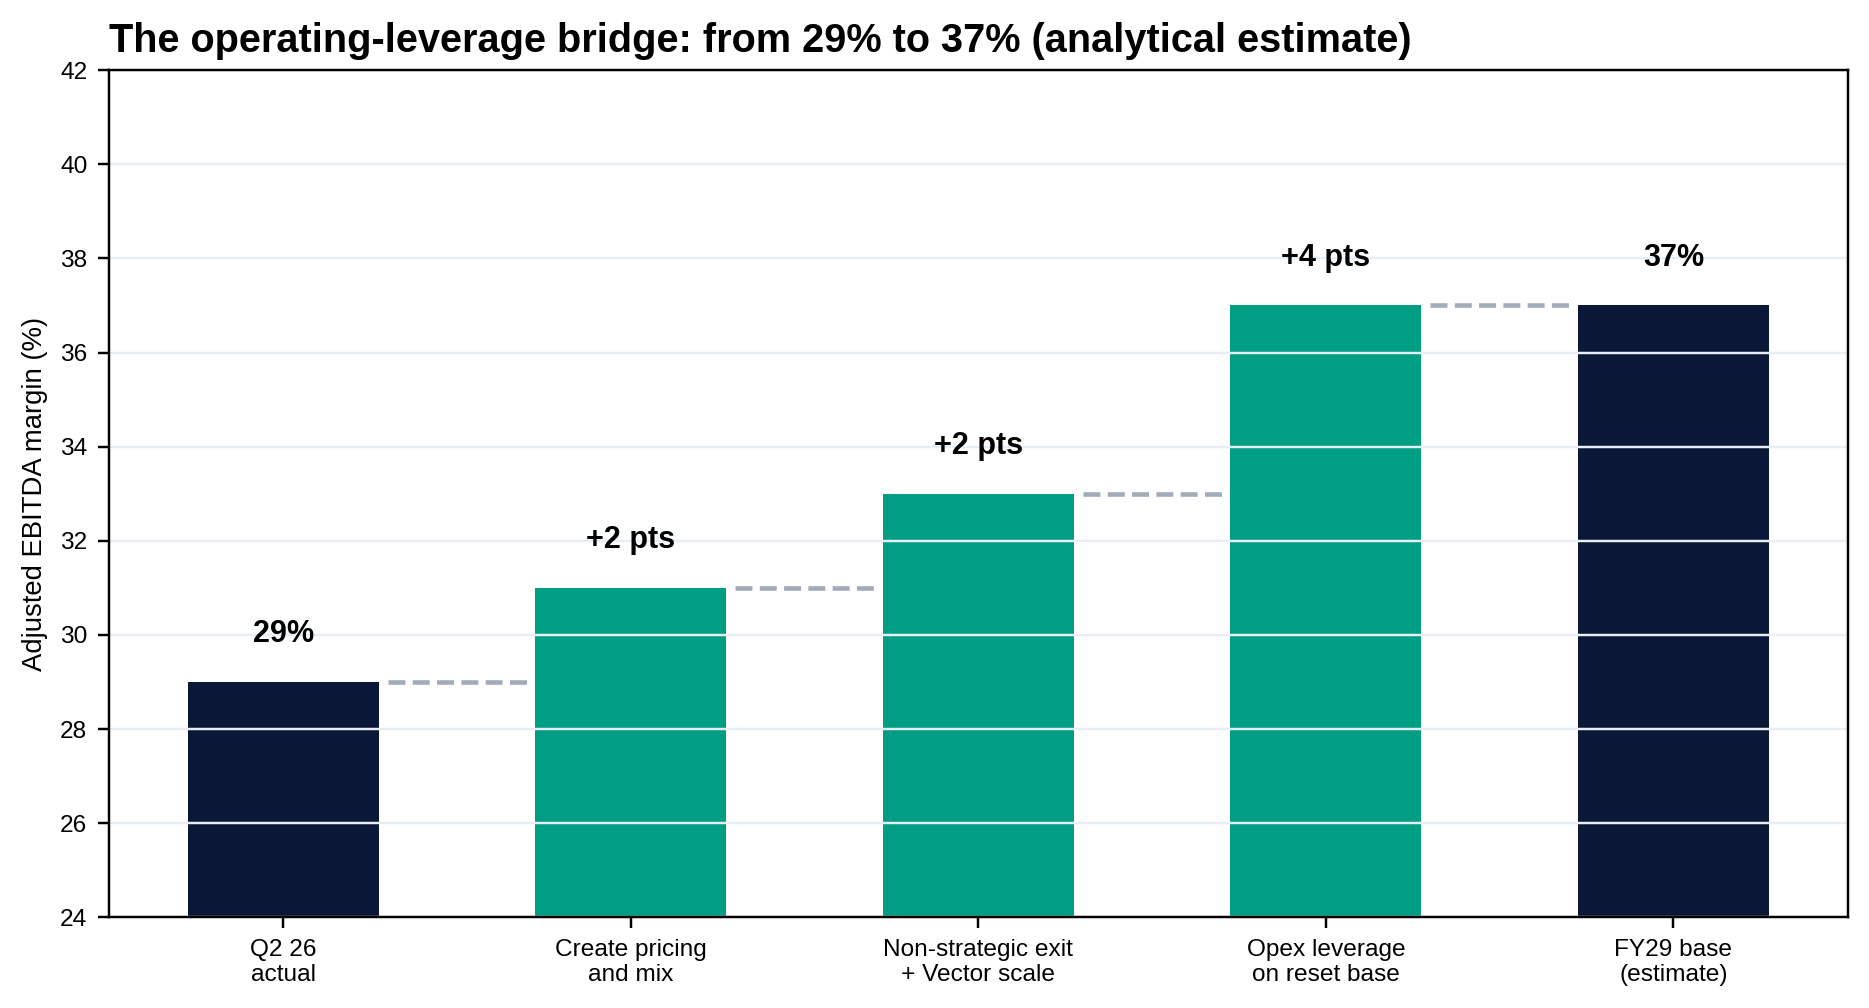
The FY2029 base case assumes a 37% adjusted EBITDA margin, the midpoint of a 35-39% range. The bridge from Q2 2026's 29%:
What SBC does and does not do. Stock-based compensation fell from 32.9% of revenue in FY2024 to 20.8% in FY2025 to 14.6% in Q2 2026. That normalization improves GAAP profitability and per-share economics, but it does not raise adjusted EBITDA, which already excludes SBC. Do not double-count it in the bridge.
A margin bridge is a promise. Here is what breaks it, in rough order of likelihood:
1. Vector decelerates. The 23% sequential growth and $1B run rate are the engine of the Grow margin story. If that was a one-time migration surge rather than a compounding flywheel, the +2 points from Vector scale do not materialize, and the bull case collapses.
2. The mobile ad cycle turns. Grow is two-thirds of revenue and cyclically exposed. In a mobile-ad downturn, the high incremental margins of the ads business work in reverse.
3. AppLovin keeps winning mediation. If LevelPlay continues to lose share to MAX, Unity's ads growth comes entirely from its own network, capping the scale benefit.
4. Create seat churn. Poor price elasticity on the Pro/Enterprise increases, or drift toward Unreal, Godot, or AI-native tools, would stall the highest-margin revenue line. The Runtime Fee episode showed how fast developer trust can break; it has been repaired, not made permanent.
5. The cost base reaccelerates. The +4 points from opex leverage assume the reset holds. Cloud costs, AI R&D, or a renewed hiring wave would eat it. SBC rebounding would not hit adjusted EBITDA, but it would dilute shareholders.
The bear case in one line: if Vector stalls and opex discipline slips, the margin settles in the low 20s instead of the high 30s, and a stock priced at 36x trailing adjusted EBITDA has a long way down. That is the $14 bear target.
Free cash flow is the strongest evidence that the turnaround is not an accounting exercise. Q2 2026 FCF was $202M, up 59% year over year; trailing-twelve-month FCF is ~$533M (estimate); FY2025 FCF exceeded $400M, up 41%, converting at ~99% of adjusted EBITDA. The business now funds itself.
Unity still reports GAAP losses (Q2 2026: -$22.7M), but the gap is closing fast: SBC is normalizing (14.6% of revenue in Q2 2026, down from 32.9% in FY2024), amortization from the ironSource deal is rolling off, and management expects GAAP profitability in Q3 2026, a quarter earlier than planned. For a company that lost money for a decade, that milestone matters more for credibility than for cash.
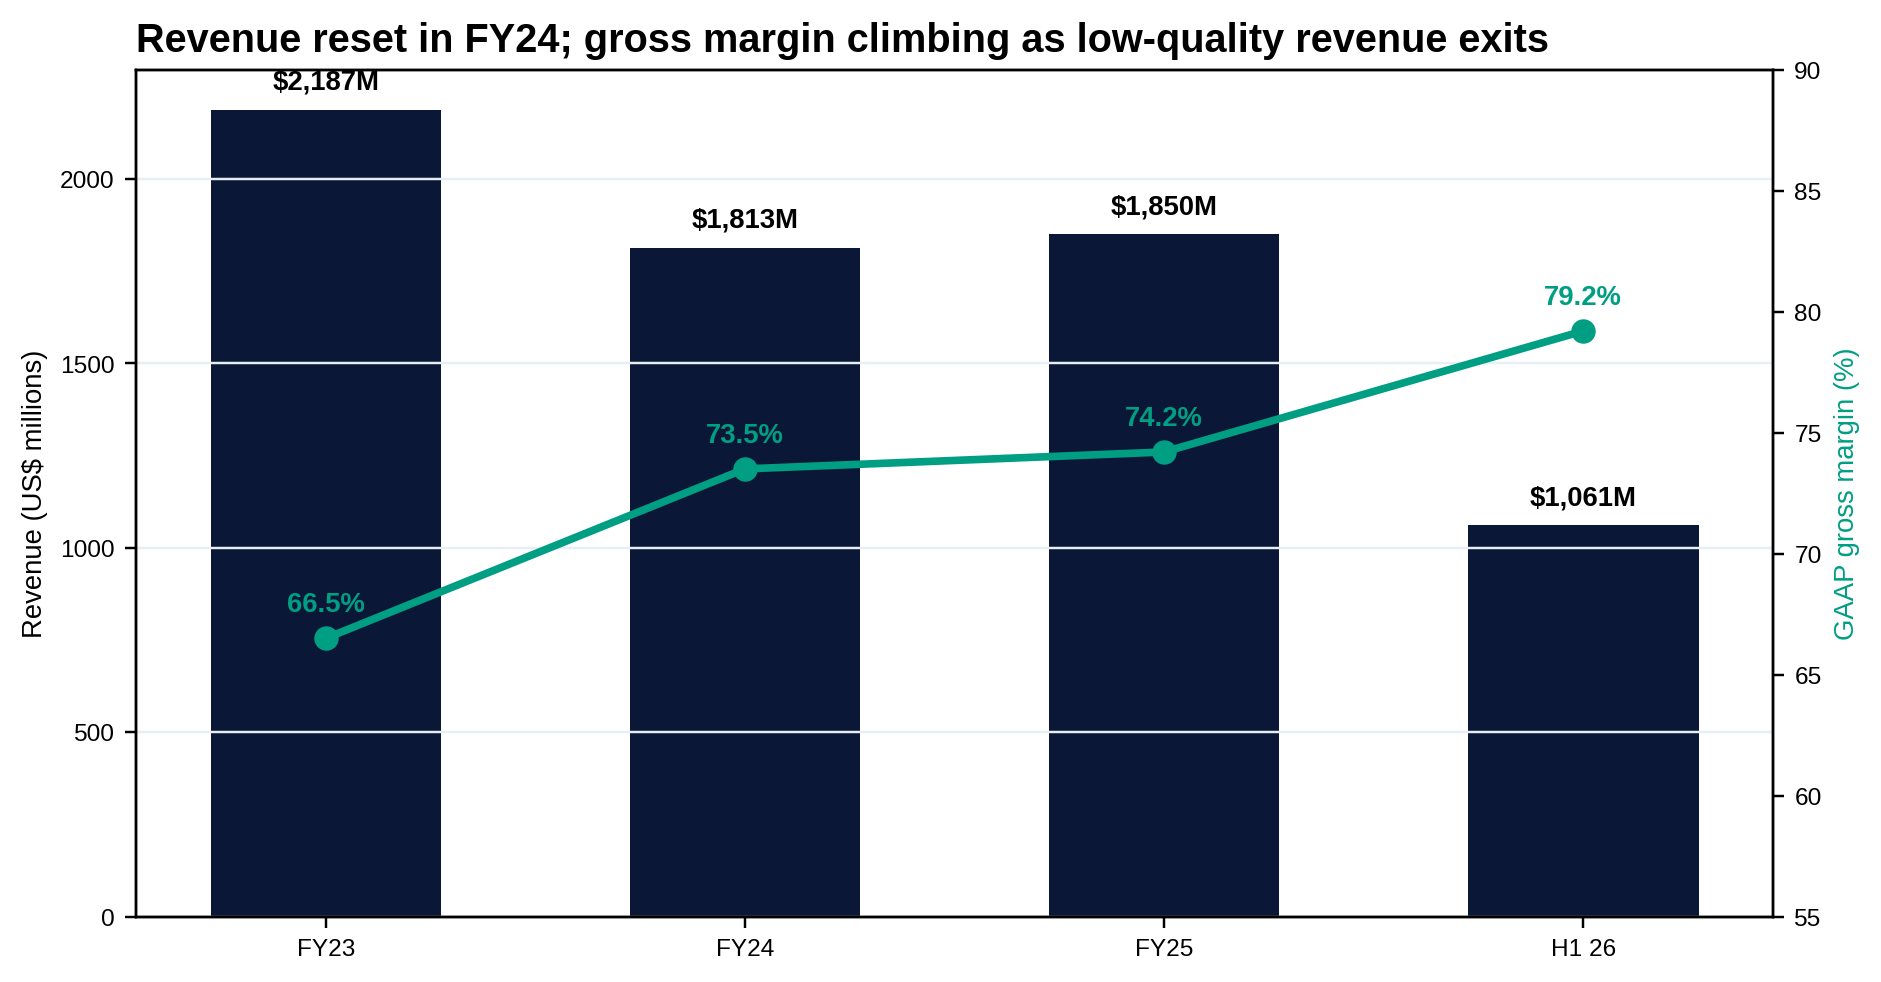
| Period | Revenue | GAAP gross margin | Operating expenses | SBC |
|---|---|---|---|---|
| FY2023 | $2.187B | 66.5% | $2.286B | $649M |
| FY2024 | $1.813B | 73.5% | $2.088B | $596M |
| FY2025 | $1.850B | 74.2% | $1.851B | $385M |
| H1 2026 | $1.061B | 79.2% | n/a | ~14.6% of rev (Q2) |
Meta Connect 2026 opened on September 23, 2026, the day of this report's reference price. The read-through for Unity:
The XR optionality in the Unity thesis is intact and slightly improved: more Quest-compatible hardware means more surfaces for Unity-built content. But this is not a standalone catalyst, and it does not change the FY2029 model. The September 24 developer sessions are worth checking for SDK-level detail, but the investment case does not depend on them.
At June 30, 2026, Unity held $2.352B of unrestricted cash against $2.237B of convertible-note carrying value: net cash of ~$115M. That is a genuine repair from the cash-burning years, and the B grade reflects it. But the maturity calendar demands attention:
| Notes | Principal | Terms | Status |
|---|---|---|---|
| 2026 converts | ~$558M | Due November 2026 | To be repaid from cash |
| 2027 converts | $1.0B | 2% coupon, converts at $48.89 | The key test: above $48.89 they convert to equity; below, Unity repays $1B in cash |
| 2030 converts | $690M | 0% coupon, converts at $36.15 | Already in the money at $44.10 |
With the stock at $44.10, the 2030 notes are in the money and the 2027 notes are ~11% out of the money. In the base case, continued execution pushes the stock through $48.89 and the 2027 notes convert, turning a maturity wall into equity. In the bear case, Unity repays $1B from a cash pile that would then be materially smaller, which is one reason the bear target assumes roughly zero net cash by FY2029.
Dilution math: conversion of the 2027 and 2030 notes would add roughly 35M shares (~8% of the current 440M). The FY2029 model uses ~470M diluted shares in the base case, which absorbs this plus ongoing SBC dilution of ~2% a year. SBC at 14.6% of revenue is still elevated versus mature software peers; continued normalization is part of the per-share story.
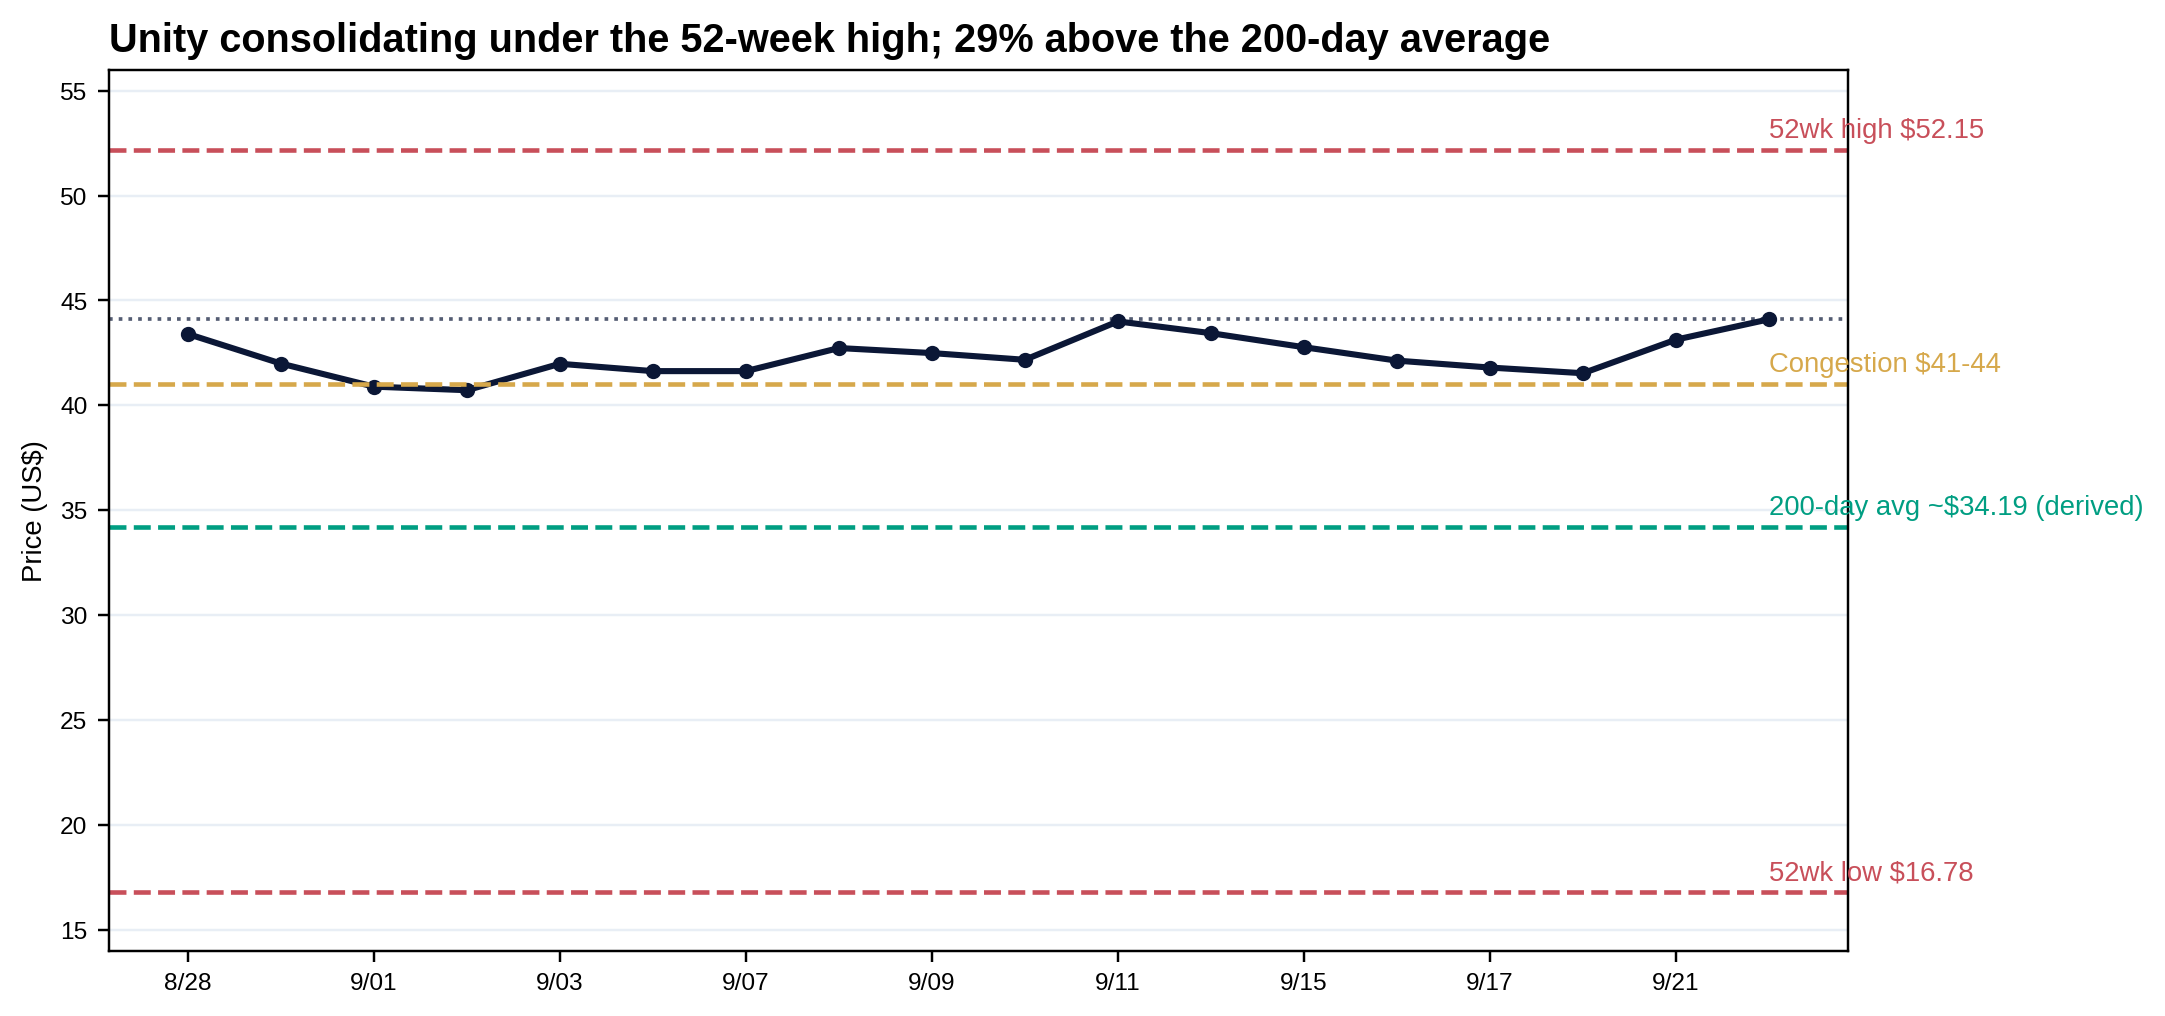
Technical grade: B+. Trend and structure are bullish, but extension tempers the grade. This is a chart to buy on pullbacks toward support, not to chase into strength.
At $44.10, Unity trades at ~9.6x trailing revenue and ~36x trailing adjusted EBITDA. The trailing multiple is the whole debate: it prices in several more years of margin expansion. The comps set the boundaries:
| Company | Price (Sep 23, 2026) | P/S (TTM) | EV / adj. EBITDA |
|---|---|---|---|
| Unity | $44.10 | 9.6x | ~36x (trailing) |
| AppLovin | $315.17 | 16.1x | 19.3x |
| Roblox | $48.90 | 6.1x | n/a |
| Autodesk | $217.41 | 5.8x | 20.6-22.7x |
| PTC | $140.84 | 5.0x | 12.7x |
AppLovin, the closest Grow comp, trades at 19.3x trailing EBITDA but earns 82-84% EBITDA margins. Autodesk, the closest Create comp, trades at ~21x with mid-30s margins and slower growth. Unity at 36x trailing is paying a full price for a margin story that has not finished: the multiple only makes sense if FY2029 EBITDA is roughly double today's, which is exactly what the 37% margin on ~$3.4B of revenue delivers.
Valuation grade: B-. This is not a cheap stock; it is a fairly priced turnaround where the upside must be earned through execution. The base-case return of +29% over three years reflects multiple compression (36x to 20x) even as EBITDA more than doubles. That is the honest arithmetic of buying a priced-in recovery.
Targets use an EV / adjusted EBITDA framework with net-cash adjustments, the cleanest lens for a company where SBC still distorts GAAP earnings. All three scenarios share the margin-bridge logic from page 7.
| Bear | Base | Bull | |
|---|---|---|---|
| FY2029 revenue | $2.5B | $3.4B | $4.3B |
| Implied revenue CAGR | ~7% | ~16% | ~23% |
| Adj. EBITDA margin | 22% | 37% | 40% |
| Adj. EBITDA | $550M | $1.26B | $1.72B |
| EV / EBITDA multiple | 12x | 20x | 24x |
| Net cash | ~$0 | +$1.5B | +$2.0B |
| Diluted shares | 480M | 470M | 465M |
| Target | $14 | $57 | $93 |
| Return from $44.10 | -68% | +29% | +111% |
Matthew Bromberg, CEO since May 15, 2024, is a former Zynga COO and a senior EA Mobile and BioWare operator. He had run a game-company turnaround before, which is the specific experience Unity needed. His record in 28 months:
The prior era is worth one paragraph for context: John Riccitiello's September 2023 Runtime Fee announcement caused a developer revolt that damaged trust in the engine business; he retired in October 2023. Bromberg's first year was substantially an exercise in undoing that damage, and the repair appears to have held: Create is growing again and pricing power has returned.
Assessment. Bromberg passes the engine's leadership test: he has scaled a turnaround before (Zynga), and he has done what he said he would do, quarter after quarter. The remaining question is whether he can manage a growth company rather than a turnaround, a test that starts about now.
More positive: Vector sustains 20%+ sequential growth for two more quarters; enterprise/industrial revenue gets disclosed and is material; the 2027 converts convert; SBC falls below 10% of revenue.
More negative: Vector decelerates sharply; strategic Grow growth falls below 20%; opex starts growing faster than revenue; the stock falls below $36 and stays there into 2027 (the 2030 converts' strike), threatening the 2027 maturity.
Unity under Bromberg is the rare turnaround where the numbers confirm the narrative: margins up ten points in six quarters, free cash flow compounding, the bad assets sold, the balance sheet repaired. The operating-leverage bridge to a 37% EBITDA margin by FY2029 is arithmetically sound if Vector keeps scaling and the cost base stays reset, and the $57 base target reflects it. But nothing here is cheap: at $44.10 the market has already underwritten most of the recovery, the bear case is a genuine -68%, and AppLovin is not standing still. This is a quality-execution story at a full price. Size it for the execution risk, and let the quarterly Vector prints do the talking.
Five pillars: 4 of 5 pass. Sunrise pass, Leadership pass, Moat partial, Iron-fortress pass, Free cash flow pass. See the companion five-pillar analysis for the full grading.
All company figures come from Unity's official releases and filings: the Q2 2026 shareholder letter and earnings release (August 6, 2026), the Q1 2026 release (May 7, 2026), the FY2025 10-K, and the June 30, 2026 balance sheet. Market data is as of the September 23, 2026 close unless stated. Competitor multiples use September 23, 2026 closing prices.
Estimates are labeled as such wherever they appear. The FY2029 scenarios, the margin bridge, trailing-twelve-month revenue and free cash flow, and the 200-day average derivation are analytical estimates built from disclosed figures, not company guidance. Segment-level gross margins are not disclosed by Unity; the margin bridge is constructed at the consolidated level and discussed qualitatively by segment.
What this report does not claim. It does not claim the original ironSource synergy targets were achieved (no authoritative disclosure confirms it). It does not claim verified effective dates or per-seat prices for the 2024 subscription increases (secondary reporting only). It does not assert Unity engine market-share figures or material Unity AI revenue (neither is verified). Meta Connect 2026 coverage reflects the September 23 opening keynote; the September 24 developer sessions postdate this report's reference price.
Methodology. Targets use an EV / adjusted EBITDA framework with net-cash adjustments and diluted-share counts that absorb convert conversion and ongoing SBC dilution. Grades follow the DalalBytes rubric: fundamental (business quality and trajectory), balance sheet (liquidity and leverage), technical (trend, structure, momentum), valuation (what the price assumes).
Fact pack compiled September 24, 2026. Reference price $44.10 (September 23, 2026 close). This report is for educational purposes only and is not investment advice.